Thermotropic behavior of unilamellar liposomes prepared from binary mixtures of phosphatidylcholines in aqueous suspensions was analyzed by means of the temperature dependence of the Zeta Potential (ZP). This technique presents high sensitivity and small amount of sample required, that is, 70% less than that required in the use of conventional calorimeters. A model function is proposed to adjust the thermotropic behavior of the DPPC-DMPC system. From the adjustment, temperature transition (Ttransition) data as a function of the composition are obtained. The objective of this paper is to propose, from those few Ttransition-composition data, a function that allows obtaining Ttransition for any composition of the mentioned system. Moreover, graph of phase boundaries for these mixed-lipid vesicles was constructed by plotting the delimiting temperatures of the main phase transition as a function of the lipid composition of the vesicle. The combination of the zeta potential technique and the mathematical processing of their data would be a simple and useful tool for determining the transition temperatures of more complex mixtures.
lipid mixtures, unilamellar vesicles, zeta potential, transition temperatures, mathematical model
Lipid membranes, which are the structural basis of biological membranes, can serve as an appropriate model for many biophysical studies. The approach to overcome the complexity of biological membranes relies in the use simplified biomimetic models consisting primarily binary lipid mixtures or ternary [1,2]. The phase behavior of the lipid components of the cell membrane is believed to be of great importance in the efforts to find out some the principles that underlie the membrane function [3]. The characterization of phase diagrams has been done for mixed lipid dispersions using various techniques such as differential scanning calorimetry [4], nuclear magnetic resonance [5], X-ray scattering [6], Fluorescence Microscopy [7], Laser Ultrasound [8] and ultrasonic velocimetry [9].
Aqueous dispersions of polar lipids are known to form a large variety of phases depending on the chemical structure, temperature, and dispersing media. Their phase behavior is characterized by the main phase transition associated with the melting of the lipid hydrocarbon chains. Transition temperatures of lipid mixtures are usually determined with relatively large uncertainty especially due to the typical broad peaks in many experimental techniques.
In a recent work [10] authors proposed temperature dependence of the zeta potential (ZP) as a tool to analyze the thermotropic behavior of unilamellar liposomes prepared from binary mixtures of phosphatidylcholines in aqueous suspensions. Since the lipid phase transition influences the surface potential of the liposome reflecting a sharp change in the ZP during the transition, it was proposed as a screening method for transition temperatures in complex systems, given its high sensitivity and small amount of sample required, that is, 70% less than that required in the use of conventional calorimeters. Many experimental studies dependent on temperature have been reported for lipid systems but predicting mathematical model for the phase behavior was absent [11-13].
When using experimentation as a tool to study the behavior of a system, much information is available, as tables or graphs, corresponding to certain measurements of the system. However, it is usually of interest to establish an analytical expression for variables that are considered dependent on one or more independent variables. To do this, different strategies that allow the correlation and approximation of the data are available, through different functions or mathematical models that attempt to reproduce and preserve the main characteristics of the data, obtaining an approach function that is differentiable, since these functions are associated with gradual change and are visualized as smooth curves. To eliminate the so-called "noises" it is preferable to use a strategy that consists of finding a function that is "close" to the data in a certain domain of interest but does not exactly pass through them.
The chosen system for this work, dipalmitoylphosphatidylcholine-dimyristoyl phosphatidylcholine (DPPC-DMPC), is one of the most studied binary phospholipidic mixtures in mimic biological membranes. A model function to adjust the temperature dependence of the Zeta Potential of this system is proposed. From the adjustment, data of Ttransition as a function of the composition are obtained. The objective of this paper is to propose, from these few Ttransition-composition data, a function that allows obtaining the Ttransition for any composition of the mentioned system. Moreover, it is expected that this same theoretical-experimental methodology could be applied to the study more complex lipid mixtures considering a new adjustment of the data.
Materials and experimental methods
Materials: 1,2-dimyristoyl-sn-glycero-3-phosphocholine (DMPC) and 1,2-dipalmitoyl-sn-glycero-3-phosphocholine (DPPC) were obtained from Avanti Polar Lipids Inc. (Alabaster, AL) and used as received. Chloroform was of analytical grade. Water used for preparing solutions is ultrapure milliQ water (Super Q Millipore system).
Liposome preparation: Liposomes were prepared from DMPC and DPPC, weighing appropriate amounts of each one in order to obtain compositions XDPPC = 0, 0.2, 0.5, 0.6, 0.8 and 1, where XDPPC is the mole fraction of DPPC in the mixture of liposomes without considering the solvent.
Each lipid and their mixtures were dissolved in chloroform that was removed by evaporation with N2 stream to obtain a dry lipid film. Remaining solvent was removed keeping the films under high vacuum for additional 2 h in Thermo Scientific Speed Vac SPD11V. The resulting dry lipid films were then hydrated with milliQ water pH 6.5, and homogenized with cycles of vigorous vortexing at around 10°C above the transition temperature of the lipids. This vortexing and heat combination yields a polydispersed population of MLVs.
Unilamellar vesicles were obtained by sequential extrusion of the MLVs dispersions in an Avanti Mini-Extruder, through a polycarbonate membrane of 100 nm pore size at around ten degrees centigrade above the transition temperature of the lipid mixture in the appropriate proportion taking into account the literature transition temperature [14-18]. The final conductivity of all the dispersions was slightly higher than that of MilliQ water. In the case of pH, no significative differences between the dispersions and MilliQ water were found.
Zeta potential: The size distribution of liposomes before and after extrusion and the zeta potentials of DMPC-DPPC liposomes were determined in a Zetasizer Nano ZS90 equipment (Malvern Instruments Ltd., UK). Measurements with DMPC, DPPC and DPPC-DMPC vesicles were performed in the range between 50°C and 20°C with successively lowered temperatures, allowing the sample to reach equilibrium between measurements, recording each point every 2°C with a stabilization period of 10 minutes at constant temperature before measuring. Reported data are the average of four different batches of liposomes.
The Sizes of liposomes were measured before and after temperature stabilization with good reproducibility. The values de pH and conductivity did not change during the determination of zeta potential.
Theoretical methods
We propose a methodology for the treatment of the data of the temperature dependence of the ZP method for determining lipid mixtures transition temperatures: first, a model function f (T, A) is used to predict the zeta potential of a DPPC-DMPC binary mixture of a given composition as a function of temperature (T) and an adjustment parameter (A). Vector A is calculated, which "adjusts" the function to the experimentally obtained zeta potential values according to certain predefined objectives. Then, using the adjustment function, the transition temperature and the delimiting temperatures corresponding to the start-point and end-point of the transition phase of the mixture used in each experiment are determined. Finally, from the different experimental results, quadratic functions to predict the delimiting temperatures of the phase change region were established and a linear function to predict the transition temperature for any mole fraction of DPPC was attained.
A set of experimental data  was considered, with n, number of measurements for DPPC-DMPC mixture,
  temperature and
  zeta potential. We wanted to find the n-vector A of parameters that gave the “best fit" to the model function
  By best fit we mean solved the optimization problem

called as least squares solution, because the sum of squares of differences between function model and data is minimized and usually known as regression analysis. The least squares criterion for data fitting can be expressed as minimizing the squared Euclidean norm of the residual vector with components

Because of the shape of the vs.T sequence, a linear combination of trigonometric functions as an adjusting model function is proposed:

being р a natural number selected according to the shape of the curve and A, a parameter vector.
Being A* the solution of the optimization problem (Eq. 1) and Ttransition the main transition temperature of the DPPC-DMPC mixtures, the abscissa of the turning point of  is estimated solving the non-linear equation
  with the Newton method.
The strategy to estimate the temperatures corresponding to the start-point and end-point of the phase transition is to identify the "sudden" change of curvature of the  curvature is calculated by:

Quadratic models to relate delimiting temperatures of the phase transition region, transition temperature and the mole fraction (X) of DPPC in the mixture are proposed:

In each case the parameter vector C was determined approximating the  data obtained from the
  , solving the problem

Being in this case the residual vector 
The model  was used to predict the delimiting temperatures of the transition region and transition temperature for any molar fraction
The procedure described in Section II A applies for liposomes from each lipid and its mixtures. For the results presented in this section codes were written in MatLab version 7.11.0584, 2010 on a personal computer Pentium® Dual-Core CPU T4400@ 2.20 GHz with 2.00GB memory RAM and system operative Window 7 Ultimate.
The experimental data of ζ versus T, the approximation curves  and the calculated transition temperatures for pure DMPC and DPPC liposomes in water are shown in Figure 1a and 1b.
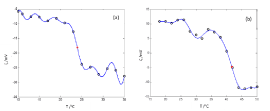
Figure 1. Zeta potential as a function of the temperature for liposomes prepared and dispersed in water. (a) DMPC liposome, Transition temperature 24.0°C. (b) DPPC liposome, Transition temperature 42.4°C.
ο Experimental Data, — Harmonic Functions Model, *Transition temperature. The standard deviation was lower than 10%, not shown for better viewing. Reported data were averaged over four different batches of liposomes
The experimental data of ζ versus T, the curves  and the calculated transition temperatures for 0.2, 0.5, 0.6 and 0.8 molar fractions of DPPC are shown in Figure 2a-2d respectively.
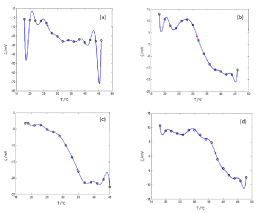
Figure 2.
Zeta potential as a function of T for mixtures of DPPC-DMPC prepared and dispersed in water. (a) XDPPC = 0.2, Transition temperature 26.4°C; (b) XDPPC = 0.5, Transition temperature 31.5°C; (c) XDPPC = 0.6, Transition temperature 34.7°C; (d) XDPPC = 0.8, Transition temperature 37.3°C.
ο Experimental Data,— Harmonic Functions Model, *Transition temperature. In all cases, the standard deviation was lower than 10%, not shown for better viewing. Reported data were averaged over four different batches of liposomes.
The curvature of the harmonic function model for zeta potential  (Eq. 3), the delimiting phase transition temperatures (blue points) and the transition temperatures (red point) for pure lipids and DPPC-DMPC mixtures in water are shown in Figure 3a-3f. Endpoints transition zone and the transition temperatures obtained from ZP adjusted curves are shown in Table 1.
Table 1. Endpoints transition zone and the transition temperatures obtained by ZP data for pure lipids and DPPC-DMPC mixtures in water.
XDPPC |
Endpoints transition/°C |
Ttransition/°C (eq. 2) |
0 |
[20.4, 27.2] |
24 |
0.2 |
[23.5, 32.2] |
26.4 |
0.5 |
[27.7, 38.0] |
31.5 |
0.6 |
[29.4, 38.2] |
34.7 |
0.8 |
[34.7, 42.0] |
37.3 |
1 |
[35.2, 46.0] |
42.4 |
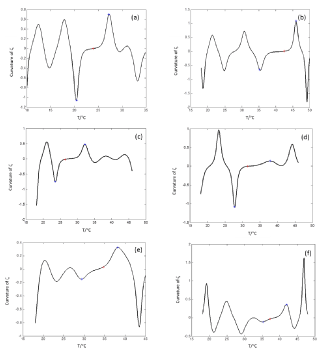
Figure 3. Curvature for the harmonic function model f(Ti,A*) for zeta potential as a function of T for pure lipids and DPPC-DMPC mixtures in water. (a) DMPC liposome, (b) DPPC liposome, (c) XDPPC = 0.2, (d) XDPPC = 0.5, (e) XDPPC = 0.6, (f) XDPPC = 0.8.
*Endpoints transition zone, *transition temperatures.
Finally, quadratic approximations (Eq. 4) for the delimiting phase transition temperatures and the transition temperatures are:

Figure 4 shows plots of phase boundaries for DPPC-DMPC mixtures using quadratic approximation model and it can be observed that quadratic model fits well to the shape of the sequence  of points.
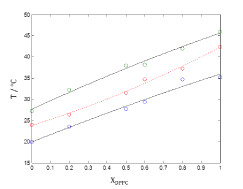
Figure 4. Plots of phase boundaries for DPPC-DMPC mixtures in water, using quadratic approximation model.
In order to verify the validity of the proposed methodology, we compared data theoretically obtained from equations 6 and 7, with experimental literature data obtained from DSC [14,19,20] for the DPPC-DMPC mixture. As shown in Table 2, a good correlation was obtained. In literature, phase diagrams of the DPPC-DMPC system can be found, from which phase-limiting temperatures can be obtained as a function of the composition. However, there are very few data about transition temperatures corresponding to the studied mixture. This is just one of the aims the present work accomplishes, that is, finding a relation between Ttransition and composition of the studied mixture. This relationship seems, as above evaluated, quadratic. In order to consider the possibility of applying a linear model instead of a quadratic one, for the purpose of simplifying calculations, the function would take the form:
Table 2. Theoretical-experimental comparative data of the phase transition temperature range for the binary mixture DPPC-DMPC.
Zeta potential as a function of T for mixtures of DPPC-DMPC prepared and dispersed in water. (a) XDPPC = 0.2, Transition temperature 26.38°C; (b) XDPPC = 0.5, Transition temperature 31.5°C; (c) XDPPC = 0.6, Transition temperature 34.67°C; (d) XDPPC = 0.8, Transition temperature 37.28°C.
ο Experimental Data,—Harmonic Functions Model, *Transition temperature. In all cases, the standard deviation was lower than 10%, not shown for better viewing. Reported data were averaged over four different batches of liposomes.
XDPPC |
Ttransition (linear eq. 10)/°C |
Ttransition (quadratic eq.8)/°C |
Limits of the phase transition (eq. 5 and 6) |
Limits of the phase transition from literature |
0.1 |
25.1 |
25.2 |
[21.7-29.6] |
[24.0-26.7]14
[23.0-26.9]20 |
0.3 |
28.7 |
28.4 |
[25.1-33.6] |
[27.5-31.0]14
[27.0-32.0]20 |
0.7 |
36.1 |
35.7 |
[31.5-40.7] |
[33.7-37.0]14
[32.0-36.5]20 |
0.9 |
39.8 |
40 |
[34.5-44.1] |
[38.0-41.0]14
[37.5-40.0]20 |

Whose linear approximation is:

Figure 5 shows plots of phase boundaries for DPPC-DMPC mixtures using linear approximation model for the transition temperature.
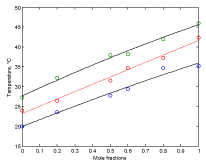
Figure 5. Plots of phase boundaries for DPPC-DMPC mixtures in water, using linear approximation model.
In order to evaluate whether the quadratic model or the linear model better approximates the behavior of the transition temperature with the composition of the DPPC-DMPC mixture, the residue norm is determined, which indicates the goodness of the fit. The residual norm decreases as the polynomial degree increases [21]. In the case of the quadratic model, the residual vector in equation 5 is 1.1 while it is 1.3 for the linear one.
A linear model for predicting the transition temperature based on the composition of the DPPC-DMPC mixture would be sufficient, although the use of a quadratic model would not imply an increase in computational cost.
Thermotropic behavior of unilamellar liposomes prepared from binary mixtures of phosphatidylcholines in aqueous suspensions was analyzed by means of the temperature dependence of the Zeta Potential.
Many experimental studies dependent on temperature have been reported for lipid systems but predicting mathematical model for the phase behavior was absent. In this work, a mathematical model for predicting the phase transition temperature of mixtures of DPPC-DMPC, at any proportion is proposed.
A linear model to predict the transition temperature based on the composition of the DPPC-DMPC mixture would be satisfactory, although the use of a quadratic model would not imply an increase in computational cost.
The diagram of phase boundaries for these mixed-lipid vesicles was constructed by plotting the delimiting temperatures of the main phase transition as a function of the lipid composition of the vesicle.
This work can be considered a starting point for further research into more complex lipid mixtures with functional biological importance.
Financial support from Consejo Nacional de Investigaciones Científicas y Técnicas (CONICET), Agencia Nacional de Promoción Científica y Técnica (ANPCyT) and Universidad Nacional del Sur (UNS) is gratefully acknowledged. MBS and MAM are members of the research career of CONICET. The authors thank Dr. Marcelo Avena for allowing the use of Zetasizer Nano ZS90 equipment; Lic. Eliana Pecini and Dr. Cristina Maciel for their advice.
- Bretscher MS (1973) Membrane structure: some general principles. Science 181: 622-629. [Crossref]
- Eeman M, Deleu M (2010) From biological membranes to biomimetic model membranes. Biotechnol Agron Société Environ 14: 719-736.
- Hirst LS, Uppamoochikkal P, Lor C (2011) Phase separation and critical phenomena in biomimetic ternary lipid mixtures. Liq Cryst 38: 1735-1747.
- Lewis RN, Pohle W, McElhaney RN (1996) The interfacial structure of phospholipid bilayers: differential scanning calorimetry and Fourier transform infrared spectroscopic studies of 1,2-dipalmitoyl-sn-glycero-3-phosphorylcholine and its dialkyl and acyl-alkyl analogs. Biophys J 70: 2736-2746. [Crossref]
- Jacobs R, Oldfield E (1979) Deuterium nuclear magnetic resonance investigation of dimyristoyllecithin-dipalmitoyllecithin and dimyristoyllecithin-cholesterol mixtures. Biochemistry (Mosc.) 18: 3280-3285.
- Sun WJ, Suter RM, Knewtson MA, Worthington CR, Tristram-Nagle S, et al. (1994) Order and disorder in fully hydrated unoriented bilayers of gel-phase dipalmitoylphosphatidylcholine. Phys Rev E 49: 4665-4676.
- Zhao J, Wu J, Heberle FA, Mills TT, Klawitter P, et al. (2007) Phase studies of model biomembranes: Complex behavior of DSPC/DOPC/Cholesterol. Biochim Biophys Acta 1768: 2764-2776.
- El-Sayed MY, Guion TA, Fayer MD (1986) Effect of cholesterol on viscoelastic properties of dipalmitoylphosphatidylcholine multibilayers as measured by a laser-induced ultrasonic probe. Biochemistry (Mosc.) 25: 4825-4832.
- Pfeiffer H, Klose G, Heremans K, Glorieux C (2006) Thermotropic phase behaviour of the pseudobinary mixtures of DPPC/C12E5 and DMPC/C12E5 determined by differential scanning calorimetry and ultrasonic velocimetry. Chem Phys Lipids 139: 54-67. [Crossref]
- Sierra MB, Pedroni VI, Buffo FE, Disalvo EA, Morini MA (2016) The use of zeta potential as a tool to study phase transitions in binary phosphatidylcholines mixtures. Colloids Surf B Biointerfaces 142: 199-206. [Crossref]
- Tamai N, Nambu Y, Tanaka S, Goto M, Matsuki H, et al. (2012) Volumetric characterization of ester- and ether-linked lipid bilayers by pressure perturbation calorimetry and densitometry. Colloids Surf B Biointerfaces 92: 232-239. [Crossref]
- Losada-Perez P, Mertens N, de Medio-Vasconcelos B, Slenders E, Leys J, et al. (2015) Phase Transitions of Binary Lipid Mixtures: A Combined Study by Adiabatic Scanning Calorimetry and Quartz Crystal Microbalance with Dissipation Monitoring. Adv. Condens. Matter Phys 2015: e479318.
- Tatulian SA (1983) Effect of lipid phase transition on the binding of anions to dimyristoylphosphatidylcholine liposomes. Biochim Biophys Acta 736: 189-195. [Crossref]
- Mabrey S, Sturtevant JM (1976) Investigation of phase transitions of lipids and lipid mixtures by sensitivity differential scanning calorimetry. Proc Natl Acad Sci U S A 73: 3862-3866. [Crossref]
- Rodríguez-Pulido A, Aicart E, Llorca O, Junquera E (2008) Compaction Process of Calf Thymus DNA by Mixed Cationic-Zwitterionic Liposomes:? A Physicochemical Study. J Phys Chem B 112: 2187-2197.
- Rodríguez-Pulido A, Ortega F, Llorca O, Aicart E, Junquera E (2008) A Physicochemical Characterization of the Interaction between DC-Chol/DOPE Cationic Liposomes and DNA. J Phys Chem B 112: 12555-12565.
- Rodríguez-Pulido A, Martín-Molina A, Rodríguez-Beas C, Llorca O, Aicart E, et al. (2009) A theoretical and experimental approach to the compaction process of DNA by dioctadecyldimethylammonium bromide/zwitterionic mixed liposomes. J Phys Chem B 113: 15648-15661. [Crossref]
- Lasic DD (1997) Liposomes in Gene Delivery. CRC Press.
- Shimshick EJ, McConnell HM (1973) Lateral phase separation in phospholipid membranes. Biochemistry 12: 2351-2360. [Crossref]
- Van Dijck PWM, Kaper AJ, Oonk HAJ, De Gier J (1977) Miscibility properties of binary phosphatidylcholine mixtures. A calorimetric study. Biochim Biophys Acta 470: 58-69. [Crossref]
- Davis PJ (1997) Interpolation and Approximation, Dover Publications, New York, 1975.

 was considered, with n, number of measurements for DPPC-DMPC mixture,
  By best fit we mean solved the optimization problem


 is estimated solving the non-linear equation
  with the Newton method.
 curvature is calculated by:

 data obtained from the
  , solving the problem

 was used to predict the delimiting temperatures of the transition region and transition temperature for any molar fraction
 and the calculated transition temperatures for pure DMPC and DPPC liposomes in water are shown in Figure 1a and 1b.


 of points.


