The article illustrates the results of a scientific research of heart rate variability (HRV) of a group of patients with type2 diabetes. This analysis is based on digital electrocardiograms and characterized as a non-invasive and effective tool to reflect the autonomic nervous system regulation of the heart. Heart rate variability is used to diagnose and estimate the alterations in heart rate by measuring the variation of the time intervals between two consecutive heart beats (RR) intervals. During the study RR time series of both healthy and type 2 diabetic patients are extracted from electrocardiograms through the “Polar Advantage Interface” device. The proposed study employed three methods for nonlinear analysis of the RR time series: Detrended Fluctuation Analysis (α1, p<0.0001; α2, p≈0.06; αall, p<0.05), Poincaré plot (SD1, p<0.05; SD2, p<0.0001; SD1/SD2, p<0.0001) and Rescaled adjusted range Statistics plot (H, p<0.0001). The results from the experiments conclude that these methods are suitable for diagnostic, forecast and prevention of the pathological statuses.
electrocardiogram (ECG), heart rate variability (HRV), nonlinear analysis, detrended fluctuation analysis (DFA), poincaré plot, rescaled adjusted range statistics plot (R/S)
Diabetes mellitus (DM) is a chronic, lifelong condition that affects the body's ability to metabolize the carbohydrates in order to release. Diabetes is a very common disease. Currently, there are about 366 million diabetic patients, which expected to reach 522 million by the year 2030 [1]. DM can cause cardiovascular autonomic neuropathy that is associated with increased cardiovascular mortality [2-4]. Therefore, the diagnosis and monitoring of diabetes is of a great significance. Diabetes can be easily diagnosed by measuring the HRV, which is a physiological phenomenon of variation in the time interval between heartbeats [5]. ECG is a non-invasive device that used to assess the HRV by measuring the time between heartbeats. In 1996, the European Society of Cardiology and North American Society of Pacing and Electrophysiology provided recommendations on clinical usage of the HRV for the evaluation of the risk for cardiology disease such as myocardial infarction (heart attacks) and sudden cardiac death [6]. The HRV measurements are nonlinear and non-stationary [7]. Through implementation of the conventional (linear) mathematical methods, part of the important characteristics of the signal dynamics is lost. The research, development and implementation of a new nonlinear mathematical schemes based on the fractal theory will allow to better estimate the cause for HRV fluctuations. These nonlinear methods are based on the relationship between the HRV’s characteristics, such as the self-similarity, scalability, fractal dimension, long-range dependence [8,9], which are quite similar to those of the fractal geometry. The cardiac data generated by using nonlinear methods can provide detailed information about the physiological status of the patients as well as develop break-through knowledge regarding the diagnostics, prognosis and prevention of cardiovascular disease pathology. Recently, the nonlinear analysis of the cardiology data becomes a new scientific trend that presents a novel concept for the heart activity dynamics.
The main objective of this article is to evaluate the impact of Type 2 Diabetic mellitus (T2DM) on HRV by using three graphical nonlinear methods: Detrended Fluctuation Analysis, Poincaré plot and Rescaled adjusted range Statistics plot.
The study group consisted of 25 patients (mean age 52.8 ± 5.1 years) diagnosed with T2DM. The control group consisted of 22 healthy subjects (mean age 50.3 ± 4.5 years). All patients are subject to a 5 minute record of the RR time intervals. The RR time series are extracted from the ECG signals using the “Polar Advantage Interface” device (Polar Electro, Finland). The current work developed software for the HRV analysis based on the mentioned graphical nonlinear methods [16].
Detrended fluctuation analysis
The DFA [10] is a technique for detecting correlations in time series. These functions are able to estimate several scaling exponents from the RR time series being analyzed. The scaling exponents characterize short or long-term fluctuations.
The main steps of the DFA algorithm are as follows [10]:
- The RR interval time series is integrated using:
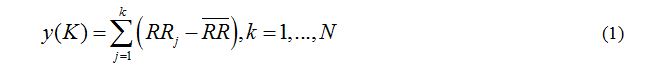
Where:
- y(k) is the kth value of the integrated series;
- RRj is the jth inter beat interval;
 is the average inter beat interval over the entire series.
- The integrated time series is divided into boxes of equal length n.
- In each box of length n, a least square line is fitted to the RR interval data and yn(k) denotes the regression lines.
- The integrated series y(k) is detrended by subtracting the local trend in each box. The root-mean-square fluctuation of this integrated and detrended series is calculated by:
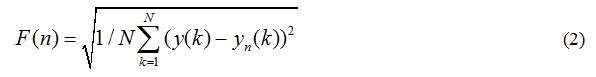
Where: F(n) is a fluctuation function of box size n.
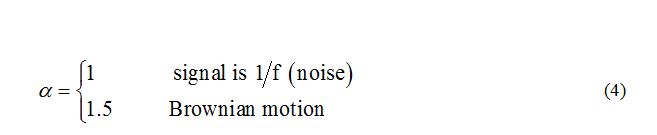
- This procedure is repeated for different time scales. The relationship on a double-log graph between fluctuations F(n) and the time scales n can be approximately evaluated by a linear model that provides the scaling exponent α given by:

The parameter α depends on the correlation properties of the signal. By changing the parameter n can be studied how to change the fluctuations of the signal. Linear behavior of the dependence F(n) is an indicator of the presence of a scalable behavior of the signal. The value of the parameter α is determined from the slope of the straight line. For uncorrelated signals, the value of this parameter is within the range (0, 0.5), where α > 0.5 indicates the presence of correlation. While, for
In the case of RR time series, the DFA shows typically two ranges of scale invariance, which are quantified by two separate scaling exponents, α1 and α2, reflecting the short-term and long-term correlation [11].
Poincaré plot
The Poincaré plot analysis is a graphical nonlinear method to assess the dynamic of HRV. This method provides summary information as well as detailed beat-to-beat information on the behavior of the heart. It is a graphical representation of temporal correlations within the RR intervals derived from the ECG signal. The Poincaré plot is a return maps or scatter plots, where each RR interval from time series RR = {RR1, RR2, …, RRn, RRn+1} is plotted against the next RR interval. The Poincaré plot parameters used in this paper are SD1, SD2 and SD1/SD2 ratio. SD1 is the standard deviation of projection of the Poincaré plot on the line perpendicular to the line of identify. While, the SD2 is defined as the standard deviation of the projection of the Poincaré plot on the line of identify (y=x). These parameters can be defined by following equations [12,13]:
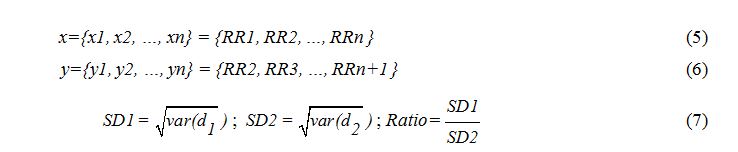
Where:
- i = 1, 2, 3, …, n and n is the number of points in the Poincare plot;
- var(d) is the variance of d;
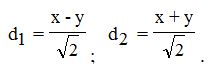
The parameter SD1 has been correlated with high frequency power, while SD2 has been correlated with both low and high frequency powers. The ratio SD1/SD2 is associated with the randomness of the HRV signal. Thus, this ratio is a measure of the randomness in HRV time series. It has been suggested that the ratio SD1/SD2 has the strongest association with mortality in adults.
Rescaled adjusted range Statistics plot
The rescaled range is a statistical measure of the variability of a time series introduced by British hydrologist Harold Hurst [14]. Closely associated with R/S method is the Hurst exponent. This exponent is used to evaluate the presence or absence of the long-range dependence and its degree in a time series. Based on the Hurst exponent value, the following classifications of the time series can be realized:
- H=0.5 indicates a random series;
- 0<H<0.5 indicates that the data in the signal are anti-correlated;
- 0.5<H<1 indicates that the data in the signal are long-range correlated.
The R/S for the time series X(n) is asymptotically given by a power law:
Where:
- R(n) is the range which is the difference between the minimum and maximum accumulated values;
- S(n) is the standard deviation estimated from the observed data X(n);
- H is the Hurst exponent.
To estimate the Hurst exponent, the plot of R(n)/S(n) versus n in log-log axes is done. The slope of the regression line approximates the Hurst exponent [15]. This exponent characterization of the fractal structure of the self-similar signals.
Statistical analysis
The results were presented as mean ± standard deviation (SD). Differences between the parameters of the groups were tested by the unpaired t test. A p-value of <0.05 was regarded as statistically significant. The derived HRV indices were statistically tested using receiver operating characteristics (ROC). Statistical analysis was performed using the IBM SPSS Statistics, Version 23 (IBM Corp., USA).
The described mathematical methods are implemented in the form of specialized software for the calculation and assessment of HRV parameters. The analyzed data from the medical study of patients were combined into two groups of signals: for 25 patients diagnosed with T2DM and 22 normal subjects.
Figure 1 illustrates the main software menu for each patient. The menu shows distribution of the QRS complexes (combination of three of the graphical deflections seen on the ECG), RR intervals and results of time-domain analysis (the values of investigated parameters, RR and HR histograms). It is available to opt one of the following analyses: time-domain, frequency-domain, nonlinear and wavelet analysis from this page [16]. The current work illustrated the results of the nonlinear analysis.
Figure 1. Proposed software main menu for HRV analysis [16]
Figure 2(left) and Figure 2(right) demonstrated the RR signals of normal and T2DMpatients. The fluctuations of the heart-beat time series are larger in healthy subject compared to T2DM patients.
Figure 2. RR-interval signal of a healthy subject (left) and diabetic patient (right)
Figure 3(left) and Figure 3(right) showed the values of scaling exponents and the slope of the line F(n) on double logarithmic plot obtained by using the DFA method for the investigated signals. The results showed difference between values of the scaling exponents α1 and α2 for T2DM patient and healthy one.
Figure 3. DFA analysis of a healthy subject (left) and diabetic patient (right)
The results of the Poincaré plot analysis of RR time series for healthy subject and T2DM patients are displayed in Figure 4 (left) and Figure 4 (right). The Poincaré plot for healthy subject is a cloud of points in shape of an ellipse. On the other hand, points for patient with T2DM are a cloud of points in shape of a circle. The geometry of these plots has been shown to distinguish between healthy and unhealthy subjects.
Figure 4. Poincaré plot analysis of a healthy subject (left) and diabetic patient (right)
The results of the R/S method applied to the studied signals to determine the value of the Hurst exponent are shown in Figure 5 (left) and Figure 5 (right). The obtained results demonstrated that the RR time series are correlated, i.e., they are fractal time series.
Figure 5. R/S analysis of a healthy subject (left) and diabetic patient (right)
Diabetes causes cardiovascular autonomic neuropathy that affects the HRV. The main finding of the present study concluded that the HRV significant is differed between the T2DM patients and of healthy subjects. The effects of T2DM on different HRV parameters are evaluated using data from 25 patients with T2DM and 22 healthy subjects.
Various literatures were concerned with the study of the cardiac signal analysis and measurements [16-21]. Meanwhile, from the current study the following significant discussion can be given based on the experimental results obtained concerned with the HRV nonlinear analysis.
The DFA method is used to quantity the fractal scaling properties of RR time signals. The values of fractal scaling exponents for T2DM patients are lower than for the healthy one.
The Poincaré plot parameters are directly related to the physiology of the heart. The parameter SD1 is the reflection of short term variability of heart rate and parameter SD2 is the measure of long-term variability. The values of these two parameters are lesser in normal subjects than for the T2DM patients.
The values of the Hurst exponents of T2DM patients are smaller than these of healthy subjects. The scientific researches [7,9] determined the Hurst exponent decrease of physical, mentally activity and cardio disease. The investigation of dependence between the value of the Hurst exponent and the cardiology status could be used for diagnosis and prognosis of cardio disease.
The values of the investigated parameters for DM type 2 and healthy subjects are reported in Table 1. The derived HRV indices were statistically tested using ROC. The ability of ROC to discriminate between diabetic and healthy patient population was determined by studying the area under the ROC curve (AUC), sensitivity and specificity (Table 2).
Table 1. Parameters for DM type 2 and healthy subjects
Parameter |
Diabetic Patients |
Healthy Subjects |
P value |
α1 (DFA) |
0,594 ± 0,173 |
0,792 ± 0,075 |
< 0.0001 |
α2 (DFA) |
0,769 ± 0,184 |
0,848 ± 0,057 |
0.0597 |
αall (DFA) |
0,739 ± 0,137 |
0,825 ± 0,033 |
< 0.05 |
SD1[ms] (Poincaré plot) |
53,512 ± 11,719 |
66,357 ± 16,084 |
< 0.05 |
SD2[ms] (Poincaré plot) |
62,580 ± 19.135 |
93,244 ± 15,774 |
< 0.0001 |
SD1/SD2(Poincaré plot) |
0,925 ± 0,177 |
0,726 ± 0,062 |
< 0.0001 |
Hurst (R/S) |
0,609 ± 0,110 |
0,818 ± 0,182 |
< 0.0001 |
Table 2. Analysis of HRV parameters using ROC
Parameter |
Sensitivity (%) |
Specificity (%) |
AUC |
95% Confidence Interval
(Lower Bound-Upper Bound) |
α1 (DFA) |
72.87 |
55.24 |
0.724 |
(0.510-0.938) |
α2 (DFA) |
60.21 | 2021 Copyright OAT. All rights reserv
59.61 |
0.371 |
(0.138-0.604) |
αall (DFA) |
77.68 |
46.28 |
0.776 |
(0.582-0.971) |
SD1[ms] (Poincaré plot) |
73.50 |
42.30 |
0.829 |
(0.655-1.000) |
SD2[ms] (Poincaré plot) |
70.64 |
42.82 |
0.752 |
(0.547-0.958) |
SD1/SD2(Poincaré plot) |
83.33 |
52.86 |
0.962 |
(0.891-1.000) |
Hurst (R/S) |
67.63 |
51.80 |
0.767 |
(0.567-0.966) |
The HRV analysis is a popular noninvasive tool for assessing the activities of the cardiovascular autonomic dysfunction. Three nonlinear methods to identify the parameters associated with HRV were applied. The values of these parameters were different for both T2DM and healthy subjects. These nonlinear methods are quite useful for diagnosing the disease at an early stage as well or determining the extent. The developed application software for the illustrated above methods, designed for nonlinear analysis of ECG signals, could be utilized by physicians as an additional mathematical tool for presentation of pathological status of patients.
- Huang NE, Shen Z, Long SR, Wu MC, Shih HH, et al. (1998) The empirical mode decomposition and the Hilbert spectrum for nonlinear and non-stationary time series analysis. Proc R Soc London A 454: 903–995.
- Wu Z, Huang NE (2009) Ensemble empirical mode decomposition: a noise-assisted data analysis method. Adv Adapt Data Anal 1 : 1–41.
- Yeh JR, Shieh JS (2010) Complementary ensemble empirical mode decomposition: a novel noise enhanced data analysis method. Adv Adapt Data Anal 2: 135–156.
- El’hadi Bekka R, Berrouche Y (2013) Improvement of ensemble empirical mode decomposition by over-sampling. Adv Adapt Data Anal 5. 1350012.
- Colominas MA, Schlotthauer G, Torres ME (2014) Improved complete ensemble EMD: A suitable tool for biomedical signal processing. Biomed Signal Process Control 14: 19–29.
- Xue X, Zhou J, Xu Y, Zhu W, Li C (2015) An adaptively fast ensemble empirical mode decomposition method and its applications to rolling element bearing fault diagnosis. Mech Syst Signal Process 62–63: 444–459.
- Iatsenko D, McClintock PVE, Stefanovska A (2015) Nonlinear mode decomposition: A noise-robust, adaptive decomposition method. Phys Rev E Stat Nonlin Soft Matter Phys 92: 032916. [Crossref]
- Iatsenko D, McClintock PVE, Stefanovska A (2015) Linear and synchrosqueezed time-frequency representations revisited: Overview, standards of use, resolution, reconstruction, concentration, and algorithms. Digit Signal Process 42: 1–26.
- Sheppard LW, Stefanovska A, McClintock PVE (2011) Detecting the harmonics of oscillations with time-variable frequencies. Phys Rev E Stat Nonlin Soft Matter Phys 83: 016206. [Crossref]