An alteration of pathophysiology in critically ill patients, resulting in pharmacokinetic change, are important factors in determining the therapeutic outcome of b-lactam antibiotics. The aims of this study were to reveal the population PK and assess the probability of target attainment (PTA) of imipenem in order to be able to optimize dosing recommendations for treatment of patients with VAP. Patients were randomized into two groups: Group I received a 0.5-h infusion of 0.5 g every 6 h (q6h) for nine doses and Group II received a 4-h infusion of 1 g q8h for seven doses. A Monte Carlo simulation was performed to determine the PTAs of achieving 20% T>MIC (exposure time during which the free drug concentration remains above the minimum inhibitory concentration (MIC)) and 40% T>MIC. The volume of distribution (Vd) and total clearance (CL) of imipenem were 15.89 L and 20.87 L/h, respectively. The high PTA (≥90%) achieving 40% fT>MIC for MICs of 4 μg/mL was observed when imipenem was administered by a 4-h infusion of 1 g q8h or 1 g q6h. These findings showed that the values of Vd and CL of imipenem in this patient population were greater than the values obtained from healthy subjects. A higher than recommended dosage regimen of imipenem may be required to optimize pharmacodynamic targets.
critically ill patients, imipenem, pharmacodynamic, population pharmacokinetics, ventilator-associated pneumonia
Ventilator-associated pneumonia (VAP), a common nosocomial infection, remains a leading cause of high morbidity and mortality in critically ill patients in Intensive Care Units (ICUs) [1]. Over the past decades, there has been an increase in hospital acquired multidrug resistant microorganisms, and coverage of these organisms is becoming very challenging [2]. Therefore, one of the strategies to deal with these drugs is ascertaining optimal dosing regimens of the current antimicrobial agents. Imipenem, a b-lactam antimicrobial agent, is still one of the most widely prescribed antibiotics for empirical treatment of nosocomial infections with highly resistant pathogens in this patient population [3]. In common with other b-lactams, this drug exhibits primarily time-dependent antimicrobial activity and the pharmacokinetic/pharmacodynamic (PK/PD) index that best correlates with its efficacy is the exposure time during which the plasma concentration remains above the minimum inhibitory concentration (T>MIC) of the pathogen [4]. An adequate level of plasma concentrations of antimicrobial agents has been shown to be the most important factor for achieving optimal PD targets, leading to therapeutic success. However, PK changes, including Vd and CL, have been found to be associated with several hydrophilic antibiotics in critically ill patients [5]. The aims of this study were i) to reveal the population PK of imipenem; and ii) to assess the probability of target attainment (PTA) of imipenem in order to be able to optimize dosing recommendations.
Subjects
This study was conducted in patients with VAP admitted into the Intensive Care Unit (ICU) of Songklanagarind Hospital. The patients were eligible for the study if they met the following criteria: (i) older than 18 years; (ii) were intubated and receiving mechanical ventilation for ≥48 h; and (iii) were clinically suspected to have developed VAP, as defined by a new and persistent infiltrate on chest radiography associated with at least one of the following: purulent tracheal secretions, temperature of 38.3°C or higher or a leucocyte count higher than 10000 cells/mm3. Patients were excluded from the study if they were pregnant or in circulatory shock (defined as a systolic blood pressure < 90 mmHg) or had documented hypersensitivity to imipenem or an estimated creatinine clearance (CLCr) by the Cockcroft–Gault method of < 60 mL/min. The protocol for the study was approved by the Ethics Committee of Songklanagarind Hospital, and written informed consent was obtained from each subject’s legally acceptable representative before enrolment.
Drugs and chemicals
Imipenem (Tienam®) was donated from MSD, Bangkok, Thailand. Imipenem standard powder was donated by Merck & Co, Inc., Elkton, VA, USA, as pure powder. All the solvents were of high-performance liquid chromatography (HPLC) grade.
Study design
Patients were allocated by simple randomization into two groups. Group I received a 0.5-h infusion of 0.5 g of imipenem diluted in 100 mL of normal saline solution via an infusion pump at a constant flow rate every 6 h (q6h) for nine doses, and Group II received a 4-h infusion of 1 g of imipenem diluted in 100 mL of normal saline solution via an infusion pump at a constant flow rate q8h for seven doses. A Monte Carlo simulation (MCS) was performed to predict the efficacy of various dosage regimens. After completion of the 3-day study regimen, all patients were appropriately treated with antibiotics for 10 days.
Blood sampling
The imipenem PK studies were carried out during administration of the ninth dose of Group I regimens and seventh dose of Group II regimens. Blood samples (~3 mL) were obtained by direct venipuncture at the following times: before (time zero) and 0.25, 0.5,0.75, 1, 2, 3, 4, 5 and 6 h after the ninth dose in the Group I regimen and before (time zero) and 1, 2, 4, 4.5, 5, 6, 7 and 8 h after the seventh dose in the Group II regimen. The blood samples were added to a heparinized tube, immediately stored on ice, and centrifuged at 1000 g at 4oC for 10 min within 5 min. An equal volume of stabilizing solution [0.5 M 3-(N-morpholino) propanesulfonic acid (MOPS)/water/ethylene glycol, 2:1:1, v/v/v] was added to each plasma sample, which was then vortexed and stored at -80oC until analysis within 1 week.
Imipenem assay
The concentrations of imipenem were determined by reversed-phase HPLC [6]. A 10 mL aliquot of the sample was injected onto a Nova-Pak C18 column (Waters Associates), using an automated injection system (Waters 717 plus Autosampler, Waters Associates). The mobile phase was 0.2 M borate buffer, pH 7.2, at a flow rate of 1 mL/min. The column effluent was monitored by UV detection (Waters 486, Waters Associates) at 300 nm. The peaks were recorded and integrated on a Waters 746 Data Module (Waters Associates). The limit of detection of imipenem was 0.125 µg/mL.
PK analysis
It was found that a two-compartment model is adequate for describing distribution phase of imipenem [7,8], so it was employed in this study. Due to the high values of the rate constants in the differential equations, computation instabilities were expected, hence Taylor series expansion method [9] was used to solve the differential equations to avoid this problem by computing them until convergence of the final results was achieved. Taylor series computation was performed using in-house Visual Basic programming in Microsoft Excel (Microsoft Corp.) spreadsheets.
The PK parameters were obtained by nonlinear regression to minimize the objective function of the sum square errors (SSEs), with the following equation:
The errors was computed in logarithmic scale in order to properly describe excretion phase. For β-lactam antibiotics, excretion phase accuracy is very important for efficacy simulation. Minimization of the objective function was performed by using Solver Add-in available in Microsoft Excel with varying initial guess of parameters to obtain local minima. Heuristic random optimization method as has been described elsewhere [10,11] was used stepwise in the next stage to ascertain the global minima.
PD assessment using a MCS
We found that the PK parameters obtained were log-normal distribution, thus logarithmic scales for all parameters were used in our MCS calculations.
The simulations were performed using the Visual Basic language program. A set of PK parameters were simulated by Box-Muller transform [12] from geometric mean and geometric standard deviation of each parameter obtained in this study (Table 1). All simulated PK parameters were weighted with Cholesky decomposition matrix of their covariance matrix in order to mimic the behavior of actual PK parameters. The simulated parameters were validated to have their statistical properties (i.e., average, standard deviation, and covariance matrix) equivalent to the actual parameters obtained. An MCS simulation was performed by using the simulated parameters to solve the differential equations involved in order to obtain concentration-time profiles. This stage were performed by writing a small basic language program with QB compiler (a product by Microsoft Corp) and run in Microsoft Windows OS. This stage used RK4 algorithm for solving differential equation for ease of implementation. Stiff differential equation could be handled by using very small time increment. The process may be slower, but the software could run in massively parallel manner. For each assigned value of MIC, % time above MIC (%fT>MIC) could be determined. We used 10,000 simulations to see the behavior of % fT>MIC at 2 different target levels, 20% and 40% attainment. The cross-tabulation relationship in the MIC vs % fT>MIC attainment represented the whole spectrum of microbial behavior in the study.
Eight patients were enrolled in the study, four males and four females with a mean age of 51.37 ± 11.54 years (range 34-66 years) and mean weight of 53.45 ± 14.81 kg (range 33-70 kg). The characteristics of all patients are shown in Table 1. The population PK parameters of imipenem are shown in Table 2. All the tested covariates had no identifiable influence on the PK parameters. The PTAs for the imipenem regimens achieving 20% fT>MIC and 40% fT>MIC at specific MICs are shown in Table 3 and Figure 1.
Table 1. Characteristics of the 8 ventilator-associated pneumonia patients
Patient |
Age (years) |
Sex |
Weight (kg) |
CLCra (mL/min) |
Underlying diagnosis |
Pathogen |
1 |
52 |
Female |
36.6 |
76.05 |
Arial septal defect, community-acquired pneumonia, pulmonary embolism right lung |
Klebsiella pneumonia, Pseudomonas aeruginosa |
2 |
39 |
Female |
63 |
159.83 |
Ruptured cerebral aneurysm |
Moraxella catarrhalis |
3 |
66 |
Male |
70 |
79.06 |
Subarachnoid hemorrhage |
Acinetobacter baumannii |
4 |
62 |
Male |
33 |
132.41 |
Bronchiectasis |
Pseudomonas aeruginosa |
5 |
53 |
Male |
50 |
68.66 |
Empyema thoracis left lung |
Pseudomonas aeruginosa |
6 |
61 |
Female |
62 |
94.79 |
Multiple traumatic bone fracture with septic shock |
Pseudomonas aeruginosa |
7 |
44 |
Female |
43 |
157.2 |
Esophagocutaneous fistula |
Klebsiella pneumoniae Stenotrophomonas maltophilia |
8 |
34 |
Male |
70 |
110.81 |
Upper gastrointestinal hemorrhage |
Pseudomonas aeruginosa |
Table 2. Pharmacokinetic (PK) parameters of imipenem in the 8 ventilator-associated pneumonia patients following administration by 0.5-h and 4-h infusion.
a standard deviation, b confidence interval, c intercompartmental transfer rate constant from compartment X1 to X2, d intercompartmental transfer rate constant from compartment X2 to X1, e elimination rate constant from X1, f volume of distribution,
g total clearance
Parameter |
Geometric mean |
Geometric S.D.a |
Median |
95%CIb |
k12c (/h) |
3.270 |
3.424 |
2.275 |
0.820-17.358 |
k21d (/h) |
2.994 |
2.013 |
2.917 |
1.200-7.901 |
kee (/h) |
1.423 |
1.874 |
1.259 |
0.732-4.486 |
Vdf (L) |
15.891 |
2.323 |
17.682 |
4.015-49.624 |
CLg (L/h) |
20.870 |
1.489 |
20.177 |
12.848-40.991 |
Table 3. Probability of target attainment (PTA) for imipenem regimens achieving 20% fT>MIC and 40% fT>MIC in ventilator-pneumonia patients following administration by 0.5-h and 4-h infusion
a minimum inhibitory concentration, b time that concentration in tissue and serum are above the MIC; q6h, every 6 h; q8h, every 8h
MICa (mg/L) |
PTA 20% fT>MICb |
PTA 40% fT>MIC |
0.5-h infusion |
4-h infusion |
0.5-h infusion |
4-h infusion |
|
q6h |
q8h |
q6h |
q8h |
q6h |
q8h |
q6h |
q8h |
0.5 g |
1 g |
0.5 g |
1 g |
0.5 g |
1 g |
0.5 g |
1 g |
0.5 g |
1 g |
0.5 g |
1 g |
0.5 g |
1 g |
0.5 g |
1 g |
0.0625 |
100 |
100 |
100 |
100 |
100 |
100 |
100 |
100 |
100 |
100 |
99.8 |
99.9 |
100 |
100 |
100 |
100 |
0.125 |
100 |
100 |
100 |
100 |
100 |
100 |
100 |
100 |
100 |
100 |
99.6 |
99.9 |
100 |
100 |
100 |
100 |
0.25 |
100 |
100 |
100 |
100 |
100 |
100 |
100 |
100 |
99.9 |
100 |
98.8 |
99.5 |
100 |
100 |
100 |
100 |
0.5 |
100 |
100 |
100 |
100 |
100 |
100 |
100 |
100 |
99.5 |
99.9 |
96.1 |
98.7 |
100 |
100 |
100 |
100 |
1 |
100 |
100 |
99.9 |
100 |
100 |
100 |
99.9 |
100 |
97.8 |
99.6 |
85.3 |
96.0 |
99.9 |
100 |
99.8 |
100 |
2 |
99.6 |
100 |
98.7 |
100 |
97.9 |
100 |
97.3 |
100 |
80.7 |
97.6 |
47.1 |
85.2 |
95.5 |
99.9 |
90.2 |
99.9 |
4 |
87.5 |
99.7 |
65.5 |
98.6 |
58.5 |
97.8 |
55.7 |
97.3 |
20.2 |
80.7 |
5.0 |
46.8 |
41.1 |
95.1 |
23.6 |
90.4 |
8 |
11.4 |
87.3 |
2.5 |
65.5 |
1.8 |
59.5 |
1.2 |
55.0 |
0.1 |
19.6 |
0.0 |
5.5 |
0.4 |
41.1 |
0.1 |
22.9 |
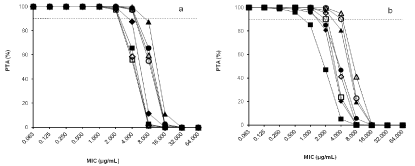
Figure.1. Probability of target attainment (PTA) for imipenem regimens achieving (A) 20% fT>MIC and (B) 40% fT>MIC at specific minimum inhibitory concentrations (MICs) in 8 patients with ventilator-associated pneumonia after administration of a 0.5-h infusion of 0.5 g every 6 h (q6h) (¨), a 4-h infusion of 0.5 g q6h (à), a 0.5-h infusion of 1 g q6h (▲), a 4-h infusion of 1 g q6h (∆), a 0.5-h infusion of 0.5 g every 8 h (q8h) (■), a 4-h infusion of 0.5 g q8h (□), a 0.5-h infusion of 1 g q8h (●) and a 4-h infusion of 1 g q8h (○). The broken line represents 90% PTA. fT>MIC, time that concentrations in tissue and serum are above the MIC.
An alteration of pathophysiological conditions in critically ill patients can result in PK changes, including Vd and CL, of antimicrobial agents. The increase of Vd and enhanced antimicrobial renal clearance of antibiotics can lead to reduced drug concentrations [13]. A previous PK/PD analysis of tigecycline exposure as measured by steady-state area under the drug concentration-time cure at 0-24 h showed that drug exposure in patients with VAP was lower compared to patients with hospital-acquired pneumonia [14]. The current study found that the Vd and CL of imipenem were greater than the values obtained from a previous study in healthy volunteers [15]. For VAP caused by extracellular respiratory pathogens, drug concentrations in the pulmonary epithelial lining fluid (ELF) should be the primary determinants for therapeutic efficacy [16]. However, antibiotic concentrations in the ELF are very difficult to determine and the correlation between the PK/PD index in the ELF and antimicrobial effect is less well understood [17]. Therefore, serum concentrations are most commonly used as a surrogate measure for determining the PK/PD indices, and T>MIC is the best parameter that correlates with the bactericidal activity of b-lactams. Studies in animal infection models have shown that for most b-lactams, concentrations do not need to exceed the MIC for 100% of the dosing interval to achieve a significant antibacterial effect [4]. Bacteriostatic effects of carbapenems against Escherichia coli and Pseudomonas aeruginosa in a murine thigh infection model are observed when serum drug concentrations are above the MIC for 20% of the dosing interval, whereas the T>MIC required for bactericidal activity is 40% of the dosing interval [18].
A previous PD study in critically ill patients with VAP found that a 90% PTA achieving 40% T>MIC was observed at a MIC of 1-2 μg/mL when imipenem was administered by a 40 min infusion of 1 g q8h, whereas a continuous infusion of a daily dosage of 2 g of imipenem had a 90% PTA for achieving a target of 40% T>MIC at a MIC of 2-4 μg/mL [8]. In the current study, the probability of a 4-h infusion regimen achieving a target of 40% fT>MIC were superior to a 1-h infusion regimen in an equivalent daily dosage of imipenem, therefore, a prolonged 4-h infusion regimen was a more effective strategy to achieve optimal PD exposure for pathogens with higher MIC than a 1-h infusion regimen. The 90% PTA achieving 40% fT>MIC for MICs of 2 μg/mL was observed in all simulated regimens of imipenem administration. For pathogens with a MIC of 4 μg/mL, the 90% PTA was achieved when imipenem was administrated by only a 4-h infusion of 1 g q8h or 1 g q6h. These data indicate that the standard manufacturer’s dosage recommendations for imipenem can provide good coverage for pathogens with a MICs of ≤2 μg/mL but in critically ill patients caused by less susceptible pathogens with a MIC of 4 μg/mL, the dosage regimen should be increased to at least a 4-h infusion of 1 g q8h regimen for achieving the optimal PD targets. During the imipenem administration in this study, no major adverse events related to this agent were observed.
This study had some limitations that must be considered. First, the results of this study could be difficult to extrapolate to other situations because the low body weight of the patients could have had an effect on Vd and CL. Second, the small number of patients could be considered a potential limitation. However, in the absence of data from a larger sample size, a MCS based on a small number of patients such as in this study can be instructive in illuminating the effects of different dosing approaches. Third, the Cockcroft–Gault method used for estimating CLCr is known to have certain limitations in severely ill patients.
In conclusion, the current population PK study found that the values of Vd and CL were greater than the values obtained from a previous study in healthy subjects. Our study indicates that a prolonged 4-h infusion of 1 g q8h of imipenem can be used for empirical coverage of pathogens with a MIC of £4 µg/ml who do not respond to lower doses according to standard dosing regimens.
Imipenem was donated by Merck & Co, Inc., Elkton, VA, USA, as pure powder. This work was supported by MSD, Thailand. We thank Mr David Patterson for checking our English.
- Craven DE, Chroneou A. Nosocomial pneumonia. In: Mandell GL, Bennett JE, Dolin R (2010) Principles and practice of infectious diseases. Boston: Churchill Livingstone. 3717-3724.
- Nicasio AM, Kuti JL, Nicolau DP (2008) The current state of multidrug-resistan Gram negative bacilli in North America. Pharmacotherapy 28(2): 235–249. [crossref]
- Rodloff AC1, Goldstein EJ, Torres A (2006) Two decades of imipenem therapy. J Antimicrob Chemother 58: 916-929. [crossref]
- Craig WA (1995) Interrelationship between pharmacokinetics and pharmacodynamics in determining dosage regimens for broad-spectrum cephalosporins. Diagnostic Microbiology and Infectious Disease, 22(1): 89–96.
- Pea F1, Viale P, Furlanut M (2005) Antimicrobial therapy in critically ill patients: a review of pathophysiological conditions responsible for altered disposition and pharmacokinetic variability. Clin Pharmacokinet 44: 1009-1034. [crossref]
- Garcia-Capdevila L1, López-Calull C, Arroyo C, Moral MA, Mangues MA, et al. (1997) Determination of imipenem in plasma by high-performance liquid chromatography for pharmacokinetic studies in patients. J Chromatogr B Biomed Sci Appl 692: 127-132. [crossref]
- Tegeder I, Bremer F, Oelkers R, Schobel H, Schüttler J, et al. (1997) Pharmacokinetics of imipenem-cilastatin in critically ill patients undergoing continuous venovenous hemofiltration. Antimicrobial Agents and Chemotherapy 41(12): 2640–2645. [crossref]
- Sakka SG, Glauner AK, Bulitta JB, Kinzig-Schippers M, Pfister W, et al. (2007) Population pharmacokinetics and pharmacodynamics of continuous versus short-term infusion of imipenem-cilastatin in critically ill patients in a randomized, controlled trial. Antimicrobial Agents and Chemotherapy 51(9): 3304-3310. [crossref]
- Mathews JH (1987) Numerical Methods for Computer Science, Engineering and Mathematics. London: Prentice-Hall International, Inc.
- Li J, Rhinehart RR (1998) Heuristic random optimization. Computers and Chemical Engineering 22(3): 427-444.
- Worakul N1, Wongpoowarak W, Boonme P (2002) Optimization in development of acetaminophen syrup formulation. Drug Dev Ind Pharm 28: 345-351. [crossref]
- Box GEP, Muller ME (1958) A Note on the Generation of Random Normal Deviates. Annals of Mathematical Statistics 29(2): 610–611.
- Udy AA, Varghese JM, Altukroni M, Briscoe S, McWhinney B, et al. (2012) Subtherapeutic initial ?-lactam concentrations in select critically ill patients: association between augmented renal clearance and low trough drug concentrations. Chest 142(1): 30-39. [crossref]
- Rubino CM, Bhavnani SM, Forrest A, Dukart G, Dartoris N, et al. (2012) Pharmacokinetic-pharmacodynamic of tigecycline in patients with community-acquired pneumonia. Antimicrobial Agents and Chemotherapy 56(1): 130-136.
- Jaruratanasirikul S, Raungsri N, Punyo J, Sriwiriyajan S (2005) Pharmacokinetics of imipenem in healthy volunteers following administration by 2 h or 0.5 h infusion. Antimicrobial Chemotherapy 56(6): 1163-1165.
- Kikuchi E, Kikuchi J, Nasuhara Y, Oizumi S, Ishizaka A, et al. (2009) Comparison of the pharmacodynamics of biapenem in bronchial epithelial lining fluid in healthy volunteers given half-hour and three-hour intravenous infusions. Antimicrobial Agents and Chemotherapy 53(7): 2799–2803.
- Mouton JW, Ambrose PG, Kahlmeter G, Wikler M, Craig WA. (2007) Applying pharmacodynamics for susceptibility breakpoint selection and susceptibility testing. In: Nightingale CH, Ambrose PG, Drusano GL, Murakawa T, ed. Antimicrobial pharmacodynamics in theory and clinical practice. New York, NY: Informa Healthcare.21–44.
- Drusano GL1 (2003) Prevention of resistance: a goal for dose selection for antimicrobial agents. Clin Infect Dis 36: S42-50. [crossref]