Abstract
Background
Early restoration of patency of infarct related artery is a universally accepted goal in the treatment of acute myocardial infarction. These could be achieved by Primary PCI or fibrinolysis. Primary PCI is preferred reperfusion strategy over fibrinolysis .Identifying initial area at risk in patients with acute myocardial infarction had been shown to have a direct impact on patient’s adverse clinical outcomes as well as prediction of systolic dysfunction. Area flow index (AFI) calculation in patients with acute myocardial infarction may predict initial area at risk during primary PCI.
Aim
To investigate the clinical utility of Area flow index to predict systolic dysfunction and adverse clinical outcomes in patients with acute anterior ST elevation myocardial infarction
Patients
250 consecutive patients with acute anterior ST elevation myocardial infarction treated with primary PCI presenting to Alexandria main university hospital & ICC hospital from June 2013till December 2014.
Methods
Echocardiographic assessment of LV systolic function 5-7 days after myocardial infarction by calculation of ejection fraction using modified Simpson method.
Area flow index was calculated by dividing culprit segment cross sectional area to total coronary cross sectional area.
Where DC is the culprit segment diameter, D1 left anterior descending diameter, D2 left circumflex diameter, D3 right coronary diameter
All patients were followed one month for the occurrence of MACE
Results
Patients were grouped according to their ejection fraction following myocardial infarction into 3 groups:
-Group I: severe LV systolic dysfunction EF <30%
-Group II: moderate LV systolic dysfunction EF 30-45%
-Group III: mild LV systolic dysfunction EF>45%
There was a significant negative correlation between AFI and LVEF(r=-0.58, P<0.001).The mean AFI for patients in group I was 33.1 ± 7.4, patients in group II was 26.6 ± 7.4, and those in group III was 20.0 ± 6.1. AFI > 28.4 % had a 75.6 % sensitivity and 78.1% specificity in predicting severe LV systolic dysfunction .Also the composite one month MACE was higher in the group with AFI > 28.4% (p<0.001).
Conclusion
Area flow index calculated from coronary angiography at time of primary PCI is a new strong independent predictor of LV systolic dysfunction and 1month MACE in patients with acute anterior myocardial infarction.
Introduction
ST-elevation myocardial infarction (STEMI) remains one of the leading causes of death globally [1]. Thrombolysis was a major step forward in the treatment of STEMI [2,3] and further progress was done when primary percutaneous coronary intervention (PCI) was established as a golden therapeutic standard [4].
Primary PCI is defined as percutaneous coronary intervention in the setting of STEMI, without previous fibrinolysis. It has replaced fibrinolysis as the preferred reperfusion strategy in patients with STEMI, provided it can be performed in a timely manner in high volume PCI centers with experienced operators and 24-hour, 7-day catheterization laboratory activation [5].
Compared with fibrinolysis therapy, primary PCI produces higher rates of infarct artery patency, TIMI 3 flow, and access site bleeding and lower rates of recurrent ischemia, reinfarction, emergency repeat revascularization procedures, intracranial hemorrhage, and death. Early, successful PCI also greatly decreases the complications of STEMI that result from longer ischemic times or unsuccessful fibrinolytic therapy, allowing earlier hospital discharge and resumption of daily activities. Primary PCI has its greatest survival benefit in high-risk patients. PCI outcomes have been shown to be worse with delays to treatment and with low-volume hospitals and operators [6].
Primary percutaneous coronary intervention (PCI) has become the predominant reperfusion strategy for ST-segment elevation myocardial infarction (STEMI) throughout western healthcare systems. Recent estimates in the United States suggest that primary PCI is used in 85% of all STEMI cases that undergo reperfusion, with thrombolytic agents used in only 9% and the combination of thrombolytic agents with PCI in 6% [7]. In Europe, fibrinolysis for STEMI is becoming a rare therapy; for example 6% of cases in the UK, 7% in Poland, and 8% in France. It is interesting to note that, even in countries with a large catchment area, such as Denmark with one primary PCI canter per 1.4million inhabitants and correspondingly long transportation distances, the STEMI case fatality rate is among the lowest recorded in Europe, with an in-hospital mortality of only 3% [8].
The 30-day mortality rate of patients with STEMI is between 2.5 and 10 percent [9]. Among patients with STEMI enrolled in trials, approximate in-hospital or 30-day mortality rates were 13 percent with medical therapy alone, 6 to 7 percent with optimal fibrinolytic therapy, and as low as 3 to 5 percent with primary percutaneous coronary intervention (PCI) when performed within two hours of chest pain onset [10-12].
Some of the independent predictors of early death from STEMI include age, Killip class, time to reperfusion, cardiac arrest, tachycardia, hypotension, anterior infarct location, prior infarction, diabetes mellitus, smoking status, renal function, number of diseased vessels and biomarker findings. Whereas the Thrombolysis in Myocardial Infarction (TIMI) risk score was developed specifically in patients with STEMI, the GRACE model predicts in-hospital and 6-month mortality rate across the spectrum of patients presenting with ACS, including those with ST elevation or ST depression. Risk assessment is a continuous process that should be repeated throughout hospitalization and at time of discharge [13].
Identifying initial area at risk in patients with acute myocardial infarction had been shown to have a direct impact on patient’s adverse clinical outcomes as well as prediction of systolic dysfunction. Area flow index (AFI) calculation in patients with acute myocardial infarction may predict initial area at risk during primary PCI [14].
Patients and methods
250 consecutive patients with acute anterior ST elevation myocardial infarction treated with primary PCI presenting to Alexandria main university hospital & ICC hospital from June 2013till December 2014.
Echocardiographic assessment of LV systolic function 5-7 days after myocardial infarction by calculation of ejection fraction using modified Simpson method.
Area flow index was calculated by dividing culprit segment cross sectional area to total coronary cross sectional area.
Where DC is the culprit segment diameter, D1 left anterior descending diameter, D2 left circumflex diameter, D3 right coronary diameter (Figure 1).
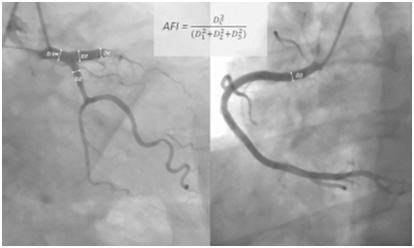
Figure 1. AFI index calculation
All patients were followed one month for the occurrence of MACE.
Patients were grouped according to their ejection fraction following myocardial infarction into 3 groups:
-Group I: severe LV systolic dysfunction EF <30%
-Group II: moderate LV systolic dysfunction EF 30-45%
-Group III: mild LV systolic dysfunction EF>45%
Results
There were no significant differences between three groups regarding the demographic data, risk factors or medications used (Table 1 and 2). The mean age in group I was 66 ± 14, in group II 61 ± 14, and in group III 60 ± 15. The incidence of Hypertension in group I was 46.2%, in group II 44.7%, and in group III 37.9%. Regarding the incidence of diabetes, in group I 18.6%, group II 16.5%, and in group III 15.9%.
|
|
“Group I”
Severe LV dysfunction (EF <30%)
“n=2”
|
“Group 2”
Moderate LV dysfunction (EF =30-44%)
“n=132"
|
“Group 3”
Mild LV “EF > 45%)
“n=66”
|
p
|
|
Age (years)
|
66.0±14.0
|
61.0±14.0
|
60.0±15.0
|
0.103 N.S
|
|
Sex, F/M
|
15/37
|
26/106
|
18/48
|
0.236 NS
|
|
Hypertension, n (%)
|
24 (46.2)
|
59 (44.7)
|
25 (37.9)
|
0.352 NS
|
|
Dyslipdemia, n (%)
|
15 (28.8)
|
49 (37.1)
|
20 (30.3)
|
0.411 NS
|
|
Diabetes mellitus, n (%)
|
6 (18.6)
|
15 (16.5)
|
7 (15.9)
|
NS
|
Table 1. relation between three groups and demographic data and risk factors
|
Drug use
|
“Group I”
Severe LV dysfunction (EF <30%)
“n=2”
|
“Group 2”
Moderate LV dysfunction (EF =30-44%)
“n=132"
|
“Group 3”
Mild LV “EF > 45%)
“n=66”
|
p
|
|
b-blocker, %
|
78.5
|
96.7
|
95.4
|
0.32
|
|
ACE inhibitor, %
|
90.6
|
95.6
|
93.2
|
0.425
|
|
Statin, %
|
96.9
|
100
|
97.7
|
0.365
|
|
Glycoprotein IIb/IIIa Inhibitors, %
|
9.4
|
8.8
|
11.4
|
0.25
|
Table 2. Relation between three groups and drugs used
Also regarding the door to balloon time and the final TIMI flow ,there no significant difference between the three groups, the mean door to balloon were 48 ± 10 min in group I, 51 ± 9 min in group II, and 47±11 min in group III (Table 3). There was a significant negative correlation between AFI and LVEF(r=-0.58, P<0.001).The mean AFI for patients in group I was 33.1 ± 7.4, patients in group II was 26.6 ± 7.4, and those in group III was 20.0 ± 6.1. AFI > 28.4 % had a 75.6 % sensitivity and 78.1% specificity in predicting severe LV systolic dysfunction .Also the composite one month MACE was higher in the group with AFI > 28.4% (p<0.001) (Table 4). There were statistically significant correlations between LV EF and MACE after one month. The incidence of MACE were 43.5% in group I, 15.4% in group II and2.3% in group III (P=0.013).Also the incidence of new congestive heart failure were significantly higher in patients of group I 21.9%, then in group II 4.4%, then in group III 0% (P=0.002) (Table 5).
|
|
“Group I”
Severe LV dysfunction (EF <30%)
“n=2”
|
“Group 2”
Moderate LV dysfunction (EF =30-44%)
“n=132"
|
“Group 3”
Mild LV “EF > 45%)
“n=66”
|
p
|
|
Final TIMI flow 2-3,%
|
90.6
|
93.4
|
93.2
|
0.236
|
|
Door-to-balloon time, min
|
48±10
|
51±9
|
47±11
|
0.254
|
|
Symptom-to-balloon time, hr
|
4 (3-6)
|
3.5 (3-6)
|
3 (2-4)
|
0.32
|
Table 3. Relation between three groups and primary PCI data.
|
|
“Group I”
Severe LV dysfunction (EF <30%)
“n=2”
|
“Group 2”
Moderate LV dysfunction (EF =30-44%)
“n=132"
|
“Group 3”
Mild LV “EF > 45%)
“n=66”
|
p
|
|
AFI (%)
|
33.1±7.4
|
26.6±7.4
|
20.0±6.1
|
0.021*
|
Table 4. Relation between LVEF and AFI
|
MACE
|
“Group I”
Severe LV dysfunction (EF <30%)
“n=2”
|
“Group 2”
Moderate LV dysfunction (EF =30-44%)
“n=132"
|
“Group 3”
Mild LV “EF > 45%)
“n=66”
|
p
|
|
Death, n (%)
|
4 (12.5)
|
7 (7.7)
|
1 (2.3)
|
0.365
|
|
Stroke, n (%)
|
0 (0)
|
1 (1.1)
|
0 (0)
|
-
|
|
Non fatal MI, n (%)
|
3 (9.3)
|
2 (2.2)
|
0 (0)
|
0.175
|
|
New CHF, n (%)
|
7 (21.9)
|
4 (4.4)
|
0 (0)
|
0.002*
|
|
Composite MACE, n (%)
| 2021 Copyright OAT. All rights reserv
14 (43.5)
|
14 (15.4)
|
1 (2.3)
|
0.013*
|
Table 5. relation between LVEF and one month MACE.
Discussion
Worldwide, coronary artery disease (CAD) is the single most frequent cause of death. In-hospital (approximately 5% to 6%) and 1 year (approximately 7% to 18%) mortality rates from STEMI also have decreased significantly in association with greater use of reperfusion therapy, Primary Percutaneous Coronary Intervention (Primary PCI), modern antithrombotic therapy and secondary prevention treatments [15].
The mortality of STEMI is influenced by many factors, among them: age, Killip class, time delay to treatment, mode of treatment, history of prior myocardial infarction, diabetes mellitus, renal failure, number of diseased coronary arteries, ejection fraction, and treatment.
Approximately 30% of patients with STEMI are women. Female sex was a strong independent predictor of failure to receive reperfusion therapy among patients who had no contraindications [16]. Compared with men, women presented later after symptom onset, had longer door-to-fibrinolysis and door-to-balloon (or device) (D2B) times and less often received aspirin or beta blockers within 24 hours of presentation. Approximately 23% of patients with STEMI in the United States have diabetes mellitus, and three quarters of all deaths among patients with diabetes mellitus are related to coronary artery disease. Diabetes mellitus is associated with higher short- and long-term mortality after STEMI [17]
In our study we aimed to correlate the clinical utility of a simple index calculated at time of coronary angiography during primary PCI (Area flow index) with left ventricular systolic dysfunction and MACE
The results of our study were similar to the study conducted by Agac et al. [14]. In our study we had a significant negative correlation between AFI and LVEF(r=-0.58, P<0.001). Also in the study of Agac et al. [14] they had a significant negative correlation between AFI and LVEF (p<0.001)
In our study we had statistically significant correlations between LV EF and MACE after one month (p=0.013) which was similar to the results of Agac et al. [14].
Conclusion
Area flow index calculated from coronary angiography at time of primary PCI is a new strong independent predictor of LV systolic dysfunction and 1month MACE in patients with acute anterior myocardial infarction.
References
- Strong K, Mathers C, Leeder S, Beaglehole R (2005) Preventing chronic diseases: how many lives can we save? The Lancet 366: 1578-1582.
- Paolo MA, Luisa ZA, Piero ZA (1989) Effect of streptokinase on left ventricular modeling and function after myocardial infarction: The GISSI (Gruppo Italiano per lo Studio della Streptochinasi nell'Infarto Miocardico) trial. J Am Coll Cardiol 14:1149-1158.
- ISIS I, collaboration group (1988) Randomised trial of intravenous streptokinase, oral aspirin, both, or neither, among 17187 cases of suspected acute myocardial infarction: ISIS II. Lancet 2: 349-360.
- Keeley EC, Boura JA, Grines CL (2003) Primary angioplasty versus intravenous thrombolytic therapy for acute myocardial infarction: a quantitative review of 23 randomised trials. The Lancet 361: 13-20.
- Brodie BR (2002) Comparison of reperfusion strategies for ST elevation myocardial infarction: primary coronary intervention versus fibrinolysis. In: Tcheng JE (ed).Primary angioplasty in acute myocardial infarction. USA: Human Press: 9-26.
- Gibson CM (2004) NRMI and current treatment patterns for ST-elevation myocardial infarction. Am Heart J 148: S29-33. [Crossref]
- Jollis JG, Al-Khalidi HR, Monk L, Roettig ML, Garvey JL, et al. (2012) Expansion of a Regional ST-Segment–Elevation Myocardial Infarction System to an Entire State. Circulation 126: 189-195.
- Armstrong PW, Gershlick AH, Goldstein P, Wilcox R, Danays T, et al. (2013) Fibrinolysis or primary PCI in ST-segment elevation myocardial infarction. N Engl J Med 368: 1379-1387. [Crossref]
- Sadaka M, Loutfi M, Zaki A, Sobhy M (2013) A guideline based approach of percutaneous coronary intervention in acute myocardial infarction: Single center experience. The Egyptian Heart Journal 65: 163-173.
- Tobbia P, Brodie BR, Witzenbichler B, Metzger C, Guagliumi G (2013) Adverse event rates following primary PCI for STEMI at US and non-US hospitals: three-year analysis from the HORIZONS-AMI trial. Euro Intervention 8: 1134-1142.
- Grines CL, Browne KF, Marco J, Rothbaum D, Stone GWV (1993) A comparison of immediate angioplasty with thrombolytic therapy for acute myocardial infarction. N Engl J Med 328: 673-679. [Crossref]
- Nielsen PH, Maeng M, Busk M, Mortensen LS, Kristensen SD, et al. (2010) Primary Angioplasty Versus Fibrinolysis in Acute Myocardial Infarction Long-Term Follow-Up in the Danish Acute Myocardial Infarction 2 Trial. Circulation 121: 1484-1491.
- Bawamia B, Mehran R, Qiu W, Kunadian V (2013) Risk scores in acute coronary syndrome and percutaneous coronary intervention: a review. Am Heart J 165: 441-450. [Crossref]
- Agac M, Agac S, Korkmaz L, Celik S, Erkan H (2013) Clinical utility of a novel index to predict systolic dysfunction and adverse clinical outcome in patients with acute ST-elevation myocardial infarction: a pilot study. European Heart Journal 34: 2228.
- Dzau VJ, Antman EM, Black HR, Hayes DL, Manson JE, et al. (2006) The cardiovascular disease continuum validated: clinical evidence of improved patient outcomes part i: pathophysiology and clinical trial evidence (risk factors through stable coronary artery disease). Circulation 114: 2850-2870. [Crossref]
- Li YR (2015) Cardiovascular Diseases: From Molecular Pharmacology to Evidence-Based Therapeutics. John Wiley & Sons.
- O Gara PT, Kushner FG, Ascheim DD, Casey DE Jr, Chung MK, et al. (2013) 2013 ACCF/AHA guideline for the management of ST-elevation myocardial infarction: a report of the American College of Cardiology Foundation/American Heart Association Task Force on Practice Guidelines. 127: e362-425. [Crossref]