Objectives: Our study aims to assess the effect of implementing direct verbal communication between the triage nurse and Emergency Department (ED) physician and providing Rapid Assessment and Treatment of Canadian Triage and Acuity Scale (CTAS) category 2 (RAT2) patients presenting to a tertiary care ED.
Methods: This is a retrospective, pre and post RAT2 intervention study of periods in our ED using the Enterprise Reporting System and records from ED quality section. The data collected consisted of patient demographics, length of stay, waiting time (Door to Doctor Time), door to triage time, and triage to doctor time (physician initial assessment time) for CTAS category 2 patients, and any sentinel events reported during the study periods.
Results: The total number of patients included in this study was 97,472 from which 10,024 were CTAS category 2 and 4,825 were post-RAT2 intervention. Using the T-Test, our results showed pre-RAT mean door-to-doctor time of 61.8 minutes (median: 61.5) and post-RAT time of 31.6 minutes (median: 32). This reduction was statistically significant (p<0.001). There was no significant difference in patient demographics, length of stay, door to triage time, or the door-to-doctor time for other category patients. There were no sentinel events reported during the RAT2 intervention period.
Conclusion: Direct verbal nurse-physician communication with early physician assessment and treatment of category 2 patients reduces patient door-to-doctor time without delaying care of other patients or causing any sentinel events.
triage category, emergency department, Canadian Triage and Acuity Scale, Rapid Assessment and Treatment
Abbreviations
CTAS: Canadian Triage and Acuity Scale; ED: Emergency Department; CDC: Center for Disease Control and Prevention; RAT: Rapid Assessment and Treatment; LOS: length of stay; RAC: Research Advisory Council; EMR: Electronic Medical Records.
The Emergency Department (ED) is an organized chaos; every year more than 136 million patients visit the ED in the United States (US). Surprisingly though, only about one fourth of these patients are actually seen within the first 15 minutes [1]. Which is mainly due to the overcrowding of the emergency departments [2]. The ED in King Faisal Specialist Hospital and Research Center (KFSH&RC) in Riyadh, Saudi Arabia uses the Canadian Triage and Acuity Scale (CTAS) to identify sick patients so that they can be seen and treated quickly by the ED physician. However, due to excessive boarding of admitted patients, ED patients experience long waiting times. Several recent studies have suggested that early intervention may reverse potential end organ damage and adverse outcomes [3]. According to CTAS guidelines, a category 2 patient is one who needs to be seen by a physician within 15 minutes 95% of the time [4]. Patients presenting to the ED with severe trauma, myocardial infarction, stroke, altered mental state or even a neonate are all examples of category 2 patients. In comparison, a category 1 patient is one who requires resuscitation and immediate aggressive intervention. These are patients presenting in an unconscious state or in cardio-respiratory arrest. The current CTAS guidelines with the recommended nurse and physician evaluation times are shown as per Table 1. We chose category 2 patients as our intervention group because it is the subset of patients with the highest risk since category 1 patients are seen immediately in our ED and not many studies have looked at a cost effective intervention to decrease emergent patient waiting time and early delivery of care.
According to the Center for Disease Control and Prevention (CDC) data, about 2.1 million patients in the US who visit the ED are admitted to the critical care unit of the hospital. Signifying a large number of patients that are in need of urgent intervention [5]. According to the National Health Services (NHS) in the United Kingdom (UK) Rapid Assessment and Treatment (RAT) is defined as the “early assessment of ‘majors’ patients in Emergency Department, by a team led by a senior doctor, with the initiation of investigations and/or treatment” [6]. However, numerous RAT models implemented in the US and the UK have shown variable results [7]. We believe that by implementing a policy of direct communication between ED physician and nursing staff, the ED team can provide RAT and prevent any adverse events related to delay in patient care.
A study of RAT in a busy district general hospital in the UK has shown improvement in ED waiting times from pre-RAT to post-RAT audit by adding a physician in the triage area [8]. The RAT models implemented in the UK have shown lots of pros and cons. The advantages of this approach include reduced triage waiting time, earlier patient intervention, triage nurses are re-tasked to provide other value added care, reduced boarding time, reduction in unnecessary investigations and tests due to input from ED consultants, as well as improvement in both patient experience and outcomes. Even though there are numerous advantages there are always a few disadvantages, these include it being a mentally demanding service in addition to requiring urgent senior medical input, which would make it difficult to run for 24 hours every day. Furthermore, rapid assessment may be prone to more medical errors [6].
Our study aims to assess the effect of improved communication between the ED physician and nurse in shortening the time for category 2 patients from when they enter the ED to when they are first seen by the ED physician (door-to-doctor time) without additional staff. To our knowledge, such data has not been published. The authors do not have any conflict of interest or funding for this study. (Table 1)
Table 1. CTAS Guidelines for Nursing and Physician Assessment
CTAS Category |
% of patient seen |
Nurse Assessment |
Physician(MD) Assessment |
Resuscitation (I) |
98% |
Immediate |
Immediate |
Emergent (II) |
95% |
Immediate |
15 mins |
Urgent (III) |
90% |
30 mins |
30 mins |
Less Urgent (IV) |
85% |
60 mins |
60 mins |
Non-urgent (V) |
80% |
120 mins |
120 mins |
This is a retrospective, controlled before-and-after study of data collected during the two study periods (pre- RAT and post-RAT intervention) in a tertiary care hospital in the city of Riyadh, Saudi Arabia. The two study periods were a total of 20 months, from January-October 2014 with the two months of November and December 2014 being consolidating months and then again from January-October 2015. Average annual patient attendance at our ED is 60,000. The ED serves patients 24/7 and staffing is shift based with either three 8-hour shifts or two 12-hour shifts by physician and nurses, respectively. Staffing at our ED was not changed in both the pre-RAT or post-RAT periods for the purpose of this study. All patient details were kept confidential, and there was no need for additional intervention, or consent of patients for our study.
The data was collected by the investigators through electronic record of databases at KFSH&RC. The inclusion criteria of this study consisted of all triage category 2 patient presenting to the KFSH&RC ED.
The parameters taken from the database in order to answer our question were patient demographics, registration time, triage time, physician exam time, using this data we calculated the door to triage time, the triage to doctor time, as well as door to doctor time (waiting time). In addition, the length of stay (LOS) for discharged patients (from patient registration to patient physically leaving the ED), and the incidence of any sentinel events related to patient morbidity and mortality due to delay in care during the study period.
Statistical Considerations: For this cross-sectional study, all the statistical analysis of data was done by using the software package SAS version 9.3 (Statistical Analysis System, SAS Institute Inc., Cary, NC, USA) or SPSS version 20 (SPSS, IBM Statistics, USA). Descriptive statistics for the continuous variables were reported as mean ± standard deviation and categorical variables were summarized as frequencies and percentages. Continuous variables were compared by Student’s t-test or ANOVA as appropriate; while categorical variables were compared by Chi-square test. The level of statistical significance is set at p < 0.05.
Ethical Considerations: This study was conducted after obtaining KFSH&RC Research Advisory Council (RAC) approval # 2151110. It was also in accordance with the ethical principles contained in the Declaration of Helsinki (2000), the policies, guidelines and the laws of the Kingdom of Saudi Arabia. There was no discrimination against any patient based on age, sex, and nationality.
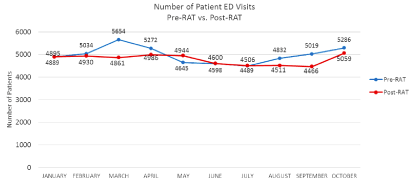
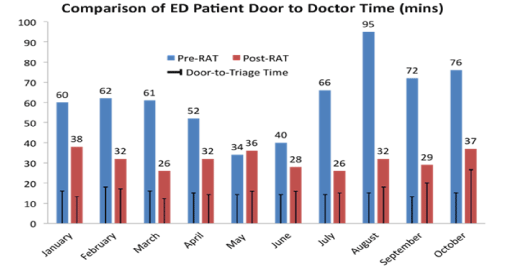
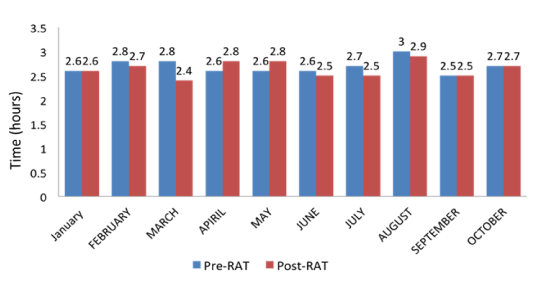
Total number of patients included in both study periods was 97,472. Number of category 2 patients during this time period was 10,024 with 5,199 pre-RAT (January to October 2014) (Figure 1) or control and 4,825 post-RAT (January to October 2015). The mean door to triage time for pre-RAT was 15.0 minutes (median=15.0) and mean post-RAT time of 16.0 minutes (median=16.8) (p=0.23) (Figure 2). The value of this finding was not significant; as this part of the protocol was not where we had implemented our intervention, rather we made the changes after triage. The mean CTAS (CAT 2) triage to doctor time (physician initial assessment time) for pre-RAT was 46.8 minutes (median=44.5) and mean post-RAT time of 14.8 minutes (median=14.0) (p<0.0002) (Figure 2, Table 2). The mean door to doctor time (waiting time) for our control was 61.8 minutes (median=61.5), with implementation of RAT our mean post-RAT waiting time was reduced to 31.6 minutes (median=32) (p<0.0001). The pre and post RAT door to doctor times for both adult and pediatric patient Categories 3, 4, and 5 did not change significantly (Table 3). The length of stay for all 97,472 patients ranging from all 5 categories was also analyzed in both the control and post-RAT period. In pre-RAT period, there were 49,714 patients with a median length of stay of 2.7 hours and 79% of patients discharged within 6 hours of arrival. In post-RAT period, there were 47,758 patients with a median length of stay of 2.6 hours and 81% of patients discharged within 6 hours of arrival (Figure 3). There were three sentinel events related to delay in care of category 2 patients reported in pre-RAT period while there were none in post-RAT period.

Figure 1. Number of Patient ED Visits (Pre-RAT vs. Post RAT)

Figure 2. Comparison of ED Patient Door to Doctor Time (mins)

Figure 3. Comparison of ED length of stay (LOS) of discharged patients Jan – Oct 2014 vs. Jan – Oct 2015.
Table 2. Triage to doctor time (minutes).
|
Pre-RAT(min) |
Post-RAT (min) |
January |
44 |
25 |
February |
44 |
15 |
March |
45 |
14 |
April |
37 |
18 |
May |
20 |
20 |
June |
26 |
12 |
July |
52 |
11 |
August |
80 |
14 |
September |
59 |
9 |
October |
61 |
10 |
Table 3. Pre and Post RAT Door to Doctor Times
Period |
Age Group |
CTAS CATEGORY |
CAT 3 (p< .47) |
CAT 4 (p< .07) |
CAT 5 (p< .66) |
|
|
Median |
Mean |
Median |
Mean |
Median |
Mean |
Pre RAT |
Adult |
82 |
139 |
55 |
80 |
40 |
63 |
(n=3824) |
(n=6345) |
(n=399) |
Pediatric |
43 |
59 |
42 |
78 |
29 |
59 |
(n=703) |
(n=1420) |
(n=72) |
Post RAT |
Adult |
86 |
137 |
54 |
78 |
41 |
59 |
(n=3682) |
(n=6622) |
(n=410) |
Pediatric |
42 |
59 |
39 |
53 |
38
|
54 |
(n=840) |
(n=1963) |
(n=77) |
n=number of patients seen, p values are obtained by pooled data
We were able to show that direct verbal communication between ED staff decreased the waiting time and physician initial assessment time of category 2 patient. Early identification and management of emergent patients decreased adverse patient outcomes. An ideal ED would be one that eliminates patient waiting time. However, with finite resource availability, growing patient care demands with extensive pre-admission workup due to lack of in-patient beds has put extra burden on the EDs with resultant overcrowding and its sequelae [9]. Preferably a patient would walk in with a complaint and directly be given a bed or a room and be seen by both a nurse and a physician. However, with current available resources these ideal situations are difficult to attain. At any given time in KFSH&RC, patients who are waiting for an in-patient bed availability occupy 90% of ED beds. This boarding of admitted patients in the ED alone is the main cause of ED overcrowding. This results in delay of assessment in patients requiring emergent care. An ED with such a high level of overcrowding requires a system that is well organized, and efficient in improving patient and healthcare system flow. By implementing a system that helps reduce the patient waiting time will allow the entire ED to function more efficiently, which will consequently improve the patient outcome and survival. In order to achieve this at our hospital’s ED, we implemented RAT protocol for our emergent patients.
Several ED studies have looked at adding a consultant or senior ED physician in the triage area to quicken the flow of patients. Even though the results turned out favourable, the system was discontinued within 3 months due to staff shortage [10].
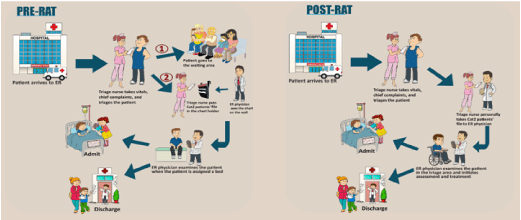
In KFSH&RC during pre-RAT as soon as a patient arrived at the ED, they were triaged and assigned a CTAS category by a nurse. Category 1 patients were sent to the resuscitation area. Category 4 and 5 patients were transferred to fast track. Due to excessive boarding and resultant occupied ED beds, Category 2 and 3 patients were sent to the waiting room. Their triage medical records were placed on the rack (Figure 4: pre-RAT) providing physicians a visual clue of emergent and urgent patients waiting to be seen. These patients were only seen and management initiated once an ED bed became available. This waiting process on average took over an hour. Introduction of Rapid Assessment and Treatment of Category 2 patients (RAT2) required that the triage nurse physically take the triage medical records directly to the ED physician who would then go and assess the patients in the triage area before sending them back to the waiting room or placing them in a hallway bed (Figure 4: post-RAT). This provided an opportunity to initiate appropriate workup, administer early management including antibiotics, intravenous fluids or pain medications as needed. This intervention improved patient waiting time to around 30 minutes and also improve the waiting of the CTAS Category 3 patients as the ED physician saw these patients early. Although, our triage nurses did not object going the extra mile for our sick patients, this new process added 15-20 extra steps per Category 2 patient. In future, utilization of mobile communication maybe compared to personal face-to-face interaction in reducing the emergent patient waiting time.

Figure 4. Pre-RAT and Post-RAT flowchart.
2021 Copyright OAT. All rights reserv
Since the intervention was initiated after the triage, the mean door-to-triage time did not change between the study periods. However, the triage-to-doctor time was significantly reduced from a mean of 46.8 minutes (median= 44.5 min) in pre-RAT to a mean of 14.8 minutes (median= 14 min) in post-RAT study period (p<0.001).
In our ED, routinely patients are seen prior to their bed assignment. Especially in post-RAT; this occurred because the door-to-bed placement time is longer than door-to-doctor time for category 2 patients. Our waiting room is used as a results waiting area for patients. Nursing staff regularly checks on these patients while they wait for their test results. This allows early identification of deteriorating patients.
To reduce overcrowding the ED patient length of stay (LOS) must be minimized [9]. In our study, there was a 2% increase in the number of patients discharged home without any significant change in patient admission rate, boarding practices or length of stay. This change was not statistically significant.
After patients are triaged, the electronic medical records (EMR) generate an icon that alerts the ED physician regarding the acuity of the patient [11]. Our study proves that in our ED, a direct verbal communication between the triage nurse and ED physician is superior to EMR alerts in reducing the patient wait times.
Limiting factors for this study were that it was conducted at a single urban tertiary care hospital so the results cannot be generalized [12]. Additionally, like in any before-and-after study even though there was an association with the study outcomes, this type of study does not confirm causality.
Direct verbal ED nurse-physician communication effectively reduced patient waiting and physician initial assessment time. We believe this is a simple and inexpensive modification and is superior to the EMR alerts especially in an overcrowded ED. This improvement was achieved without additional staff, delay of care and mitigated the risk of sentinel events.
- Center for Disease Control and Prevention (2015) Retrieved from Feb 7, 2015.
- White BA, Brown DF, Sinclair J, Chang Y, Carignan S, et al. (2012) Supplemented Triage and Rapid Treatment (START) improves performance measures in the emergency department. J Emerg Med 42: 322-328. [Crossref]
- Djokovic M (2012) Increased Emergency Department Boarding Times. ScholarWorks@UMass Amherst. Doctor of Nursing Practice Capstone Projects.
- Canadian Triage and Acuity Scale (CTAS) (2015) National Guidelines retrieved from Feb 7, 2015.
- Centre for Disease Control and Prevention (2015) Retrieved from Feb 7, 2015.
- National Health Services (2011) retrieved from Jan 7, 2015.
- Bullard MJ, Villa-Roel C, Guo X, Holroyd BR, Innes G, et al. (2012) The role of a rapid assessment zone/pod on reducing overcrowding in emergency departments: a systematic review. Emerg Med J 29: 372-378. [Crossref]
- Joy T, Niklaus L (2012) Rapid Assessment and Treatment (RAT) in the Emergency Department. Poster
- Haybarker B (2015) Reducing Emergency Department Length of Stay by System Change. Walden Dissertations and Doctoral Studies.
- Grant S, Spain D, Green D (1999) Rapid assessment team reduces waiting time. Emergency Medicine 11: 72-77.
- Redmond AD, Buxton N (1993) Consultant triage of minor cases in an accident and emergency department. Arch Emerg Med 10: 328-330. [Crossref]
- Partovi SN, Nelson BK, Bryan ED, Walsh MJ (2001) Faculty triage shortens emergency department length of stay. Acad Emerg Med 8: 990-995. [Crossref]


