Abstract
Hyperglycaemic hyperosmolar state (HHS) and diabetic ketoacidosis (DKA) are often accompanied by severe metabolic and electrolyte disorders. Analysis and treatment of these disorders can be challenging for clinicians. In this paper, we aimed to discuss the most important steps and pitfalls in analyzing and treating a case with extreme metabolic disarrangements as a consequence of an HHS. Electrolyte disturbances due to fluid shifts and water deficits may result in potentially dangerous hypernatriema and hyperosmolality. In addition, acid-base disorders often co-occur and several approaches have been advocated to assess the acid-base disorder by integration ofthe principles of mass balance and electroneutrality. Based on the case vignettefour explanatory methods are discussed: the traditional bicarbonate-centered method ofHenderson-Hasselbalch, the strong ion model of Stewart, and its modifications ‘Stewart at the bedside’ by Magder and the simplified Fencl-Stewart approach. The four methods were compared and tested for their bedside usefulness. All approaches gave good insight in the metabolic disarrangements of the presented case. However, we foundthe traditional method of Henderson-Hasselbalch and ‘Stewart at the bedside’ by Magder most explanatory and practical in use to guide treatment of the electrolyte disturbances and in exploring theacid-base disorder of the presented case.
Key words
acid-base disorders, corrected sodium, hyperglycaemic hyperosmolar state, metabolic acidosis, Stewart, strong ion difference
Introduction
Severe acid-base disorders combined with electrolyte disturbances are often seen in patients with hyperosmolar hyperglycaemic state (HHS)or diabetic ketoacidosis (DKA). Acid-base disorders and electrolyte disturbances are tightly connected[1]. The aims of this clinical lesson are (i) to give insight in the relation between hyperglycemia, acid-base disturbances and electrolyte homeostasis, (ii)to provide a strategy for the treatment of HHS and DKA during the first hours, and (iii) to compare different methods in analyzing acid-base disorders.
Case
A 38-year-old patient was admitted to the ICU because of a hyperosmolar Hyperglycaemic state with an extreme metabolic (and combined respiratory) acidosis and hypernatriemia (Table 1).Glucose levels were gradually lowered with iv insulin and extensive rehydration. Initially,themetabolic acidosis improved.
Laboratory results |
At presentation |
After 2
hours |
After 16 hours |
Sodium (mmol/l) |
146 |
|
168 |
Potassium (mmol/l) |
4,3 |
2,9 |
5 |
Chloride (mmol/l) |
90 |
113 |
135 |
pH |
6,86 |
6,99 |
7,37 |
pCO2 (kPa) |
9,1 |
8,2 |
4,1 |
Bicarbonate (mmol/l) |
12 |
14,4 |
17,9 |
Base excess (mmol/l) |
-22,1 |
-17,3 |
-6,5 |
Lactate (mmol/l) |
7,6 |
5 |
7,8 |
Osmol (mOsmol/kg) |
480* |
453 |
398 |
Albumin (g/l) |
28* |
28 |
19 |
Glucose (mmol/l) |
120* |
92 |
29,5 |
ionized Calcium (mmol/l) |
1,54 |
1,42 |
1,18 |
Magnesium (mmol/l) |
1,11* |
1,11 |
0,9 |
Phosphate (mmol/l) |
0,35* |
0,4 |
0,9 |
Urea (mmol/l) |
35* |
32,6 |
28 |
Table 1. Laboratory results of presented case at indicated timepoints.
*data are abstracted from first available drawings.
Balance between hyperglycemia, acid-base disordersand electrolyte disturbances
The hyperglycemia of this patient caused severe acid-base and electrolyte disturbances of which the main elements are (i) the effects of ketoacids on other ions and (ii) the effects of the hyperglycemia on extracellular volume and sodium concentrations.By definition electrolytes dissociate in water in anions (negatively charged, predominately chloride) or in cations (positively charged, predominately sodium). However, inpathologic conditions these electrolytes can be extensively lost or gained resulting in a temporary ionic imbalance.To maintain electrochemical neutrality, changes in acid-base equilibrium occur.The compensatory mechanism to restore electrochemical neutrality includes the dissociation of water in hydrogen (H+)and vice versa[1].This is accompanied by changes in pCO2 and bicarbonate (HCO₃⁻) levels, depending on the cause of the acid-base disorder.
An absolute shortage of insulin in diabetic ketoacidosis (DKA)results in the accumulation of negatively charged ketoacids from acetyl-Coa serving as a fuel for the brain. These ketoacids anions becomeapparent in blood when their hepatic production exceeds the renal excretion capacity.To compensate forthe accompanyingprotons from the ketoacids, water and carbon dioxideare formed from bicarbonate to enable respiratory compensation[2].This equation is the cornerstone of the traditional approach according to Henderson-Hasselbalch for the assessment of acid base disturbances (Textbox). More detailed description and analysis of the acid base disturbance of the presented case will follow below.
Another important element in this pathologic cascade includes sodium and water regulation. Increased glucose levels augment the plasma tonicity because glucose is an effective osmole and both the hyperglycemia and the ketoacid salts cause a decrease in the extracellular volume, factors that contribute to enormous deficits in total body water and changes in plasma sodium concentrations[2].Hyponatriemia may become apparent since sodium, also an effective osmole,remains in the extracellular (the blood) compartment during the glucose-driven watershift. Be aware that normal or increased plasma sodium levels during severe hyperglycemia indicate a substantial loss of total body water!As a rule of thumb in clinical medicine, the serum sodium concentration decreases by 3 mmol/L for every 10 mmol/L increase in glucose concentration. Although this correction factor is based on theoretical considerations and has not been well validated, it gives good insight into the severity of water loss[2].In practice, however, it may vary between 1 - 4 mmol/L.
The application of this correction factor to our case revealed an extremely dangerous sodium concentration of 182 mmol/L. This is in agreement with an osmolality of 447 mosm/kg and an estimated water shortage of 13 liters of body water.
First-hours treatment plan
Patients in these severe metabolic deranged states need immediate treatment and do not allow much time for assessments. Many guidelines regarding the treatment of HHS and DKA exist and it is beyond the scope of this article to discuss them in detail. However, the extreme hypernatriemia illustrates the importance of careful fluid administration, specifically concerning the prevention of cerebral edema for reasons delineated below.
The initial goal of fluid therapy in a Hyperglycaemic crisis is to stabilize hemodynamics with isotonic solutions. During resuscitation it is important to monitor the corrected plasma sodium levels, but even more important is the monitoring of the effective plasma osmolality (Table 2)[2]. Correction of effective plasma osmolality should be gradual (no more than 4 mOsm/h or 10 mOsm in 2-3 hours) to prevent fast opposing fluid shifts, from extracellular to intracellular, that could lead to cerebral edemawhenbrain cell osmolality is not (yet) adapted to the faster lowering of the extracellular (plasma) osmolality[3,4].Current expert opinion is based on animal studies and case reports and states that the risk for cerebral edema is determined by changes in effective plasma osmolality[5].This is considered most important during the first 15 hours of treatment[2,6]Symptomatic cerebral edema is mostly described in children with diabetic ketoacidosis[7]. It is seldom seen in adults with DKA or HHS[8-10].However, several guidelines [3,4] advise to consider corrected sodium and effective osmolality and to adjust fluid therapy accordingly, which implies thatthe reduction in glucose levels is accompanied by increases in (measured) sodium levelsin order to safely decrease theplasma osmolality.There is no consensus between different guidelines if the fluid treatment should be based on effective, measured or calculated plasma osmolality, but we suggest to use effective or calculated plasma osmolality since it is quicker in use.
|
Formula |
Reference value |
Case, at presentation |
Anion gap
Correction for albumin |
(Na+K)- (Cl+ HCO3-)
per 1 g/dl below/above 4 g/dl albumin add/subtract 2.5 mmol/L to the AG[28] |
5-11 mmol/L |
51.3 |
Serum osmolality |
2xNa+glucose+urea |
275-300 mOsmol/kg |
470* |
Osmol gap |
calculated- measured osmolality |
<10 mOsmol/kg |
8 |
Corrected sodium |
Measured Na + (glucose/3) in mmol/l |
135-145 mmol/L |
180 |
Delta ratio |
(AG-normal value)/(24-HCO3-) |
0.8-1.2: ketoacidosis, lactate acidosis
>1.2: combined metabolic alkalosis
<0.8: combined normal AG metabolic acidosis |
>1.2 |
Table 2. Glossary of important formula’s in assessing metabolic disarrangements.
*abstracted from first available drawings.
AG: anion gap
Delta ratio: Delta AG/delta HCO3- (mmol/L)
Na: sodium
K: potassium
Cl: chloride
HCO3-: bicarbonate
In our patient extensive rehydration with normal saline was started in addition to glucose lowering therapy.Even though plasma sodium remained high, the (calculated) osmolality dropped gradually along with glucose levels, indicating save and effective rehydration and therapy (Figures1A and1B).
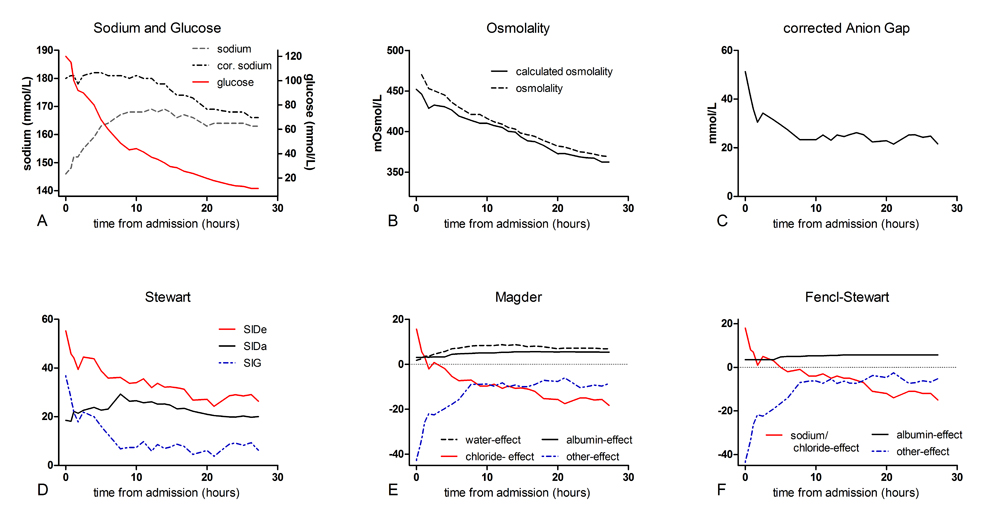
Figure 1. Course of sodium and glucose, osmolality and acid-base parameters according to the 4 described theories.
Methods in analyzing acid-base and electrolyte disturbances
Several explanatory models aim to help understanding the pathophysiology of metabolic disarrangements. We describe these disarrangementsin our case with the traditional model based on the Henderson-Hasselbalch equation, the Stewart approach andwith 2 modified methods based on the Stewart approach:‘Stewart at the bedsideby Magder’ and the simplified Fencl-Stewart approach (Textbox)[11,12].
Traditional method
The traditional method is a bicarbonate-centered approach. As explained in the textbox, its main principle is that bicarbonate and hydrogen are in equation with carbon dioxide (pCO2) and that the metabolic acidosis is based on the extent of bicarbonate loss. Either by loss of the ion resulting in a equilibrium shift to the left resulting in hydrogen formation, or by increases in hydrogen pushing the reaction to shift to the right with consequently an increase of pCO2. Compensatory mechanisms are respiratory to exhale excess pCO2or renal to retain bicarbonate. Our patients’ low level of bicarbonate combined with an elevated pCO2fits with a combined respiratory and metabolic acidosis. The elevated pCO2 is likely due to respiratory insufficiency as a result of his comatose state.
For more insight into the origin of the metabolic acidosis the aniongap is calculated with correction for the albumin concentration(Table 2). Failure to do so may result in an underestimation of the anion gap due to altered charges of weak anions because of albumin-based changes in pH [13]and finally lead to a false interpretation of the acid-base disorder[14,15].
Our patient had an extremely increased anion gap of 51.3indicating the presence of other anions than chloride or bicarbonate. Indeed, ketoacids were found, but inrelatively low concentrations suggestive for the co-existence of other anions. Other well-known anions that attribute to an increased anion gap are lactate or alcoholic ketoacids, or in case of co-existing increased osmole gap ingestion of ethylene glycol, ethanol or methanol[13].An osmole gap was not detected in the presented case.Assessment of thedelta ratio (Table 2) helps identifying the presence of co-existing metabolic acid-base disorders and is used to provide an estimate of the acid load[6,16].In a‘normal’ high anion gap acidosis every 1 mmol/L rise in/of the anion gap is expected to be accompanied by a 1 mmol/L decrease in the bicarbonate concentration, which is indicated by a delta ratio of 0.8-1.2[16]. In contrast, a delta ratio below 0.8 indicates a combined high anion gap and normal anion gap metabolic acidosis and a delta ratio above 1.2 indicates a combined high anion gap metabolic acidosis and metabolic alkalosis[17,18].In our case the deltaratio was increased (>1.2) which indicates the presence of a metabolic alkalosis. This metabolic alkalosis could be explained with the hypochloremia that most likely reflects a renal compensation of a probably longstanding existing metabolic acidosis and/or osmotic diuresis.
In conclusion, the extreme increased aniongap could only (partly)be explained by the presence of serum lactate and ketoacids and other, unknown anions should have attributed to the acidosis as well. Moreover, failing renal compensation of the acidosis, in a later stadium of the disease, with increased renal bicarbonate loss, as described by Kamel et al, may have added to the acidosis[6].
Stewart principle
The Stewart principle is based on physicochemical principles of water-based solutions. Its main principle is that all cation and anion concentrations must balance, according to the laws of electroneutrality. This is achieved by the dissociation of water as the source ofH+. It further dictates that pH is determined by three independent variables; the partial pCO2, the difference between the concentrations of strong cations and anions (SID), and the concentration of weak acids (Atot)[14,15,19].In the textbox the Stewart approach is further explained. Atot is the sum of non volatile (i.e. non CO2) weak acids thatare existing in a dissociated form (dissociated albumin and phosphates) and in an associated form accompanied by a proton. They are often referred to as buffers[13,20].
In our patient, analysis of the first obtained sample showed a combined respiratory and metabolic acidosis due to unmeasured anions which generallyinclude lactate, formate, ketoacids, salicylate, and sulfate[21].
Magder and Fencl- Stewart approaches
Next, modified methods based on the Stewart principle and developed for bedside application ofphysicochemical principles ‘Stewart at the bedside’ by Magder (further denoted as Magder) and the simplified Fencl-Stewart approachare applied to assess the presented case.
Magder included the pCO2as a traditional component and definedfour other metabolic processes that influence the acid-base balance: the water-effect, the chloride-effect, the albumin-effect and ‘others’[11].This approach showed -as also demonstrated in the Textbox and visualized in Figure 1E- a combined respiratory and metabolic acidosis, mostly due to the effect of ‘others’.Similarly to the unmeasured anions of Stewart’s analysis, ‘others’ includethe typical negative ions in the differential diagnosis of a wide anion gap acidosis (e.g. lactate, ketoacids, salicylate, sulfate)[11].In addition, Magder revealed a positive (+15.7) chloride-effect at admission thatcontributed to a metabolic alkalosis and counterbalanced the acidosis.The positive chloride-effect is in agreement with the increased delta ratio as detected with the traditional method.
Lastly, the simplified Fencl-Stewart approach integrated the standard base excess and the Stewart analysis and usesfour variables: the standard base excess (SBE), as measured by a bloodgas machine), and calculates the base excess effects of sodium-chloride, albumin and unmeasured ions[12,22].Sodium-chloride is seen as the principal component of the strong ion difference (SID) and albumin as the principal component of the total of weak anions (Atot). The unmeasured ions may be strong ions (e.g. sulphate, acetate) or weak acids (e.g. phosphate) pCO2 is considered a separate variable and should be analyzed to assess the respiratory component in acid-base disorders[12].
SBE is a calculated figure derived from pCO2and arterial pH[23].The calculation of SBE assumes a normal plasma protein concentration.However, in the critically ill the plasma protein is often lowered, which may limit the accuracy of the SBE[24]. With this in mindthis method is useful as a rough estimate of the acid-base disorder.
The assessment of the acid-base disorder of our patient following the simplified Fencl-Stewart approach is demonstrated in Figure 1F. At admission, the true SBE, the SBE corrected for the sodium-chloride and albumin-effect (as also explained in the Textbox), is strongly negative (-43.6), indicating that unmeasured ions are an important factor in causing this extreme acidosis.
Case continued
Several hours into treatment lactate levels were rising again and our patient became hyperchloremic. This, in combination with a diminished diuresis,raised the suspicion of an abdominal compartment syndrome an abdominal CT scan was performed. The scan showed signs of pancreatitis(Figure 2).
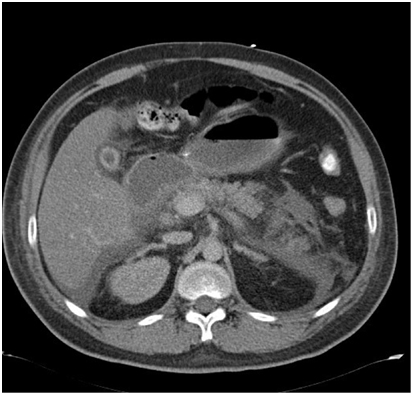
Figure 2. Abdominal CT- scanof the presented case (see text) showsedema of the pancreas (white arrow) suggestive for an acute pancreatitis.
At this timepoint, we analyzed his acid-base disturbance again (see Table 1 for used laboratory findings). We foundthe aniongap (25,3)(Figure1C)and the strong ion gap (14,1) (Figure1D)still increased, but numbers were significantly decreased compared to baseline values.Magder(Figure1E)showed a metabolic acidosis and a compensatory respiratory alkalosis. The acidosis is explained by a negative chloride-effect (-10.5, recall that this was a positive effect) and the presence of ‘others’, albeit in lower concentrations than initially. The positive albumin- and water-effect (5.01 and 8.40, respectively) indicate a counterbalancingalkalinizing effect.This coincides with a metabolic alkalosis as revealed by the increased delta ratio.The positive water-effect revealed a substantial shortage of body water, still present despite extensive resuscitation.
Analysis using the simplified Fencl-Stewart approach(Figure 1F) showed anegative sodium-chloride effect meaning that the SID has become smaller as a result of the (iatrogenic) hyperchloremia.Again, a positive albumin-effect was observed. The minimal difference between the measured SBE and the true SBE excluded the presence of unmeasured anions, which opposed the findings of the methods above.
To summarize, by assessing our patients’ extreme metabolic disarrangements and acid-base disorder using the four different methods we were able to compare them and to judge their clinical applicability and diagnostic value. Figure 1 clearly demonstrates the changes in laboratory results as assessed by the different methods in the first day after treatment initiation. From this several statements may be derived. First, the traditional approach allowed the detection of the different components of the acid-base disturbances. The traditional method detects the accompanying metabolic alkalosis, as long as all the correct steps are followed. Second, the Stewart approach gives a good physiological insight, but one tends to focus on the strong ion gap (SIG), missing possible accompanying metabolic disorders (e.g. hypochloremia). Another acknowledged drawback is its clinical applicability as it requires complex calculations. Third; Magder seems to give a complete picture of the probable causes of the acid-base disturbances. When critically reviewing the results from Magder, the shift in chloride-effect on the acid-base disorder is a striking result. Initially the chloride-effect was positive, contributing to an alkalinizing effect, while at our second timepoint the opposite was demonstrated with the development of an iatrogenic hyperchloremia. Fourth, the simplified Fencl-Stewart approach is an easy to use method and gives a quick insight in the seriousness of the problem, but does not give any physiological insight in the various components that contribute to the acid-base disturbances.
In conclusion,at this time point the contribution of unmeasured anions to the acidosis had decreased, as assessed with the different methods and in agreement with the treatment of the hyperglycemia. New, and clearly demonstrated by Magder, is the effect of the iatrogenic induced hyperchloremia to the acid base balance. Moreover, the high anion gap or ‘others’ effect is most likely due to decreased renal acid excretion as a result of renal insufficiency and elevated lactate levels because of an abdominal compartment syndrome.
Conclusion
In conclusion, this case demonstrates the complexity of acid-base and electrolyte disturbances in patients with DKA or HHS.
We showed the importance ofunderstanding the corrected sodium levels and osmolality as indicators of the severity of the metabolic derangement and fluid status of a patient and as parametersto guide choices in fluid therapy.
Four different methods of analyzing acid-base disorders, based on the principle of mass balance and electrochemical neutrality, were compared by step by step analysis of a case with severe HHS and metabolic disarrangements.
Most clinicians are familiar with the traditional bicarbonate-centered approach which,as demonstrated by critical reviewing this extreme case, detectedthe same acid-base disorders as the Stewart-based approaches as long as the anion gap is corrected for plasma albumin concentrations. In our opinion,the traditional method or Magder are the most easy to use and most insightful methods in analyzing acid-base disorders.
References
2021 Copyright OAT. All rights reserv
- Adeva-Andany MM, Carneiro-Freire N, Donapetry-García C, Rañal-Muíño E, López-Pereiro Y (2014) The importance of the ionic product for water to understand the physiology of the acid-base balance in humans. Biomed Res Int 2014: 695281.[Crossref]
- Palmer BF, Clegg DJ (2015) Electrolyte and Acid-Base Disturbances in Patients with Diabetes Mellitus. N Engl J Med 373: 548-559.[Crossref]
- NIV Acute ontregeling Diabetes Mellitus. http://www.internisten.nl/uploads/EK/TB/EKTBTdHzI3gV9NtRzoQ-mw/richtlijn-module-Acute-ontregeling_2013_Diabetes.pdf, 2013.
- (2013) Canadian Diabetes Association Clinical Practice Guidelines Expert. In: Goguen CJ, Gilbert J (Eds.), Hyperglycemic emergencies in adults. Can J Diabetes 37: p. S72-6.
- O'Malley G, Moran C, Draman MS, King T, Smith D, et al., (2008) Central pontine myelinolysis complicating treatment of the hyperglycaemic hyperosmolar state. Ann Clin Biochem 45: p. 440-3. [Crossref]
- Kamel KS, Halperin ML (2015) Acid-base problems in diabetic ketoacidosis. N Engl J Med 372: 1969-1970.[Crossref]
- Krane EJ, Rockoff MA, Wallman JK, Wolfsdorf JI (1985) Subclinical brain swelling in children during treatment of diabetic ketoacidosis. N Engl J Med 312: 1147-1151.[Crossref]
- Raghavendra S, Ashalatha R, Thomas SV, Kesavadas C(2007) Focal neuronal loss, reversible subcortical focal T2 hypointensity in seizures with a nonketotic hyperglycemic hyperosmolar state. Neuroradiology 49: 299-305. [Crossref]
- Scott AR1; Joint British Diabetes Societies (JBDS) for Inpatient Care; JBDS hyperosmolar hyperglycaemic guidelines group (2015) Management of hyperosmolar hyperglycaemic state in adults with diabetes. Diabet Med 32: 714-24. [Crossref]
- Cokar O, Aydin B, Ozer F (2004) Non-ketotic hyperglycaemia presenting as epilepsia partialis continua. Seizure 13: 264-269.[Crossref]
- Magder S, Emami A (2015) Practical approach to physical-chemical acid-base management. Stewart at the bedside. Ann Am Thorac Soc 12: 111-117.[Crossref]
- Story DA, Morimatsu H, Bellomo R (2004) Strong ions, weak acids and base excess: a simplified Fencl-Stewart approach to clinical acid-base disorders. Br J Anaesth 92: 54-60.[Crossref]
- Kellum JA, Moviat M, van der Hoeven JG (2009) Using the Stewart model at the bedsid, in Stewarts textbook of acid base. 339-345.
- Masevicius FD, Dubin A (2015) Has Stewart approach improved our ability to diagnose acid-base disorders in critically ill patients? World J Crit Care Med 4: 62-70.[Crossref]
- Seifter JL (2014) Integration of acid-base and electrolyte disorders. N Engl J Med 371: 1821-1831.[Crossref]
- Wrenn K (1990) The delta (delta) gap: an approach to mixed acid-base disorders. Ann Emerg Med 19: 1310-1313.[Crossref]
- Reddy P1, Mooradian AD (2009) Clinical utility of anion gap in deciphering acid-base disorders. Int J Clin Pract 63: 1516-1525.[Crossref]
- Elisaf MS, Tsatsoulis AA, Katopodis KP, Siamopoulos KC (1996) Acid-base and electrolyte disturbances in patients with diabetic ketoacidosis. Diabetes Res Clin Pract 34: 23-27.[Crossref]
- Story DA, Kellum JA (2004) New aspects of acid-base balance in intensive care. Curr Opin Anaesthesiol 17: 119-123.[Crossref]
- Schiraldi F, Guiotto G (2014) Base excess, strong ion difference, and expected compensations: as simple as it is. Eur J Emerg Med 21: 403-408.[Crossref]
- Fidkowski C, Helstrom J (2009) Diagnosing metabolic acidosis in the critically ill: bridging the anion gap, Stewart, and base excess methods. Can J Anaesth 56: 247-256.[Crossref]
- Balasubramanyan N, Havens PL, Hoffman GM (1999) Unmeasured anions identified by the Fencl-Stewart method predict mortality better than base excess, anion gap, and lactate in patients in the pediatric intensive care unit. Crit Care Med 27: 1577-81.[Crossref]
- Mallat J, Barrailler S, Lemyze M, Pepy F, Gasan G, et al. (2013) Use of sodium-chloride difference and corrected anion gap as surrogates of Stewart variables in critically ill patients. PLoS One 8: e56635.[Crossref]
- Figge J, Rossing TH, Fencl V (1991) The role of serum proteins in acid-base equilibria. J Lab Clin Med 117: 453-467.[Crossref]