Abstract
Purpose: Transforming growth factor-beta (TGF-β activates the canonical Smad pathway, which includes the Smad family of proteins and SARA (Smad Anchor for Receptor Activation) and other less understood pathways, including one involving p38MAPK. The goal of the current research was to determine if corneal epithelial cells and fibroblasts used the classical or alternative TGF-β-signaling pathways. To examine this question, we made use of Trx-SARA, which inhibits native SARA, thus blocking the Smad pathway.
Methods: A human corneal epithelial cell line (HCE-TJ), and stromal fibroblasts (HCF) were infected with retroviruses (RTV) containing either Trx-SARA or Trx-GA (a control plasmid). The effect of Trx-SARA on thrombospondin-1 (TSP-1) expression in both cell types, p15ink4b expression in HCE-TJ, and cellular fibronectin (cFN) expression in HCF was determined. In addition, the effect of p38MAPK inhibitor on TSP-1 and p15ink4b were examined.
Results: In HCE-TJ with TGF-β1, TSP-1-protein levels increased and peaked at 24 hours. Trx-SARA reduced TSP-1 expression in HCE-TJ, but had no effect on p15ink4b. With HCF, Trx-SARA failed to reduce TSP-1 expression; however, cFN expression decreased and proliferation was inhibited. By blocking the p38MAPK pathway, TSP-1 expression was reduced in HCF and p15ink4b expression was decreased in HCE-TJ.
Conclusions: Surprisingly, TSP-1 was regulated through the Smad pathway in HCE-TJ and the p38MAPK pathway in HCF. The p38MAPK pathway also induced p15ink4b in HCE-TJ. Our results indicate that not all TGF-β-target proteins require the Smad pathway, and it may be possible to block certain TGF-β-target proteins without blocking the expression of all the TGF-β-target proteins.
Introduction
Corneal wound repair is an ordered complex process that is regulated by many growth factors. One such growth factor is transforming growth factor beta (TGF-b), which is a multifunctional cytokine that plays a pivotal role in regulating growth, differentiation, proliferation, adhesion, apoptosis, and function of numerous cell types, including human corneal tissue [1-3]. TGF-b signaling is initiated at the cell surface with TGF-b interacting with type I and type II transmembrane receptors (TGF-βRI and -RII, respectively), each with intrinsic serine/threonine kinase activity [4,5]. TGF-b binding enables the formation of a heterotetrameric receptor complex, which leads to the activation of either a non-Smad-signaling pathway—p38MAPK, Ras(ErK/MAPK), PP2A, RhoA, and JNK [6]—or the better known Smad-signaling pathway, which is initiated by the phosphorylation and activation of Smad2 and 3. Smad2 and 3 are TGF-b-specific intracellular signal transducers, which, upon phosphorylation, interact with the common Smad (Smad4) and form heterodimeric and heterotrimeric complexes. These complexes then translocate into the nucleus and bind to transcription factors, coactivators, or corepressors, to activate or inhibit the expression of TGF-b-response genes [4, 5, 7, 8].
In 2006, Zhao et al. [9] used Trx-SARA, a Smad-binding peptide aptamer, to disrupt the Smad-signaling pathway. SARA (Smad anchor for receptor activation) was identified [10] in 1998 as a Smad2 and 3 interacting protein [11]. After TGF-b stimulation, SARA recruits Smad2 or 3 to the TGF-bRI portion of the RII/I complex. Once recruited, the Smad2 or 3 is phosphorylated, released from SARA and assembled into Smad2/4 and Smad3/4 complexes [10]. Trx-SARA is comprised of a rigid scaffold Trx (the Escherichia coli thioredoxin A protein) followed by the Smad-binding domain of SARA (a constrained 56-amino acid Smad-binding motif from the SARA protein) [9]. By binding to monomeric Smad proteins, Trx-SARA reduces the level of Smad2 and 3 in complex with Smad4 after TGF-β stimulation.
In our previous studies, we found that TGF-β signaling was involved in corneal wound repair in both debridement and keratectomy wound models, and that wound type affects the TGF-β-signaling pathway [12]. TGF-β signaling through the Smad pathway was activated in response to corneal wounds where the basement membrane was removed, such as our keratectomy wound model. In a keratectomy, we found that Smad2 translocated to the nucleus in the epithelium that was migrating to cover the wound; however, in a central debridement, Smad2 and 4 localization remained primarily cytoplasmic [13]. Of interest, we found that p15ink4b, a cell cycle inhibitor and a known downstream gene of TGF-β, was upregulated in the migrating epithelium after a debridement wound, in the same cells where TGF-βRII was upregulated [14]. We also observed that p15ink4b was sufficient to inhibit proliferation and promote migration of human corneal epithelial cells [15]. Similarly, we observed that thrombospondin-1 (TSP-1), a modulator gene found downstream of TGF-β [16], was upregulated in debridement, keratectomy, and penetrating wounds [17,18]. Curiously, although TGF-βRII appeared to be activated in all wound models, the expression of p15ink4b and TSP-1, as well as levels of Smad2 activation, varied with the model [13,14]. One potential explanation is that TGF-β is differentially activating different signaling pathways.
The goal of our current investigation was to determine if Trx-SARA might help in dissecting the signaling response to TGF-β; therefore, we examined the use of Trx-SARA to examine TGF-β signaling in both corneal epithelial cells and corneal fibroblasts. We examined two known TGF-β-responsive proteins that we previously reported to be upregulated in response to corneal wounds, TSP-1 and p15ink4b [14,17,18], and another TGF-β-regulated protein, cellular fibronectin (cFN). Interestingly, we found that not only did the pathways responsible for TGF-β-target gene expression vary for different proteins, but also different pathways were used for the same protein, TSP-1, in epithelium and fibroblasts.
Materials and methods
Cell culture
SV-40 transformed human corneal epithelial cells (HCE-TJ) were generously provided by Dr. Araki-Sasaki (Kinki Central Hospital, Hyogo, Japan). Primary human corneal epithelial cells (pHCE) and fibroblasts (HCF) were isolated from human corneas obtained from National Disease Research Interchange (NDRI; Philadelphia, PA), as previously described [12,19]. HCE-TJ and pHCE were cultivated in basic media (BM: Keratinocyte-SFM; Invitrogen, Carlsbad, CA) plus additives (bovine pituitary extract and EGF: Invitrogen) at 37°C in a 5% CO2 humidified atmosphere. HCF were grown in Eagle’s minimum essential medium (EMEM: ATCC, Manassas, VA) with 10% serum (FBS: Atlanta Biologicals, Flowery Branch, GA). This study adhered to the tenets of the Declaration of Helsinki.
Production of retrovirus and infection of corneal cells
Four retrovirus (RTV) plasmids were used in this study. The first two were kindly provided by Dr. F Michael Hoffman (University of Wisconsin-Madison; Madison, WI): 1) NLS-Trx-GA (pCMMV-NLS-HA-Trx-GA-IRES-GFP) and 2) NLS-Trx-SARA (pCMMV-NLS-HA-Trx-SARA-IRES-GFP). The second two were generated from the first two: 1) Trx-GA (pCMMV-HA-Trx-GA-IRES-GFP) and 2) Trx-SARA (pCMMV-HA-Trx-SARA-IRES-GFP). Trx-GA is a control Trx aptamer of Trx-SARA, containing an 11-amino acid repeat of Gly-Ala. The original plasmids from Dr. Hoffman had a nuclear localization sequence (NLS) in the aptamer, allowing for the Trx-SARA protein to enter the nucleus, thus targeting the Smad-transcription factor protein-protein interactions in the nucleus [9]. However, since the natural endogenous SARA is located in the cytoplasm of the cell, we deleted the NLS from the original plasmids to enable exogenous Trx-SARA to stay in the cytoplasm, thus providing enough SARA to block the TGF-β signaling. The four RTV plasmids were then individually co-transfected with the plasmids pMD.MLVgag.pol and pHDM.G(Env) (Harvard Gene Therapy Initiative; Boston, MA) into 293T cells using Lipofectamine (Invitrogen) according to manufacturers instruction. The RTV was produced and released by the cells into the medium. The medium was then collected for 5 days and concentrated by centrifugation (25,000g, 90 min at 4°C). HCE-TJ, pHCE, and HCF were seeded separately in 6-well plates and infected with the RTVs by incubating the cells with concentrated RTV in the culture medium + 8μg/ml polybrene (Sigma-Aldrich; St. Louis, MO) for 24 hours. The RTVs have an IRES (Internal Ribosome Entry Site), which allows for the GFP (green fluorescent protein) and Trx-SARA or NLS-Trx-SARA to be expressed separately but simultaneously; therefore, if the cell is green when viewed with a fluorescent microscope, the GFP is being expressed and one can safely assume the gene of interest is also being expressed. To confirm that the cells were indeed successfully infected with the gene of interest, the cells were viewed and photographed with an inverted Nikon Eclipse TE300 microscope equipped with a digital Spot camera (Micro Video Instruments; Avon, MA, USA). After the cells were examined for GFP, they were expanded, collected, and processed for western blot analysis, RT-PCR, or indirect-immunofluorescence (IF).
Western blot analysis
Cells ± RTV infection were seeded in 100 mm dishes with BM + additives (for HCE-TJ and pHCE) or EMEM + 10% serum (for HCF). When 50-60% confluent, the cells were starved (BM or EMEM only, no additives or serum) ± 10μM of p38MAPK inhibitor (SB202190: Calbiochem; Billerica, MA) [20,21] overnight, and then incubated for 0, 2, 6, 24, or 48 hours in BM ± 2ng/ml of TGF-β1 and ± 10μM of p38MAPK inhibitor (6 hour time point only) for HCE-TJ or pHCE, or 24 hours in EMEM ± 2ng/ml of TGF-β1 for HCF. The cells were then harvested, lysed and the protein was isolated and western blot analysis was performed, as previously described [22,23]. Briefly, total protein was separated on a 4-20% gel (NuPAGE; Invitrogen) and transferred to a membrane (Immobilon P; Millipore; Billerica, MA). The membrane was blocked in Blotto (5% dry milk in TTBS [Tris buffered saline + 0.1% Tween 20]) for 1 hour, probed with either anti-TSP-1 (Abcam; Cambridge, MA), anti-cFN (Sigma-Aldrich Corp.; St. Louis, MO) or anti-p15ink4b (EMD Millipore; Billerica, MA) diluted in Blotto, and incubated overnight with gentle rocking at 4°C. After rinsing the membranes with TTBS, they were incubated for 1 hour with the corresponding secondary antibody conjugated to either HRP (Jackson ImmunoResearch; West Grove, PA) or IRDye 680RD or 800CW (Li-Cor; Lincoln, Nebraska) diluted in Blotto. Membranes were then either incubated with Super Signal Substrate (Thermo Scientific-Pierce; Rockford, IL) and exposed to x-ray film (Amersham Hyperfilm HCL: GE Healthcare Biosciences; Piscataway, NJ) or viewed on an infrared imaging system (Odyssey: Li-Cor). Blots that were exposed to x-ray film had equal total protein loaded onto the gels and the transfer and loading efficiency was verified by staining the membrane (Ponceau S: Sigma-Aldrich) prior to incubation with primary antibody. The blots that were viewed with the infrared imaging system were also incubated with anti-β-actin (Sigma-Aldrich), which was used as an internal control.
Indirect Immunofluorescence (IF)
Cells ± RTV infection were seeded onto chamber slides in BM + additives for HCE-TJ or EMEM + 10% serum for HCF. When ~60-80% confluent, media was removed, and the cells were rinsed 3 times with PBS, starved overnight (BM or EMEM only), incubated in BM or EMEM ± 2ng/ml of TGF-β1 for 20 minutes, fixed with methanol, and then processed for IF [24]. In brief, slides were blocked with blocking solution (1% bovine serum albumin [BSA] + 0.1% Triton-X in phosphate buffered serum [PBS]), incubated overnight at 4ºC with anti-Smad2 (Abcam), anti-α-smooth muscle actin (SMA: DAKO; Carpinteria, CA) or anti-Ki67 (Vector Labs; Burlingame, CA), and then incubated for 1 hour at room temperature with the appropriate secondary antibody conjugated to fluorescein (Jackson ImmunoResearch; West Grove, PA). Slides were coverslipped with mounting media containing DAPI (Vector Labs), which is a nuclear counter stain. Slides were observed with a Nikon Eclipse E800 for IF and DIC (differential interference contrast) and photographed with either an Andor Clara E camera with Nikon NIS Elements for Basic Research or SPOT digital camera (Micro Video Instruments). Samples where the primary antibody was omitted served as negative controls.
Reverse Transcription Polymerase Chain Reaction (RT-PCR)
RT-PCR was performed as previously described [25], with specific primers for p15ink4b and TSP-1 (Table 1) [26]. In brief, the HCE-TJ ± RTV infection were starved overnight (BM only), and then incubated for an additional 4 hours in BM ± 2ng/ml TGF-β1. After which, the cells were harvested, mRNA was isolated (Trizol: Invitrogen), and RT (RT Kit: Qiagen; Valencia, CA) -PCR (PCR Kit: Sigma-Aldrich) was performed. The PCR products were resolved on a 1.5% agarose gel and visualized (Biospectrum AC imaging system: UVP, LLC; Upland, CA). G3PDH primers served as both an internal control [15] for the system and a positive control for cDNA quality. Samples with no cDNA served as the negative control.
Table 1. Primer sequences used in RT-PCR.
Target Gene |
Primer Sequence
(5’à3’) |
Fragment Size
(bp) |
TSP-1 |
FP 5’-CGTCCTGTTCCTGATGCATG-3’ |
1037 |
|
RP 5’-GGCAGGACACCTTTTTGCAGA-3’ |
|
p15ink4b |
FP 5’-GGAAGCCGGCGCGGATC-3’ |
186 |
|
RP 5’-AGCGTGTCCAGGAAGCCCTCC-3’ |
|
G3PDH |
FP 5’-ACCACAGTCCATGCCATCAC-3’ |
452 |
|
RP 5’-TCCACCACCCTGTTGCTGTA-3’ |
|
FP = Forward Primer; RP = Reverse Primer
Statistical analysis
Software (ImageJ, v. 1.45s; National Institutes of Health; Bethesda, MD: http://imagej.nih.gov/ij) was used to measure the bands from both the Western blot and the RT-PCR data (n=3), and to count the number of Ki67-positive cells and nuclei stained with DAPI (n=4). The data was plotted and analyzed for significant variations (p<0.05) using the Student’s t-test and Dunnett’s Multiple Comparison test (GraphPad Prism v.5.0b; La Jolla, CA).
Results
The efficiency of RTV infection is shown in figure 1, where at least 95% of the cells infected with RTV were positive for GFP—HCE-TJ (Figure 1A and B1) and HCF (Figure 1C and D1). No apparent difference was noted between Trx-SARA (Figure 1A and C) and NLS-Trx-SARA (Figure 1B1 and D1), and no fluorescence was seen in the uninfected HCE-TJ (1B2) and HCF (D2), which served as the negative controls for GFP. The infection rate in pHCE was the same as HCE-TJ and HCF (data not shown). These data indicate that Trx-SARA ± NLS infected both human corneal epithelial and fibroblast cell types efficiently.
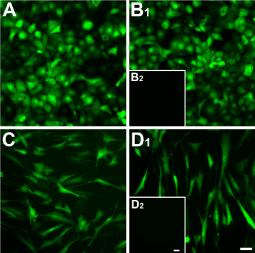
Figure 1. Analysis of Trx-SARA and NLS-Trx-SARA retrovirus infection efficiency in HCE-TJ (A and B1) and HCF (C and D1). HCE-TJ and HCF were infected with Trx-SARA-IRES-GFP (A and C) or NLS-Trx-SARA-IRES-GFP (B1 and D1) retrovirus. The cells were photographed 2 days after infection. The green cells, which are GFP positive, indicate that the Trx-SARA was being expressed in these cells. HCE-TJ (B2) and HCF (D2) were not infected with retroviruses and served as negative controls. Images are representative of three experiments. Bars = 50 microns.
To determine the optimal exposure time to TGF-β1, we examined the following question: At what time does TGF-β1 have its maximal effect on TSP-1 in HCE-TJ and pHCE cells? As seen in Figure 2A, even with starving the cells overnight (Control: BM only with no TGF-β1), the HCE-TJ produced low levels of TSP-1. Over the course of 24 hours with TGF-β1 exposure, the amount of TSP-1 protein increased linearly, peaking at 24 hours (p<0.01, compared with Control); however, by 48 hours, the amount of TSP-1 protein present in these cells decreased. The pHCE had the same response pattern (Figure 2B) as HCE-TJ. Since the peak of TSP-1-protein levels was at 24 hours for both sets of epithelial cells, we determined this to be our optimal TGF-β1-exposure time for the rest of our experiments. Also, we decided to use HCE-TJ as the representative for human corneal epithelial cells in the rest of these studies due to the limitation of the number of pHCE passages, and the similarity of pHCE and HCE-TJ in the RTV infection efficiency (Figure 1) and the TSP-1-protein response to TGF-β1 stimulation (Figure 2).
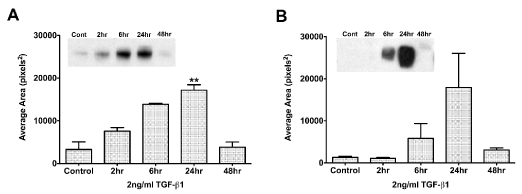
Figure 2. Western blot analysis of TGF-β1 exposure time in HCE-TJ (A) and pHCE (B). TSP-1 expression increased in both epithelial cell types and peaked at 24 hours. By 48 hours, TSP-1 expression decreased to control levels. Representative blot from one of three experiments shown. **p<0.01
Trx-SARA’s inhibitory effect on the TGF-β/Smad pathway was tested by examining Smad2 expression and localization in HCE-TJ ± Trx-GA or Trx-SARA. As seen in Figure 3, Smad2 was localized in both the cytoplasm and nucleus of Controls-HCE-TJ (Figure 3A) and HCE-TJ + Trx-GA (Figure 3C). Upon TGF-β1 stimulation, Smad2 appeared to translocate into the nucleus of these cells (Figure 3B and D; HCE-TJ and HCE-TJ + Trx-GA, respectively). However, in Trx-SARA containing cells, not only in non-TGF-β1-treated cells (Figure 3E), but also in TGF-β1-stimulated cells (Figure 3F), no Smad2 was detected, indicating that the effect of TGF-β1, endogenous and exogenous, was efficiently blocked by Trx-SARA.
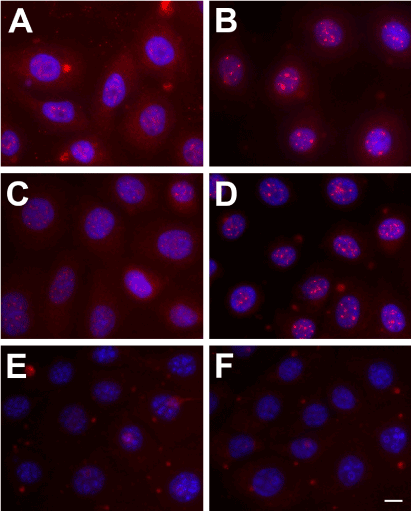
Figure 3. Indirect-immunofluorescence of Smad2 (red) in HCE-TJ (A, B), HCE-TJ + Trx-GA (C, D), and HCE-TJ + Trx-SARA (E, F) without (A, C, and E) or with (B, D, and F) TGF-β1. DAPI (blue) was used as a counterstain to mark all cell nuclei. Bar = 10 microns.
The effectiveness of Trx-SARA ± NLS was determined by processing HCE-TJ ± RTV infection for western blot and examining for the amount of TSP-1 protein (Figure 4A). As seen in Figure 4A with BM only, the control plasmid samples (NLS-Trx-GA or Trx-GA) had little effect on TSP-1 expression as compared with HCE-TJ only; however, NLS-Trx-SARA and Trx-SARA decreased TSP-1-protein levels (2.6 and 1.6 fold, respectively), indicating that both SARA RTVs were active and inhibited TSP-1 in BM only. After exposure to TGF-β1, the TSP-1-protein levels were upregulated in HCE-TJ (2.4 fold), NLS-Trx-GA (2.2 fold), and Trx-GA (2.2 fold), as compared with HCE-TJ in BM only, and increased to control level in NLS-Trx-SARA. However, when the NLS was omitted from the Trx-SARA plasmid, TGF-β1 stimulation was blocked more effectively, causing the TSP-1-protein levels to be maintained at the same level as in BM only. These data thereby indicate that Trx-SARA blocked the Smad pathway more efficiently when present in the HCE-TJ cytoplasm rather than the nucleus. From these results, we decided to omit the NLS-Trx-GA and NLS-Trx-SARA samples from the rest of the experiments.
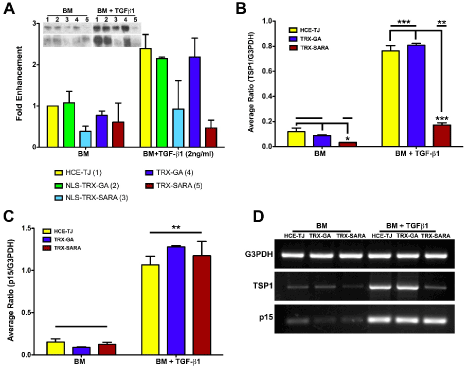
Figure 4. Exogenous SARA’s ability to block the TGF-β/Smad-signaling pathway in HCE-TJ was examined by western blot (A) and RT-PCR (B-D). (A) Western blot analysis showed that both NLS-Trx-SARA and Trx-SARA inhibited TSP-1 expression as compared with controls (HCE-TJ, NLS-Trx-GA and Trx-GA) in BM. Upon stimulation with TGF-β1, TSP-1 expression increased in the controls and NLS-Trx-SARA; however, TSP-1 levels did not increase in Trx-SARA infected cells, but rather, remained at a similar level as BM. Data from two independent experiments, both blots shown. (B) TSP-1 mRNA increased significantly with the addition of TGF-β1 (p<0.001 for controls [HCE-TJ and Trx-GA]; p<0.01 for Trx-SARA), and, as with the western blot data, Trx-SARA significantly decreased TSP-1 message levels in both the BM (p<0.05) and the BM + TGF-β1 (p<0.001) as compared with their corresponding controls. (C) p15ink4b mRNA also increased significantly upon the addition of TGF-β1 (p<0.01); however, Trx-SARA did not appear to block p15ink4b message levels. (D) Representative RT-PCR gels from one of three experiments. G3PDH was used as both an internal control for the system and a positive control for cDNA quality.
In addition to examining the protein levels of genes downstream of TGF-β signaling in HCE-TJ, we also examined message levels. As with protein levels (Figure 4A), TSP-1 mRNA levels were low in BM only samples (Figure 4B and D) and increased upon TGF-β1 treatment (p<0.001: controls; p<0.05: Trx-SARA). Interestingly, even though TSP-1 mRNA levels for all samples increased with TGF-β1, the TSP-1 mRNA level for the Trx-SARA + TGF-β1 sample decreased significantly compared to the controls with TGF-β1 (p<0.001: Figure 4B-D). A similar result was seen for p15ink4b mRNA, where there were low levels with BM only samples and then a dramatic increase with the addition of TGF-β1 (p<0.01: Figure 4C and D). However, unlike the TSP-1, there was no decrease in p15ink4b mRNA in the Trx-SARA samples treated with TGF-β1 compared with the TGF-β1 controls. These data indicate that TGF-β1 upregulated both TSP-1 and p15ink4b mRNA; however, Trx-SARA only blocked TSP-1 mRNA levels and not p15ink4b, thus indicating that p15ink4b may not be controlled by the Smad pathway in this cell type. Expression of p15ink4b protein mimicked the mRNA results (data not shown).
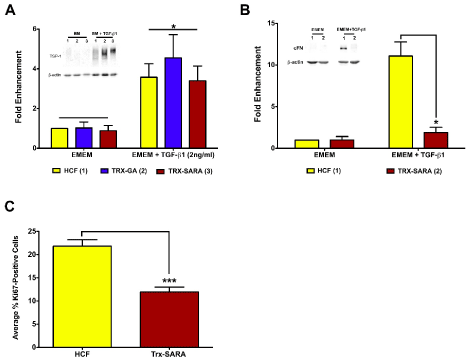
Figure 5. Exogenous SARA’s ability to block the TGF-β/Smad-signaling pathway (A and B) and to inhibit proliferation (C) was examined in HCF. (A) TSP-1 expression levels increased significantly in HCF with the addition of TGF-β1 with all samples (p<0.05); however, Trx-SARA did not have an effect on TSP-1 levels. (B) cFN expression also increased in HCF with the addition of TGF- β1; however, HCF with Trx-SARA had significantly less cFN than control (p<0.05). Representative blots from one of three independent experiments shown in both A and B. β-actin was used as an internal loading control. (C) Analysis of Trx-SARA’s effect on proliferation in HCF. Samples with Trx-SARA had significantly less Ki67-positive cells (~12%) than controls (~22%; p<0.001).
The effect of Trx-SARA was next examined in HCF. As seen in Figure 5A, TSP-1 expression was significantly upregulated in all the TGF-β1 samples compared with EMEM only (3-4-fold enhancement; p<0.05). This data is similar to that seen with HCE-TJ (Figure 4A). However, Trx-SARA HCF ± TGF-β1 had similar TSP-1-protein levels as controls (HCF and Trx-GA) ± TGF-β1 (Figure 5A), indicating that blocking the Smad pathway did not inhibit TSP-1-gene expression in HCF. This suggests that TSP-1, for this cell type, is not modulated through Smad signaling.
Another protein regulated by TGF-β in HCF is cellular fibronectin (cFN) [27,28]. Therefore, in addition to examining TSP-1, the expression of cFN protein in HCF also was assayed by western blot to determine if cFN is involved with the TGF-β/Smad pathway. As seen in Figure 5B, Trx-SARA inhibited cFN expression in HCF after TGF-β1 stimulation (p<0.05), indicating that cFN is regulated by TGF-β1 through the Smad pathway. Trx-GA gave similar results as HCF control (data not shown).
Interestingly, while growing the HCF for the western blot experiments, we noticed that the HCF infected with Trx-SARA appeared to grow slower than the controls (HCF and Trx-GA); therefore, we investigated if Trx-SARA had an effect on proliferation in HCF. As seen in Figure 5C, the percentage of Ki67-positive cells in Trx-SARA samples (~12%) was significantly less than in controls (~22%; p<0.001), which suggests that Trx-SARA negatively regulates HCF proliferation. Trx-GA samples proliferated at the same rate as control HCF (data not shown).
We also investigated if knocking down SARA had an effect on the morphology of either the HCE-TJ or HCF ± TGF-β1. As seen in Figure 6A, HCF consisted of a mixed population of fibroblasts and myofibroblasts. A similar population was present with the addition of TGF-β1 (Figure 6B), Trx-SARA (Figure 6C), and Trx-SARA + TGF-β1 (Figure 6D). No change in morphology was observed in the HCE-TJ under any conditions studied (data not shown).
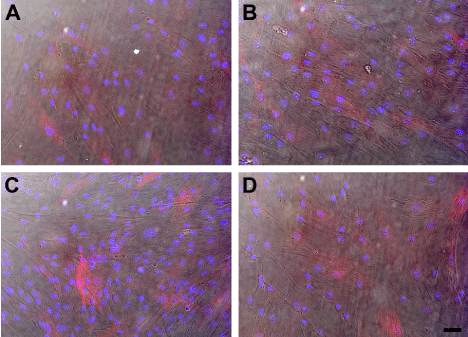
Figure 6. DIC and indirect-immunofluorescence of SMA (red) in HCF (A, B) and HCF + Trx-SARA (C, D) without (A, C) or with (B, D) TGF-β1. DAPI (blue) was used as a counterstain to mark all cell nuclei. Bar = 50 microns.
By utilizing Trx-SARA, we were able to show that the Smad pathway may not control p15ink4b in epithelial cells and TSP-1 in HCF; therefore, this data leaves us with the question: What other TGF-β pathway is involved? To answer this question, we examined the possibility of p15ink4b and TSP-1 being linked to the p38MAPK pathway, which is also downstream from TGF-β signaling. To examine this hypothesis, we used a p38MAPK inhibitor (SB202190) to test the effect on p15ink4b-protein levels in HCE-TJ ± TGF-β1 (Figure 7A) and TSP-1-protein levels in HCF ± TGF-β1 (Figure 7B). As seen in Figure 7, p15ink4b and TSP-1-protein levels significantly decreased with the p38MAPK inhibitor compared to the corresponding controls (BM/EMEM and BM/EMEM + TGF-β1, p<0.05), thus indicating that TGF-β1 regulates p15ink4b in HCE and TSP-1 in HCF through the p38MAPK pathway.
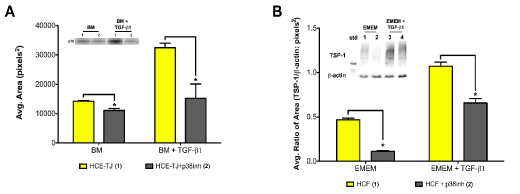
Figure 7. Western blot analysis of an alternate TGF-β-signaling pathway for (A) p15ink4b expression in HCE-TJ and (B) TSP-1 expression in HCF. (A) p15ink4b expression levels were significantly decreased when p38MAPK was inhibited in HCE-TJ when compared to the corresponding controls (p<0.05). Similarly, TSP-1 in HCF (B) decreased significantly when exposed to p38MAPK inhibitor as compared with the corresponding controls (p<0.05). Representative blots from one of three experiments shown.
Discussion
The goal of the present study was to determine which TGF-β-target proteins were regulated through the Smad pathway and which used alternate signaling pathways. In this study, we made use of Trx-SARA, an inhibitor that specifically blocks the Smad portion of the TGF-β-signaling pathway. Trx-SARA was originally designed to act in the nucleus [9], and in our initial experiments, we tested the hypothesis that by deleting the NLS from Hoffman’s original Trx-SARA plasmid, the Trx-SARA would stay in the cytoplasm and compete with the endogenous SARA more efficiently. The data from our current studies support our hypothesis, and the results indicate that the cytoplasmic presence of Trx-SARA blocks the Smad-signaling pathway in both un-stimulated and TGF-β1-stimulated HCE-TJ to a much greater extent than when Trx-SARA was located in the nucleus.
The first TGF-β-target protein we examined was TSP-1, a multifunctional matrix glycoprotein that has been found to be a TGF-β-downstream responsive protein in HCF, rat proximal tubular cells and fibroblasts, human optic nerve head astrocytes and pancreatic cancer cells, human and mice conjunctival cells [29], and highly expressed during tissue development and wound repair [16,30,31]. Previous studies have shown that TSP-1 was upregulated in wounded cornea, with localization suggesting that the initial source of TSP-1 was the epithelium [12,17,18]. As seen in Figure 4A, TSP-1-protein expression was efficiently blocked by Trx-SARA, which agreed with PCR data in Figure 4B and D, indicating that TSP-1 expression was regulated through Smad signaling in epithelial cells. Intriguingly, TSP-1 expression in HCF appeared to involve a different TGF-β-signaling pathway, as Trx-SARA did not block TSP-1 expression in these cells (Figure 5A). Previous studies reported that TSP-1 expression, in response to TGF-β1, was regulated by both ERK1/2 and p38MAPK in rat proximal tubular cells and mouse fibroblasts [16]. Our present studies indicate that TSP-1 is regulated by TGF-β1, at least in part, through the p38MAPK pathway in HCF (Figure 7B). In contrast, cFN, another matrix protein highly expressed during wound repair, is regulated by TGF-β1 in HCF through the Smad pathway (Figure 5B).
These results, where two corneal cell types used different pathways to produce TSP-1 surprised and excited us. As to why this occurs, we can only speculate; however, one reasonable explanation is that it has to do with timing of gene expression. We and others have documented that some of the Smad proteins are downregulated by TGF-β stimulation [32-34], which suggests that there may be an internal check mechanism blocking the continued expression of TGF-β-target proteins, such as TSP-1. Thus, in this concept, TSP-1 expression would be limited in epithelium, but not in fibroblasts, which uses the p38MAPK pathway. Since TSP-1 has been shown to activate TGF-β, this would result in a short-term expression of TGF-β in the epithelium, but a much longer exposure time in fibroblasts. We will continue exploring the functional significance of the use of different pathways.
Another TGF-β-target protein we examined was p15ink4b, a member of the inhibitors of cyclin-dependent kinase 4 (INK4) family [15,35,36]. Studies have shown that TGF-β1 stimulated p15ink4b expression in HCE cells [37], and that p15ink4b can block cells from proceeding through the cell cycle [15,38]. In addition, it has been shown that p15ink4b was upregulated in the non-proliferative migrating epithelium in a debridement wound [37], which happens to be the same cells where Smad2 and 4 localization remained primarily cytoplasmic [12-14]. This data suggests that even though p15ink4b is a TGF-β1-target protein, the SMAD pathway is not activating it in epithelial cells. One possible explanation is that TGF-β1 is stimulating the activation of a non-Smad-signaling pathway(s) in corneal debridement wounds. Our current investigation agrees with this hypothesis. In the present study, we found that p15ink4b mRNA expression increased in HCE-TJ upon stimulation with TGF-β1; however, there was no effect on the p15ink4b levels with the addition of Trx-SARA (Figure 4C and D), unlike the results with TSP-1 (Figure 4B and D). However, when HCE-TJ were pre-treated with SB202190, a p38MAPK inhibitor, we found that TGF-β1 failed to upregulate p15ink4b protein to control level (Figure 7A), thus suggesting that TGF-β1 regulates p15ink4b expression in HCE-TJ, at least in part, through the p38MAPK pathway.
During our investigation of HCF infected with Trx-SARA, we observed that the cells appeared to grow slower than the control HCF. We examined this phenomenon and determined that proliferation rates were about one half of the control cells (Figure 5C). TGF-β1 is a well known inhibitor of mitosis in many cell types, including epithelial and epidermal cells [39]. However, TGF-β1 can also act as a proliferative inducer of other cell types [40-42]. In a previous study [43], TGF-β1 was shown to significantly stimulate cell proliferation of corneal stromal fibroblasts in an indirect manner by stimulating FGF2. Similar studies by Jester et al. [44] indicated that PDGF might also be involved in a similar mechanism. Our present study indicates that control of HCF growth is at least in part through Smad signaling. Further studies are needed to clarify the affects of blocking the Smad pathway on FGF2 or PDGF expression.
In conclusion, Trx-SARA was used to study the regulation of expression of TGF-β-target proteins in pHCE, HCE-TJ, and HCF. Trx-SARA’s presence in the cytoplasm exhibited better blocking results than NLS-Trx-SARA. The ability of Trx-SARA to block the induction of TSP-1 in HCE-TJ demonstrated that TSP-1 was regulated by TGF-β1 through the Smad pathway; however, Trx-SARA was unable to block the upregulation of p15ink4b expression in HCE-TJ and TSP-1 expression in HCF, demonstrating that p15ink4b in HCE-TJ and TSP-1 in HCF must be regulated by TGF-β1 through an alternative TGF-β-signaling pathway in these cell types. When TGF-β1-stimulated HCE-TJ and HCF were treated with p38MAPK inhibitor, p15ink4b and TSP-1 expression decreased respectively, thus indicating that the p38MAPK pathway may at least be, in part, the pathway by which TGF-β1 effects p15ink4b in HCE-TJ and TSP-1 in HCF. In addition, Trx-SARA blocked the expression of cFN in HCF cells upon TGF-β1 stimulation, suggesting that cFN was regulated by TGF-β1 through the Smad pathway. Interestingly, Trx-SARA also was found to inhibit HCF proliferation. In conclusion, perhaps our most significant findings are that not all TGF-β-target proteins are induced through the Smad pathway, and that HCE and HCF use different pathways for TGF-β-target protein expression. In addition, HCF apparently can transform to a myofibroblast morphology by means of a pathway that does not involve the Smad proteins. Finally, it may be possible to allow the production of some TGF-β-target proteins while blocking the induction of others, which could be useful in the treatment of disease or trauma.
References:
- Massagué J (1990) The transforming growth factor-beta family. Annu Rev Cell Biol 6: 597-641. [Crossref]
- Miyazono K, ten Dijke P, Heldin CH (2000) TGF-beta signaling by Smad proteins. Adv Immunol 75: 115-157. [Crossref]
- Ljubimov AV, Saghizadeh M (2015) Progress in corneal wound healing. Prog Retin Eye Res 49: 17-45. [Crossref]
- Chang H, Brown CW, Matzuk MM (2002) Genetic analysis of the mammalian transforming growth factor-beta superfamily. Endocr Rev 23: 787-823. [Crossref]
- Shi Y, Massagué J (2003) Mechanisms of TGF-beta signaling from cell membrane to the nucleus. Cell 113: 685-700. [Crossref]
- Derynck R, Zhang YE (2003) Smad-dependent and Smad-independent pathways in TGF-beta family signalling. Nature 425: 577-584. [Crossref]
2021 Copyright OAT. All rights reserv
- Feng XH, Derynck R (2005) Specificity and versatility in tgf-beta signaling through Smads. Annu Rev Cell Dev Biol 21: 659-693. [Crossref]
- Massagué J, Seoane J, Wotton D (2005) Smad transcription factors. Genes Dev 19: 2783-2810. [Crossref]
- Zhao BM, Hoffmann FM (2006) Inhibition of transforming growth factor-beta1-induced signaling and epithelial-to-mesenchymal transition by the Smad-binding peptide aptamer Trx-SARA. Mol Biol Cell 17: 3819-3831. [Crossref]
- Tsukazaki T, Chiang TA, Davison AF, Attisano L, Wrana JL (1998) SARA, a FYVE domain protein that recruits Smad2 to the TGFbeta receptor. Cell 95: 779-791. [Crossref]
- Itoh F, Divecha N, Brocks L, Oomen L, Janssen H, et al. (2002) The FYVE domain in Smad anchor for receptor activation (SARA) is sufficient for localization of SARA in early endosomes and regulates TGF-beta/Smad signalling. Genes Cells 7: 321-331. [Crossref]
- Zieske JD, Hutcheon AE, Guo X, Chung EH, Joyce NC (2001) TGF-beta receptor types I and II are differentially expressed during corneal epithelial wound repair. Invest Ophthalmol Vis Sci 42: 1465-1471. [Crossref]
- Hutcheon AE, Guo XQ, Stepp MA, Simon KJ, Weinreb PH, et al. (2005) Effect of wound type on Smad 2 and 4 translocation. Invest Ophthalmol Vis Sci 46: 2362-2368. [Crossref]
- Zieske JD (2000) Expression of cyclin-dependent kinase inhibitors during corneal wound repair. Prog Retin Eye Res 19: 257-270. [Crossref]
- Guo X, Hutcheon AE, Zieske JD (2004) TAT-mediated protein transduction into human corneal epithelial cells: p15(INK4b) inhibits cell proliferation and stimulates cell migration. Invest Ophthalmol Vis Sci 45: 1804-1811. [Crossref]
- Nakagawa T, Li JH, Garcia G, Mu W, Piek E, et al. (2004) TGF-beta induces proangiogenic and antiangiogenic factors via parallel but distinct Smad pathways. Kidney Int 66: 605-613. [Crossref]
- Blanco-Mezquita JT, Hutcheon AE, Zieske JD (2013) Role of thrombospondin-1 in repair of penetrating corneal wounds. Invest Ophthalmol Vis Sci 54: 6262-6268. [Crossref]
- Matsuba M, Hutcheon AE, Zieske JD (2011) Localization of thrombospondin-1 and myofibroblasts during corneal wound repair. Exp Eye Res 93: 534-540. [Crossref]
- Guo X, Hutcheon AE, Melotti SA, Zieske JD, Trinkaus-Randall V, et al. (2007) Morphologic characterization of organized extracellular matrix deposition by ascorbic acid-stimulated human corneal fibroblasts. Invest Ophthalmol Vis Sci 48: 4050-4060. [Crossref]
- Davies SP, Reddy H, Caivano M, Cohen P (2000) Specificity and mechanism of action of some commonly used protein kinase inhibitors. Biochem J 351: 95-105. [Crossref]
- Frantz B, Klatt T, Pang M, Parsons J, Rolando A, et al. (1998) The activation state of p38 mitogen-activated protein kinase determines the efficiency of ATP competition for pyridinylimidazole inhibitor binding. Biochemistry 37: 13846-1353. [Crossref]
- Blanco-Mezquita JT, Hutcheon AE, Stepp MA, Zieske JD (2011) αVβ6 integrin promotes corneal wound healing. Invest Ophthalmol Vis Sci 52: 8505-8513. [Crossref]
- Chung EH, Hutcheon AE, Joyce NC, Zieske JD (1999) Synchronization of the G1/S transition in response to corneal debridement. Invest Ophthalmol Vis Sci 40: 1952-1958. [Crossref]
- Zieske JD, Mason VS, Wasson ME, Meunier SF, Nolte CJ, et al. (1994) Basement membrane assembly and differentiation of cultured corneal cells: importance of culture environment and endothelial cell interaction. Exp Cell Res 214: 621-633. [Crossref]
- Takahashi H, Kaminski AE, Zieske JD (1996) Glucose transporter 1 expression is enhanced during corneal epithelial wound repair. Exp Eye Res 63: 649-659. [Crossref]
- Cinatl J Jr, Kotchetkov R, Scholz M, Cinatl J, Vogel JU, et al. (1999) Human cytomegalovirus infection decreases expression of thrombospondin-1 independent of the tumor suppressor protein p53. Am J Pathol 155: 285-292. [Crossref]
- Beckmann JD, Illig M, Romberger D, Rennard SI, et al. (1992) Induction of fibronectin gene expression by transforming growth factor beta-1 is attenuated in bronchial epithelial cells by ADP-ribosyltransferase inhibitors. J Cell Physiol 152: 274-280. [Crossref]
- To WS, Midwood KS (2011) Plasma and cellular fibronectin: distinct and independent functions during tissue repair. Fibrogenesis Tissue Repair 4: 21. [Crossref]
- Soriano-Romaní L, Contreras-Ruiz L, García-Posadas L, López-García A, Masli S, et al. (2015) Inflammatory Cytokine-Mediated Regulation of Thrombospondin-1 and CD36 in Conjunctival Cells. J Ocul Pharmacol Ther 31: 419-428. [Crossref]
- Fuchshofer R, Birke M, Welge-Lussen U, Kook D, Lütjen-Drecoll E, et al. (2005) Transforming growth factor-beta 2 modulated extracellular matrix component expression in cultured human optic nerve head astrocytes. Invest Ophthalmol Vis Sci 46: 568-578. [Crossref]
- Takekawa M, Tatebayashi K, Itoh F, Adachi M, Imai K, et al. (2002) Smad-dependent GADD45beta expression mediates delayed activation of p38 MAP kinase by TGF-beta. EMBO J 21: 6473-6482. [Crossref]
- [Crossref] Guo X, Hutcheon AE2, Zieske JD3 (2016) Molecular insights on the effect of TGF-β1/-β3 in human corneal fibroblasts. Exp Eye Res 146: 233-241.
- Poncelet AC, Schnaper HW, Tan R, Liu Y, Runyan CE, et al. (2007) Cell phenotype-specific down-regulation of Smad3 involves decreased gene activation as well as protein degradation. J Biol Chem 282: 15534-15540. [Crossref]
- Yanagisawa K, Osada H, Masuda A, Kondo M, Saito T, et al. (1998) Induction of apoptosis by Smad3 and down-regulation of Smad3 expression in response to TGF-beta in human normal lung epithelial cells. Oncogene 17: 1743-1747. [Crossref]
- Park MT, Lee SJ (2003) Cell cycle and cancer. J Biochem Mol Biol 36: 60-65. [Crossref]
- Ravitz MJ, Wenner CE (1997) Cyclin-dependent kinase regulation during G1 phase and cell cycle regulation by TGF-beta. Adv Cancer Res 71: 165-207. [Crossref]
- Zieske JD, Francesconi CM, Guo X (2004) Cell cycle regulators at the ocular surface. Exp Eye Res 78: 447-456. [Crossref]
- Adams PD (2001) Regulation of the retinoblastoma tumor suppressor protein by cyclin/cdks. Biochim Biophys Acta 1471: M123-133. [Crossref]
- Wicik Z, Sadkowski T, Jank M, Motyl T (2010) Transcriptional pattern of TGF-beta1 inhibitory effect on mouse C2C12 myoblasts differentiation. Pol J Vet Sci 13: 629-638. [Crossref]
- Chen G, Khalil N (2006) TGF-beta1 increases proliferation of airway smooth muscle cells by phosphorylation of map kinases. Respir Res 7: 2. [Crossref]
- Majack RA, Majesky MW, Goodman LV (1990) Role of PDGF-A expression in the control of vascular smooth muscle cell growth by transforming growth factor-beta. J Cell Biol 111: 239-247. [Crossref]
- Soma Y, Grotendorst GR (1989) TGF-beta stimulates primary human skin fibroblast DNA synthesis via an autocrine production of PDGF-related peptides. J Cell Physiol 140: 246-253. [Crossref]
- Kay EP, Lee MS, Seong GJ, Lee YG (1998) TGF-beta s stimulate cell proliferation via an autocrine production of FGF-2 in corneal stromal fibroblasts. Curr Eye Res 17: 286-293. [Crossref]
- Jester JV, Huang J, Petroll WM, Cavanagh HD (2002) TGFbeta induced myofibroblast differentiation of rabbit keratocytes requires synergistic TGFbeta, PDGF and integrin signaling. Exp Eye Res 75: 645-657. [Crossref]


