Table 3. Biological Detector Measurements of Qigong |
Author, Year |
Study Design |
Population Characteristics |
Methods |
Outcome of Interests |
Main Findings |
# |
Country |
Age |
Sex |
Previous QG Practice |
Type of QG |
Biochemical Parameters |
Vera et al., 2007 [92] |
|
29 |
Spain |
18-21 |
14M15F |
None |
BDJ |
16 in QG, 13 in control. QG subjects were submitted to a qigong training program for a period of one month, practicing qigong for 30 minutes. Blood sample were taken before and after QG. |
To analyze the effects of a qigong training program on blood biochemical parameters of GOT (glutamic-oxaloacetic transaminase), GPT (glutamic-pyruvic transaminase), urea GGT (gamma-glutamyltransferase) |
A between-group analysis of covariance shows that the effects of experimental treatment after adjustment for covariants were found for GOT (U/L) QG: 16.7; Control: 21.4[ F(1,22)=10.7, p=.003], GPT (U/L) QG: 16.4. Control: 20.7. [F(1,22)=4.32, p=.04], urea (mg/dl) QG: 27.6, Control: 33.2 [F(1,22)=6.51, p=.02]. No significant effects were found for total cholesterol [F(1,22)=1.12, p=.30], high-density lipoprotein [F(1,22)=1.55, p=.22], low-density lipoprotein [F(1,22)=0.07, p=.78], triglycerides [F(1,22)=0.81, p=.37], phospholipids [F(1,22)=1,47, p=.23], and creatinine [F(1,22)=0.52, p=.47] |
Miao et al., 2009 [93] (In Chinese) |
RCT |
50 |
China |
QG group: 63.32 (6.35)
Control Group: 63.68 (6.8) |
25M, 25F |
None |
BDJ |
BP,TG, TC,HDL-C,LDL-C were tested at the beginning the intervention and after the intervention
QG participants first learned about BDJ and then practice QG 5-7 times per week, each time 50-60 minutes, last for 18 months
QG: 25, CON: 25 life as usual |
Explore the effect of BDJ on blood lipid of senior adults with hyperlipidemia. |
Compare with control group, there’s a statistically significant improvement of TC,TG, LDL-C,HDL-C among intervention group. (p<0.05)
TC:5.26 ± 0.51 vs. 5.96 ± 0.66
TG:1.15 ± 0.16 vs. 1.46 ± 0.22
HDL-C:1.85 ± 0.26 vs. 1.46 ± 0.22
LDL-C:3.32 ± 0.29 vs. 3.7 ± 0.49
(TC=total cholesterol, TG= triglyceride LDL-C=low-density lipoprotein cholesterol, HDL-C=high-density lipoprotein cholesterol) |
Liang et al., 2014 [94](In Chinese) |
RCT |
60 |
China |
QG: 54.8 (7.6)
C: 55.7 (8.8) |
QG: 20M, 10F
C: 18M, 12F |
None |
BDJ |
TG, TC,HDL-C,LDL-C [4] were tested at the beginning the intervention and after the intervention
30 participants practice QG 5 days per week, twice each day, each practice last 20 minutes, last for 6 months |
explore the effect of BDJ on BP and blood lipid of senior adults with hypertension. |
Compare with control group, there’s a statistically significant improvement of SBP,DBP,TC,TG, LDL-C,HDL-C among intervention group. (p<0.05)
SBP:136.4 ± 10.4 vs. 145.7 ± 12.3
DBP: 85.1 ± 7.5 vs. 89.5 ± 7.3
TC: 4.08 ± 0.8 vs. 5.13 ± 0.84
TG:2.12 ± 0.54 vs. 2.72 ± 0.66
HDL-C:1.34 ± 0.35 vs. 0.98 ± 0.38
LDL-C:2.45 ± 0.78 vs. 3.04 ± 0.77 |
Liu et al., 2010 [95] (In Chinese) |
RCT |
62 |
China |
65.7 (3.1), 62-69 |
All F |
None |
YJJ |
TG, TC,HDL-C,LDL-C ,SOD,GSH-Px and MDA [5] were tested at the beginning N=32
Participants practice QG 6 times a week, each time 40-50 minutes with the teaching of QG masters. Last for 6 months.
the intervention and after the intervention |
explore the effect of YJJ on blood lipid and free radical metabolism of female senior adults. |
Compare with control group, there’s a statistically significant improvement of LDL-C,HDL-C SOD,GSH-Px and MDA among intervention group. (p<0.05)
HDL-C:1.79 ± 0.67 vs. 1.37 ± 0.73
LDL-C:2.41 ± 0.53 vs. 2.57 ± 0.65
SOD: 113.92 ± 14.38 vs. 103.37 ± 12.78
GSH-Px : 167.14 ± 19.93 vs. 131.97 ± 20.38
MDA: 3.98 ± 0.64 vs. 4.62 ± 0.89 |
Glucose |
Liu et al., 2010 [1] |
OS |
11 |
Australia |
42-65 |
3M8F |
None |
KMQG |
A single group pre- and post- trial; Participants with elevated blood glucose attended Tai Chi QG exercise training for 1 to 1.5 h, 3 times per week for 12 weeks, and were encouraged to practice the exercises at home. Outcomes assessed immediately prior to and after 12 week program. |
To evaluate the feasibility, acceptability and effects of a Tai Chi and Qigong exercise program in adults with elevated blood glucose. |
Significant improvements between baseline and post-intervention in indictors of metabolic syndrome: bodyweight (baseline: 76.38; post: 73.42; mean difference -2.96kg, p<0.001) BMI (base: 27.83, post: 26.78; mean difference −1.05, p<0.001), waist circumference (base: 93.16; post: 90.36; mean−2.80 cm, p<0.05), and systolic (baseline: 129.73, post: 118.09; −11.64 mm Hg, p<0.01) and diastolic blood pressure (baseline: 84.55, post: 74.82, mean−9.73 mm Hg, p<0.001). Indicator of glycaemic control: HbA1c (baseline 5.59; post 5.27; mean −0.32%, p<0.01), insulin resistance (baseline: 2.61, post 2.08; mean −0.53, p<0.05), |
Sun et al., 2010 [53] |
RCT |
32 |
U.S. |
M56.3, SD8.1 |
NR |
None |
NA |
Group 1 (n = 11) received the Qigong intervention, group 2 (n = 10) served as the control group, and group 3 (n = 11) received the progressive resistance training (PRT) intervention as an active comparator. Participants in all three groups were asked to maintain their conventional diabetes care, including medications, diet, and exercise, during the study. Participants attended weekly Qigong or PRT group sessions (60 min per week) conducted by certified instructors in addition to practicing twice a week at home for 30 min per session. |
To investigate the effects of Qigong relative to physical exercise or standard care on glucose control in adults with type 2 diabetes. |
Statistically significant reductions in plasma glucose levels were observed in the Qigong group (184.9 ± 35.3 vs. 161.9 ± 40.5 mg/dl, P= 0.003 by paired t test). Both the PRT group and the control group increased plasma glucose levels over time (143.8 ± 35.0 vs. 154.0 ± 44.7 and 156.4 ± 36.6 vs. 168.4 ± 49.1 mg/dl, respectively; not significant [NS]). Fasting glucose of the QG group significantly improved compared with that of the PRT group and the control group (P < 0.003 and P < 0.001, respectively, by one-way ANOVA). A1C remained unchanged in the control group during the intervention (7.9 ± 0.8 vs. 7.9 ± 1.6%) but declined slightly in both the PRT group (8.6 ± 1.2 vs. 7.9 ± 1.6, NS) and the QG group (8.8 ± 1.1 vs. 8.1 ± 1.3, NS). Fasting plasma insulin levels increased slightly in both the PRT group (24.3 ± 28.8 vs. 30.2 ± 39.9, NS) and the control group (12.6 ± 4.6 vs. 20.1 ± 10, P = 0.08) but remained unchanged during the intervention in the Qigong group (13.3 ± 6.2 vs. 13.4 ± 5.7, NS). |
Youngwanichsetha et al., 2013 [96] |
RCT |
64 |
Thailand |
M35SDD 5.6 |
NA |
None |
TCQ |
Participants were randomly assigned to an intervention group (n=32) and control group (n=32). Participants in the intervention group practiced a 50-min tai chi qigong exercise program, three times a week for 12 weeks during the period of 3–6 months postpartum. Control group received usual care. |
To investigate the effect of tai chi qigong exercise on plasma glucose levels and health status of postpartum women with type 2 diabetes. |
A statistically significant reduction in fasting plasma glucose, glycosylated hemoglobin and blood pressure were seen in the intervention group when compared with the control group (P<0.05) at 12 weeks. Mean fasting plasma glucose in the intervention and control groups at 12 weeks were 120.19 (SD)=17.51) mg/dl and 129.88 (SD=15.23) mg/dl, respectively. There were no significant between-group differences in body-weight or body-mass index at trial completion. |
Lee et al., 2004 [47] |
RCT |
32 |
Korea |
Experiment: 30.5
±
5.9; control: 31.2
±
7.3 |
|
|
CDSB |
Double blinded; 32 participants were randomized to a QG training group (25 min exercise; 15 min movement; 20min meditation) and a sham QG control group who performed the same movements without gathering or moving Qi. Blood sampling was completed
within 30 s and subjects rested for 10 min before
the experiment began. |
To assess plasma concentrations of ACTH, cortisol, and
Aldosterone of QG practice |
Paired t-tests show after Qi-training, the plasma concentrations of ACTH, cortisol, and aldosterone decreased, but these levels did not change in the control group; For the ACTH level, there were significant effects of group [
F(1, 30) =6.3,p<0.05] and time [F(1, 30)
=4.6, p<0.05] and group x time interaction [
F(1, 30) =7.9, p<0.01]. For the cortisol level ,there were significant effects of time [F(1, 30) =4.7, p<0.05] and group
X time interaction [F(1, 30)=10.5, p<0.005], but no significant effect of group. For the aldosterone level (Figure 1C),there were significant effects of time [F(1, 30)
=6.7, p<0.05] and group X time interaction [F(1,30) =10.9, p<0.005], but no significant effect of group |
Iwao et al., 1999 [97] |
RCT |
10 |
Japan |
54-72, 61 median |
NR |
NR |
NR |
30-40 minute duration, 30 minutes after lunch
CON: Convention walking |
Plasma glucose levels
Pulse rates |
Plasma glucose levels decreased during both exercises (from 228 mg/dL before to
205 mg/dL after conventional walking) and (from 223 mg/dL before to 216 mg/dL after qigong walking). In both situations the results after exercise decreased more than those in the group with no exercise (229 mg/dL; p < 0.025). The pulse rates increased after conventional walking (from 77 to 95 beats per minute; p < 0.025) and were higher than those in the group with no exercise (70 beats per minute; p < 0.01) and those after qigong walking (79 beats per minute; p < 0.05). |
Bilirubin |
Yang and Tao, 2015 [98] (In Chinese) |
OS |
108 |
China |
M=69.8 (7.8), range 51-90 |
54M, 54F |
none |
BDJ |
Participant practice BDJ 5-7 times per week, 35-40 minutes each time, last for 6 months. TBIL,DBIL and IBIL[6] were tested before and after the intervention |
To investigate the effect of BDJ on bilirubin level of type 2 diabetes patients |
After 6 months of intervention, TBIL, DBIL and IBIL improved significantly.
TBIL: 13.6 ± 5.4 vs. 20.1 ± 7.2, p<0.01
DBIL: 3.5 ± 1.8 vs. 4.1 ± 2.1. p<0.01
IBIL: 10.1 ± 3.9 vs. 15.8 ± 5.3, p<0.01 |
Inflammatory Markers |
Oh et al., 2010 [99] |
RCT |
162 |
Australia |
QG M: 60.1 (11.7); CON M: 59.9(11.3) |
QG M:31, F48; CON M38, F45 |
NR |
Modified from traditional QG |
Patients with a range of cancer were recruited.
QG: medical QG plus usual care, N=54, duration 10 weeks, 2 supervised 90 min session each week
CON: usual medical care, N= 83
Measured at baseline and at 10 weeks post-intervention |
To evaluate the use of Medical Qigong compared with usual care to improve inflammation (Serum CRP) of cancer patients. |
QG group significantly improved inflammatory marker serum C-reactive protein (CRP) (t99 = 2.042, P < 0.044) compared with usual care after controlling for baseline variables. Mean difference between groups: -23.17(-37.08-.9.26) |
Oh et al., 2008 [100] |
RCT |
30 |
Australia |
Age 35-75, M=54 (9) |
8M22F |
NR |
Modified from traditional QG |
Patients with a range of cancer were recruited.
QG: medical QG plus usual care, N=15, duration 8 weeks, 2 supervised 90 min session each week
CON: =15 usual medical care |
To evaluate the use of Medical Qigong compared with usual care to improve inflammation (Serum CRP) of cancer patients |
The QOL change scores from pre- to post-Medical Qigong intervention group were significant for global quality of life (student t = −3.989, p = 0.005), cognitive function (student t = −2.646, p = 0.033) and social function (student t = −2.393, p = 0.048), but non-significant for physical function (student t = −1.000, p = 0.351), role function (student t = −0.447, p = 0.668), and emotional function (student t = −1.843, p = 0.108) |
Salivary Biomarkers |
Chan et al., 2013 [101] |
RCT |
34 |
Singapore |
NR |
NR |
NR |
NR |
QG was practiced twice a week by the study group (n = 18) while a control group (n = 16) had no intervention. |
To measure stress reduction by salivary biomarkers |
Increases in secretion rates of salivary immunoglobulin-A, and decreases in salivary cortisol concentrations were seen only in the Qigong group
|
Sousa et al., 2012 [102] |
Prospective Controlled Intervention |
16 |
Portugal |
QG M=11.5, SD=0.7; CON: M=12, SD=0.0 |
NR |
None |
WQ |
QG was practiced over seven weeks, twice a week, for 30 min with a waiting list design and instructions to perform the same exercises at home daily. Control group: wait-list design |
To understand performance-related anxiety and physiological stress functions |
Heart rate: QG group decreased (107.0 ± 21.8 to 96.0 ± 18.9; M= -11 ± 7) and increased in CON group (81.0 ± 9.5 to 86.0 ± 7.2; M=5 ± 9); p<0.01.
Salivary cortisol levels: Both QG (5.46 ± 1.51 to 2.82 ± 1.58’ M=-0.265 ± 0.165) and CON (4.56 ± 5.00 to 3.21 ± 3.91; M=-0.132 ± 0.306) decreased; difference not significant (p=0.282) |
Chow et al. 2012, [103] |
OS |
68 |
HK |
M=44.2. SD=11.0 |
23M, 45F |
None |
CMG |
The changes in outcomes over four repeated measures: pretest (week 1), midway (week 4), posttest (week 8), and follow-up (week 12). Salivary cortisol was assayed using ELISA kit. Data collection was done in the morning. The subjects were required to rest for 15–20 min before blood pressure and heart rate were taken. Then, they were given standardized questionnaires to complete. After that, salivary samples were collected. |
To measure stress reduction by salivary biomarkers and blood pressure |
T-test results show QG group had significantly lower systolic (F[1,63]=4.08, p=.048) and diastolic blood pressure (F[1,63]=4.37, p=.041) than the wait list control group after 8 weeks of qigong intervention In week 12, with increased significant levels and effect sizes, the qigong group experienced lower systolic blood pressure (F[1,63]=6.59, p=.013), diastolic blood pressure (F[1,63]=4.49, p=.038), and lower cortisol levels (F[1,62]=15.91, p |
Bayat- Movahed et al., 2008 [104] |
OS |
23 |
Iran |
22-24 |
10M13F |
None |
YQG |
The unstimulated saliva volume and pH were recorded every week in Spring (April, May, June) 2005 before the volunteers started to learn and exercise Qigong, and after Qigong intervention in Spring (April, May, June) 2006.Parameters of unstimulated saliva, including volume, pH and secretory immunoglobulin A (S-IgA) level |
To measure effects of a Qigong program on various salivary parameters |
The unstimulated saliva volume after Qigong exercises (2.94d0.20 mL/5min) was significantly higher as compared to the pre Qigong phase (1.65d0.102 mL/5min, P. The saliva pH was 7.116d 0.137 for the measurements and 6.980d0.087 for the second measurements, and the difference was not statistically significant. The level of salivary S-IgA was 105.45 d69.41 mg/mL for the first measurement and 156.23 d 88.56 mg/mL for the second measurement, which showed a statistically significant difference between the two measurements of salivary S-IgA (P=0.005). |
Immune Parameters |
NK Cells |
Lee et al., 2003 [59] |
RCT |
60 |
Korea |
Intervention: 37 ± 12; Control: 35 ± 17) |
NR |
None |
CDSB |
Double blinded- Participants were randomized to a Qi-training group (who performed Qi-training; n = 30) and sham QG control group (who
performed the same motions without gathering or moving Qi; n = 30). Immune cell numbers were measured pre-intervention, immediately post-intervention and 1 or 2 hours post-intervention
|
To compare sham QG (placebo: without intention of gathering or moving
Qi) with real QG to investigate the effects of QG on immune cells, including NK , neutrophils, lymphocyte |
Paired t-tests show that White blood cells increased significantly 2 hours after actual QG (Pre: 5.68 ± 1.36; post: 5.67 ± 1.32 ; 2-hr post: 6.12 ± 1.29; p < 0.05) but not sham training compared with pre-intervention. There were significant increases in lymphocytes 2 hours after actual but not sham QG (pre: 2.05 ± 0.52; post: 2.04 ± 0.51; 2-hr post: 2.20 ± 0.52; p < 0.05) and monocyte numbers were significantly increased immediately after both actual QG (pre: 0.44 ± 0.26 ; post: 0.67 ± 0.51; 2-hr post: 0.44 ± 0.16; p < 0.01) and sham training (pre: 0.40 ± 0.08; post: 0.44 ± 0.12; 2-hr post: 0.45 ± 0.11p < 0.05). NK cell numbers decreased significantly both immediately after QG and after sham movements done without concomitant Qi-training (p < 0.01). There were no significant effects on neutrophils. |
Yu et al., 2008 [105] (In Chinese) |
RCT |
100 |
China |
QG M=46, CON M=50 |
QG 12M, 34F.
CON 15M, 35F |
None |
WQX |
NK cell activity was tested at the beginning of the intervention and after the intervention.
QG participants practice QG at least 4 times a week, 30 minutes each time for 6 months. Con: Daily life were kept as usual |
To explore the effect of WQX exercise on NK cell activity of senior adults |
Compared with control group, there’s a statistically significant improvement of NK cell activity among intervention group.
Male:
29.04 ± 11.46 vs. 24.64 ± 8.43
Female:
27.86 ± 15.65 vs. 21.44 ± 7.78 |
Vera et al., 2015 [106] |
RCT |
43 |
Spain |
18-21 |
9M 34F |
None |
DQ |
25 participants were randomly allocated to the experimental group and 18 to the control group. The experimental subjects underwent daily qigong training for 1 month. Blood samples for the quantification of immune parameters (number and percentage of monocytes, neutrophils, eosinophils, total lymphocytes, B lymphocytes, and natural killer (NK) cells) were taken the day before the experiment commenced and 1 h after the last session of the training program ended. |
To examine acute effect of QG on the counts of innate and adaptive immune cells in human peripheral blood after 1 month of QG practice |
After 1 month: Differences were found between the experimental and control groups, with the experimental group showing higher NK cells values (234.62 cells/μl) compared to control group (195.51 cells/μl) in the number (p = 0.006) and the percentage (10.72% vs. 9.40%; p = 0.04) of B lymphocytes, as well as lower values in the percentage of NK cells (16.26% vs. 18.96%, p = 0.05), as compared to control. |
Lee et al., 2005 [107] |
RCT |
18 |
Korea |
Experiemental: 26.8 ± 1.2; control: 26.1 ± 1.7) |
M |
None |
CDSB |
9 experimental subjects did 1 h of QG under a master; consisted of 10 min resting, 15 reciting; 15 slow movement; 20 meditation, and 9 control participants relaxed during the same time; not required to do anything. Blood was drawn 10 min before
QG, within 10 min of the end of QG, and 2 h after QG. Human peripheral blood was obtained by venipuncture using heparinized syringes |
To access acute effect of QG on natural killer cell (NK) and cytotoxic activity |
For cells incubated for 4 h,
there was a significant main effect of time [
F(2,32) = 3.4, p= .046]and time × group interaction [F(2,32) = 6.3, p= .005], but no significant group effect. For cells incubated for 16 h, only the time ×group interaction was significant [F(2,32) = 4.5, p= .019]. NKCA
Increased significantly after Qi-training. Immediately after training, cytotoxic activity was 80% above control values in the cells incubated for 4 h, and 60% above control values in cells incubated for16 h. NK cell cytotoxicity and NK cell number were not significantly correlated (r= .272, p= .17) in the QG group |
Jung et al., 2006 [108] |
OS |
24 |
Korea |
QTNM: 25 ± 5; QTT-M: 26 ± 3 |
M |
None |
CSEH External Qi |
Participants were randomized into QTN- received external Qi without touching (N=12) or QTT- received Qi with touching (N=12). Hormone assays including serum levels of cortisol and melatonin are collected. Immunological function including neutrophils and NK cell are measured. Participants are measured pre (10 min before), post I (10 min after) and post II (1 hour after) qi therapy. |
To examine whether there are differences between QG healing touching and non-touching in hormone assays and immunological function |
Nonparametric statistical tests revealed no significant differences between the effects of QTN and QTT (all p > .05). Separate Wilcox signed rank tests showed that: Cortisol (g/dl): QTN Pre 7.4(6.1-8.5), post I 5.8 (5.4-7.2), post II 4.4 (4.1-5.6); p<0.001; vs. QTT 7.2 (5.9-7.8), post I 7.1(6.0-7.5), post II 5.0(4.6-5.7). Melatonin (pg/ml) QTN: pre 7.2(5.9-7.8), post I 7.1 (6.0-7.5), post II 5.0 (4.6-5.7), p=0.039. Superoxide generation (107 cpm) QTN: pre 3.7 (2.9-4.1), post I 4.3(3.4-5.4), post II 3.5 (2.9-4.3), p<0.001. QTT pre 3.5 (2.7-3.6), post I 3.4 (2.9-4.0). post II 3.2 (2.7-3.9). P>0.05. NK Cell (%) QTN pre 44.2 (40.5-51.1), post I 66.9 (54.2-78.6), post II 49.9 (45.0-61.3), p<0.001 QTT pre 44.8 (37.3-58.1), post I 55.9 (46.5-70.5), post II 49.4 (40.6-52.8), p<0.01 |
- Growth Harmone |
Lee et al., 2005[57] |
OS |
10 |
Korea |
M=66
SD=3 |
NR |
None |
CDSB |
1-hour QG practice; comprised resting for 10 min,
followed by three kinds of exercise: sound recitation for 15 min, slow motions for 15 min, and meditation for 20 min. Peripheral blood was drawn
from the median cubital vein before QG (Pre) and after the QG(Post) |
To examine effects of QG on immune function and neurohormone concentrations |
Significant increase in growth hormone (GH) after 1 h QG compared with the Pre samples (Pre: 0.38 ± 0.9 ng/ml; Post: 0.66 ± 0.8,
p< .01). After 1 h QG, O2− generation was significantly higher than the Pre level (Pre: 4.57 ± 0.48 ng/mL; Post: 5.97 ± 0.49, p< .05), but no change in the number of neutrophils was observed in the peripheral blood. A significant increase in the O2−production of production by neutrophils (PMN) incubated with the serum collected after Qi-training was observed (p< .05) compared with pre- training serum. |
Lee et al., 1999 [109] |
OS |
26 |
Korea |
Older age group: M=59.86+- 1.92, Younger age M=26.58+-1.03 |
14M, 12F |
>0.6 year of experience |
CDSB |
10 ml blood was drawn at pre (10-min before training), mid (before meditating), post-training |
To observe the response of plasma growth hormone (GH), insulin-like growth factor-I (IGF-I) and testosterone (T) to an acute period of ChunDoSunBup (CDSB) Qi-training. |
Although the basal level of GH was not different between the two groups, after the portion of the training in which the subjects were physically active (the mid-training point), plasma GH levels increased by 7.26 fold (p < 0.05) in the elderly trainees and by 1.66 fold (p < 0.05) in the young. In response to CDSB Qi-training, IGF-I levels in the young increased significantly at mid-training point, but there were no increase in the elderly. Significant correlations existed between GH and IGF-I levels in the young subjects, but not in the elderly. The T level at the mid-training point increased significantly in elderly subjects but not in the younger age. |
Ryu et al., 2000 [58] |
OS |
16 |
Korea |
M=29; contrl M=26 |
M |
>6 months experience |
CDSB |
10 participants in QG, 6 in sedentary comparison group. Blood was drawn at rest, pre-time of Qi-training [that is 10 min before Qi-training (210 min)], at 40 min (the mid-time of Qi-training, the time between motions and meditation), and immediately after the Qi-training [within 10 min (+10 min)] |
To examine the acute effect of QG on the plasma level of growth hormone (GH), insulin-like growth factor (IGF)-I and insulin like growth factor |
The plasma level of GH at the mid-time (40 min) has significantly increased (2.16+0.48 ng/ml, P,0.05) compared to the level at pre-time of QG (1.26 ± 0.37 ng/ml). The plasma level of IGF-I was significantly increased at the mid-time (286.40 ± 15.97 ng/ml) compared to the pre-time of Qi-training (245.57 ± 13.90 ng/ml, p<0.05) There was a significant correlation between the levels of GH and IGF-I immediately after Qi-training (r=0.69, P,0.01). There was a relative shift in IGFBP-3 for the 43-kDa fraction during mid-time of Qi-training (P,0.05) |
- Cytokines |
Manzaneque et al. 2009, [54] |
RCT |
39 |
Spain |
18-21 |
5M34F |
None |
BDJ |
Experimental participants were submitted to a QG training program consisting of three group 30-min session a week of one month. Control participants were not required to do anything in particular |
Assess the effects of qigong practice on serum cytokines, mood and subjective sleep quality |
The practice of QG for one month did not alter serum cytokines. Cytokines TNF-α〈 (pg/ml) for control group was 1.89 and IFN-γ (pg/ml) was 10.40. For intervention group CTNF-αwas 1.90, IFN-γ was 10.10. p value was 0.99 and 0.81 respectively. |
- Others |
Ryu et al., 1995 [110] |
OS |
65 |
Korea |
20-50 |
M |
Various |
CDSB |
Group1 had QG training for 1-4 month (N=12), G2 5-12 months (N=21), G3 13-24 months (N=17), G4 >25 months (N=12). There is also control group (N=13) |
To examine the effect of Qigong training on proportions of T lymphocyte subsets was investigated in human peripheral blood
|
Two-tailored students t-test and ANOVA tests were used. Participants in G1 (2.19 ± 0.29), G2(2.41 ± 0.16), G3(2.38 ± 0.21) and G4 (2.39 ± 0.26) had higher ratio of CD4+/CD8+ T lymphocytes than control group (1.64 ± 0.14). The ratio of CD4+/CD8+ T lymphocytes was increased 50% in a trainee group who practiced Qigong training more than 5 months compared to a normal healthy group who did not practice. The absolute number of CD4+ T lymphocytes was also elevated in trainee group with 100 cells/mm3 more than in normal healthy group. |
Yao et al., 1989 [111] |
OS |
23 |
China |
M=32(14-69) |
8M5F |
None |
Various |
10 in QG group who do 1-hr daily more than 1 month, combing 5 QG: breathing, stepping, meditation, kidney-enhancement. Control: patient aplastic anemia without QG practice |
To understand the changes of T-cell with QG practice in patients with aplastic anemia |
QG participants Th and the ratio of Th/Ts were greatly elevated than those without Qigong treatment (Leu 3n+: QG 38.3 ± 6.7, CON 29.1 ± 9.1, p<0.02; Leu 3n+/leu 2a+ QG 1.18 ± 0.41, CON 0.77 ± 0.29, p<0.02) |
Ryu et al., 1995 [112] |
OS |
28 |
Korea |
20-45 |
NR |
None |
CDSB |
12 in control group and 16 in QG group |
To observe the difference between cell mediated immunity (CMI) through skin testing between QG and non QG group |
Skin testing shoes the number of responded antigens and the size of induration in the positive skin test was different in QG group to control group; maximun response of QG group peaked at 24 hr vs. 48 hr for control group. Using student’s t-tests, among antigens, maximum response against Trichophyton mentagrophyte (QG:90.4 in 24hr. 75.0 in 48 hr, 57.1 in 72 hr vs. CON 18.2 in 24hr, 16.7 in 48 hr, 12.5 in 72 hr) and candida albicans (QG:72.7 in 24hr. 72.7 in 48 hr, 100.0 in 72 hr vs. CON 18.2 in 24hr, 33.3 in 48 hr, 37.5 in 72 hr) were higher in QG in than control. QG group had larger duration size than control (p<0.05) |
Blood Cells and Antioxidant Capacity |
Yeh et al., 2006 [48] |
QED/CCT |
67 |
Taiwan |
<39:12, 40-49:27, >50: 28 |
F |
None |
CCQG |
All breast cancer patients about to undergo first chemo; 32 in experiment receive 21-day QG therapy, 35 in control did not. White blood cells, platelet, and hemoglobin were measured on the day before chemotherapy and on days 8, 15, and 22 during chemotherapy |
To examine the effects of QG on complete blood counts in breast cancer patients treated with chemotherapy |
T-Test results show there were significant differences over the 3-week therapy in white blood cells between experiment grop and control group in white blood cells (QG Baseline:5820 microliters, W1:3580, W2:1955, W3:5356. CON B: 6166, W2: 3661, W3:1955, W4:6236. F = 115.76, P<0 .001), platelets (QG Baseline: 246,228 microliters, W1: 194,523, W2: 217,222, W3: 312,000. CON: Base: 263,687, W1:189500. W2:217,600, W3:356,000. F = 25.29, p<0 .001), and hemoglobin (QG-Baseline: 12.36, W1: 11,44, W2:11,32, W4:12.09; CON- B:12.75, W1:11.89, W2:11.42, W3:12.34. F = 15.39, P <0.001) |
Wu et al., 2011 [113] |
CCT |
55 |
China |
M: 55-61, F:50-60 |
33M, 22F. |
NR |
WQX |
Obese older adults practiced QG for 2 hr everyday for a year. Measures taken once every three months. MDA, TC, TG, LDL-c and HDL-c levels, SOD, CAT, GSH-Px activities were measured |
To examine the effect of QG on antioxidant enzymes activities, lipid peroxidation level, intestine probiotics in obese old people |
MDA: 3month 6.87 ± 0.34; 6M 6.01 ± 0.24*, 9M: 5.21 ± 0.19**,12M 4.48 ± 0.22**,
TC (mmol/ml): 3M 3.52 ± 0.04, 6M 3.15 ± 0.07*;9M 2.82 ± 0.06**, 12M 2.61 ± 0.05**
TG 3M 0.72 ± 0.03,6M 0.64 ± 0.02**, 9M 0.55 ± 0.01**, 12M 0.43 ± 0.02**
LDL-c 3M0.57 ± 0.02, 6M 0.51 ± 0.03*, 9M 0.46 ± 0.01**, 12M 0.38 ± 0.01**
HDL-c 3M1.23 ± 0.06, 6M 1.54 ± 0.04**, 9M 1.78 ± 0.08**, 12M 2.04 ± 0.05**
Bacillus acidophilus 3M 5.25 ± 0.12, 6M 5.92 ± 0.09, 9M 6.93 ± 0.08**, 12M 7.48 ± 0.07**
Lactobacillus casei 3M 4.02 ± 0.09, 6M 5.06 ± 0.08**, 9M 5.72 ± 0.06**, 12M 5.99 ± 0.07**
Bacillus bifidus 3M 8.12 ± 0.09,6M 9.81 ± 0.08*, 9M 10.79 ± 0.37**, 12M 11.61 ± 0.14** p value: compared with 3 month as control.
*: p<0.01, **:p<0.001 |
Hormones and Thyroid Hormones |
Kim et al., 2013 [114] |
OS |
20 |
Korea |
NR |
F |
NR |
NR |
An experimental group and a control group were randomly organized with 10 women respectively, and QG training was provided three times a week during a 12-week period of time |
Body composition and aging-related hormone |
Decrease of their body fat mass and body fat percentage, and the increase of their growth hormone and estrogen. |
Ryu et al., 2006, [55] |
OS |
20 |
Korea |
M=28 |
NR |
Yes |
CDSB |
Various forms of stress influence the balance of HPA axis in men. Blood was drawn at pre (-10min), mid (40 min), post (70min) of training. Plasma was collected. |
To examine the plasma level of beta-endorphin, ACTh cortisol, and DHEA-S response to Qi training |
Plasma cortisol and DHEA-S during mid training were not different from the pre-training (p>0.05). The plasma level of beta-endorphin during mid-time of qi training (25.08 pg/ml) has increased compared to pre-training (11.21 pg/ml)(p<0.05) |
Moon et al., 2004 [115] |
OS |
25 |
Korea |
26-29 |
M |
NR |
CDSB |
16 men participated in a study of neuroendocrine effects of Qi-training, and nine healthy young men participated in a study of the immunological effects. Nine men volunteered to draw the blood sample for in vitro experiment of growth hormone on neutrophil responses. Blood was drawn before Qitraining [Pre, that is 10 min before Qi-training] and immediately after the Qi-training [Post, within 10 min (+10 min)]. |
To examine the effect of Qi-training on the plasma levels of GH and IGF-I, and investigate the immunological effects of Qi training by neutrophils’ superoxide generation, and adhesion capacity |
The plasma GH level was increased after Qi-training compared to pre Qi-training (p < .01). The plasma level of IGF-1 was significantly increased after Qi-training (p < .05). Superoxide generation was significantly enhanced after Qi-training compared to before Qi-training (p < .01). The adhesive capacity of neutrophils was significantly enhanced after Qi-training (p < .05). Significant priming of human neutrophils by GH was observed at 10 ng/ml (p < .05), 100 ng/ml (p < .01), and 250 ng/ml (p < .05). According to the dose-response curve, we selected one submaximal dose as 250 ng/ml (p < .05). |
M. S. Lee et al. [51] |
OS |
15 |
Korea |
M= 60.93 (2.37), age range 49-81 |
10M, 5F |
Mean 1.98 (0.21), 1-3 years of training |
CDSB |
Blood drawn 10 min before training, before mediation, and post-training
1 hour of qi-training (10-min rest, 15 min sound recitation, 15 min slow motions, 20 min mediation) |
Investigate how systemic treatment of CDSB on hormones on elderly subjects |
1) T3 concentrates increased (1.84 ± 0.07 to 1.93 ± 0.07 to 1.99 ± 0.07 nmol/l, p<.05) at pre-, mid-, and post-training.
T4 concentrates increased (92.43 ± 5.68 to 99.8 ± 5.7 nmol/l, p<.05) between pre- and mid-training
2) No significant differences in TSH (1.10 ± 0.20 to 1.16 ± 0.21 to 1.24 ± 0.22 uUI/ml), Calcitonin (7.41 ± 0.55 to 7.80 ± 0.63 to 8.24 ± 0.87 pg/ml), Calcium (8.99 ± 0.27 to 9.16 ± 0.21 to 8.54 ± 0.18), and pH (7.88 ± 0.03 to 7.86 ± 0.02 to 7.89 ± 0.02) at pre-, mid-, and post-training |
Matabolism and Immune Functions |
Lee et al., 2003 [116] |
OS |
9 |
Korea |
M=26 ± 4 |
9M |
Age 26 ± 4 |
CDSB |
Subjects were studied for the effects of one bout of ChunDoSunBup (CDSB) Qi-training on superoxide (O2- production and adhesion capacity of neutrophils at times immediately after (Post I) and 2 hours after the Qi-training (Post II). |
To examine the effect of Qi-training on the immune system, especially neutrophil bactericidal function |
The Qi-training enhanced superoxide (O2- production), reaction velocity and neutrophil adhesion capacity and there were significant differences at Post I compared to before Qi-training (Pre). In addition, the number of white blood cells (WBC), monocytes and lymphocytes were changed significantly through Qi-training.
Significant effects of Qi-training on reaction velocity [F(2, 16) = 4.95, p = 0.02] and neutrophil adhesive capacity [F(2, 16) = 3.92, p = 0.04]. There were significant increases in the number of WBC [F(2, 16) = 11.27, p < 0.001], monocytes [F(2, 16) = 14.31, p < 0.001] and lymphocytes [F(2, 16) = 4.6, p = 0.026] after Qi-training. |
Manzaneque et al. 2004 [60] |
RCT |
29 |
Spain |
18-21 |
14M
15F |
None |
BDJ |
16 were allocated to the experimental group and the rest to the control group. The experimental subjects underwent a qigong training program, conducted by a qualified instructor, consisting of half an hour of daily practice for one month. The day before the experiment commenced and the day after it f nished, blood samples were drawn from all subjects for the quantify cation of immunological parameters |
To analyze the effects of a qigong program on various immunological parameters; including the number of leukocytes, the percentages of leukocytes , as well as the concentrations of immunoglobulins and complement |
A between-group analysis of covariance (ANCOVA) was performed. After one month of practicing QG, significant immunological changes in Leucocytes (x103 cells/ul)(QG:5.66, CON:6.73, p<0.05), Monocytes (x103 cells/ul)(QG:0.45, CON:0.60, p<0.05), Eosinophiles (x103 cells/ul)(QG:0.19, CON:0.29, p<0.05), Monocytes (x103 cells/ul)(QG:7.84, CON:9.05, p<0.05), with a consistently lower and broadly significant profile of these measures within the qigong practitioner group.
|
Huang et al., 2005 [117] (In Chinese) |
CTs |
44 |
China |
45-65 |
21M, 23F |
none |
BDJ |
Participants practice BDJ 7 times per week, each time last for 50 minutes. Last for 10 weeks. During the intervention periods, participants keep a normal lifestyle. |
To investigate effect BDJ on the related indexes of free radical metabolism, including nitricoxide, malondialdehyde and superoxide dismutase |
After 10 weeks of intervention, there shows a trend of improving in each groups of participants.
There’s a significant reduce in malondialdehyde level for elderly female group. 3.59 ± 0.45 vs. 4.15 ± 0.68 p<0.05
There’s a significant improvement in nitric oxide level and superoxide dismutase level for elderly male.
NO: 558.374 ± 243.91 vs. 471.13 ± 168.12 p<0.05
superoxide dismutase:
1.75 ± 0.17 vs. 1.49 ± 0.22 p<0.01 |
Yang et al., 2007 [61] |
RCT |
50 |
U.S. |
M=77.2
SD=1.3 |
NR |
None |
NR |
Intervention group (TQ) of particpants = 27; wait-list control (CON) N = 23. Baseline pre-vaccine blood samples were collected. All subjects then received the 2003–2004 influenza vaccine during the first week of the intervention. Post-vaccine blood samples were collected 3, 6 and 20 weeks post-intervention for analysis of anti-influenza hemagglutination inhibition (HI) titers.
|
To test whether 5 months of moderate Taichi and Qigong practice could improve the immune response to influenza vaccine in older adults
|
Sgnificant increase in the magnitude and duration of the antibody response to influenza vaccine in TQ participants when compared to CON (p < 0.05). The vaccination resulted in a 173, 130, and 109% increase in HI titer at 3, 6, and 20 weeks post-vaccine, respectively, in the TQ group compared to 58, 54, and 10% in CON. There was a significant between group difference at 3 and 20 weeks post-vaccine and at 20 weeks the TQ group had significantly higher titers compared to the pre-vaccine time point, whereas the CON group did not. |
Nervous System |
Lu et al., 2006 [118] |
QED |
90 |
Taiwan |
TCC: 53.0 (41-71); WTK: 58.5(48.0-70.0); Control: 56.5 (32-72) |
TCC: 14M16F; WTK: 12M18F; Control: 7M23F |
TCC: 2.0yr experience; WTK: 2.3 yr experience; Control: 0 yr |
WTK |
Participants were divided into non-exercising control (N=30), TaiChiChung (TCC) practitioners (N=30) and WaiTanKung (WTK) practitioners (N=30). TCC: 40 min in duration (10 min warm up,20 min exercise, 10 min cool down), WTK: 40 min in duration (5 min warm up, 30 exercise, 5 min relaxing). The resting standard 12-lead ECG , arterial blood pressure measurement were performed on each subject before TCC or WTK
with the subject lying in supine position was performed on each
subject before TCC or WTK in standing position. Measurements took place 30 and 60 minutes after exercise
|
To compare the effects of TCC and WTK on autonomic nervous system modulation and on hemodynamics |
Kruskal-Wallis one-way analysis of variance on ranks was utilized. Comparing 30 and 60 min afterWTK and TCC :The mean RRI (RR intevals) (WTK 30 min: 0; 60 min:6; TCC 30min:3; 60 min:6; p<0.05), SDRR (Standard deviation of RR) (WTK -4%: 0; 60 min:2%; TCC 30min:0%; 60 min:13%; p<0.05), and HFP (high frequency power) significantly increased (WTK 30 min: 21; 60 min:47; TCC 30min:27; 60 min:35;p<0.05), whereas the heart rate (WTK 30 min: 0.2; 60 min:-5.4; TCC 30min:-2.7; 60 min:-5.7; p<0.05), and VLFP (normalized very low frequency power) decreased (WTK 30 min: -18.5; 60 min:-21.6; TCC 30min:2.8; 60 min:-21.2). There were no significant differences (p>0.05) in the percentage changes in HRV measures and hemodynamics between WTK and TCC practitioners 30 and 60 min after exercise, indicating that the effects of WTK and TCC were similar in magnitude
|
Lu WA et al., 2003 [119] |
QED |
40 |
Taiwan |
WTK: 58. 1 ± 5.9, CON: 55.9 ± 8.3 |
14M26F |
WTK: 5.6 ± 6.0 yrs, CON: 0 |
WTK |
20 in WTK, 20 in control goup |
To evaluate the effect of WTK on autonomic nervous modulation in the elderly |
The stationary state spectral heart rate variability (HRV) measures, hemodynamics, and spirometry between the WTK group and normal controls and sequential changes in HRV measures and hemodynamics after WTK were compared, using Mann-Whitney rank sum tes. We found that the standard deviation and coefficient of variation of RR intervals, total power, low frequency power (LFP), and normalized LFP (nLFP) in WTK practitioners before WTK were all significantly higher than those of normal controls. After WTK, the normalized high-frequency power increased (nHFP) significantly from 27.7 +/- 13.2 normalized units (nu) before WTK to 37.6 +/- 16.0 nu 30 min after WTK, and to 39.8 +/- 20.1 nu 60 min after WTK. In contrast, LFP/HFP decreased significantly from 1.3 +/- 1.0 before WTK to 1.0 +/- 0.9 30 min after WTK and to 0.8 +/- 0.6 60 min after WTK. |
| |
|
|
|
|
|
|
|
|
|
|
|
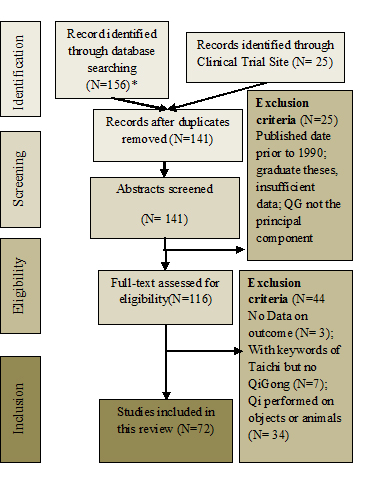 Figure 1. Literature Selection Flow Chart