Abstract
Introduction: The authors had both observed incidences of flaws in CPR in the EMT and Paramedic community and decided to measure the quality of a significant number of people to determine the prevalence and magnitude of these shortfalls.
Materials/Methods: Forty-four EMT’s and Paramedics employed by ambulance services were randomly selected and tested to learn the quality of CPR they could perform. The testing was designed to measure each subject’s ability to perform chest compressions at the proper rate, the extent to which full recoil was achieved, and the amount of force each subject could generate on the down-stroke.
A Force Meter was used to measure the force-generation capability of each subject and to measure leaning, rate, and interruptions. This meter displays the force data graphically while the trial is being run. The digital data from that trial is saved, but the identity of each subject and their Emergency Medical Service is not. This data, coupled with the Philips chest stiffness data, permit the estimation of the percentage of adults upon whom the subject can perform guideline-compliant chest compressions (“GC3’s.”) This data also supports the calculation of the instantaneous frequency and the detection of “leaning.”
Results: The vast majority (more than four out of five) of the test subjects failed to perform GC3’s due to either “leaning” (the application of excessive residual sternal force at the top of the “full recoil” stroke), or to excessive rate, or to a combination of these factors. Some subjects were not able to perform CG3’s on a chest of average stiffness, a stiffness that requires that a force of 130 pounds be applied to attain a two-inch compression depth.
Conclusions: We believe that the problems of chest compression and of hyperventilation can be solved by the solutions derived from the root cause analysis and proposed solutions below.
Introduction
The AHA guidelines [1] for cardiovascular resuscitation require that the victim be placed on their back on a hard flat surface; that the victim’s chest be compressed between five and six centimeters (2.0 to 2.4 inches) without more than a 10 second interruption every two minutes. The rescuer must remove almost all the compression force from the victim’s chest at the top of the full-recoil upstroke. The rate of compression must remain between 100 and 120 compressions per minutes. Additionally, the victim should be ventilated at a rate between eight and ten ventilations per minute, once intubated.
The measurements made during the trial captured the rate of chest compression, the amount of force generated, the extent each subject failed to achieve full recoil, and the length and number of interruptions. The force data was used in conjunction with the Philips chest stiffness data to calculate the percentage of the adult population on whom that test subject could perform GC3’s. Measurement of the depth achieved on a standard manikin doesn’t reveal much about the capability of a test subject other than a yes / no result that is only valid for their performance on adults whose chest stiffness is equal to or less than the manikin used. That is why the “can they do it?” question was expanded to include “…and on what percentage of the adult population?”
Materials/Methods
A Force Meter (Figure 1A and Figure 1B) was used to measure the force-generation capability of each subject tested and to measure leaning, rate, and interruptions. The Force Meter consists of a PC, a plastic hollow column, a top cap, a heavy-duty spring, and a load cell, connected to the PC. The PC runs software sold by the load cell vendor.
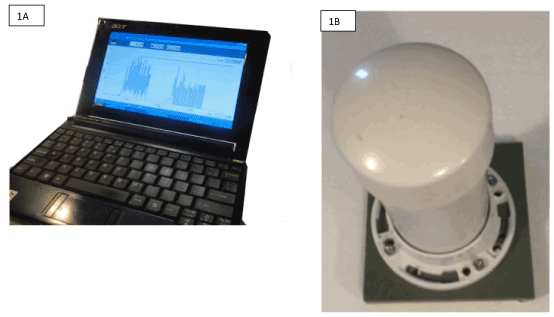
Figure 1. Force Meter (1A and 1B).
The detail of a two-segment trial on the Force Meter screen (Figure 2) shows two trials separated by a coaching session. Note that the left segment trace does not get down to zero pounds. In other words, the subject was leaning until coached. During a subsequent re-testing of a sub-set of the cohort, it was demonstrated that the effect of the coaching was not lasting.
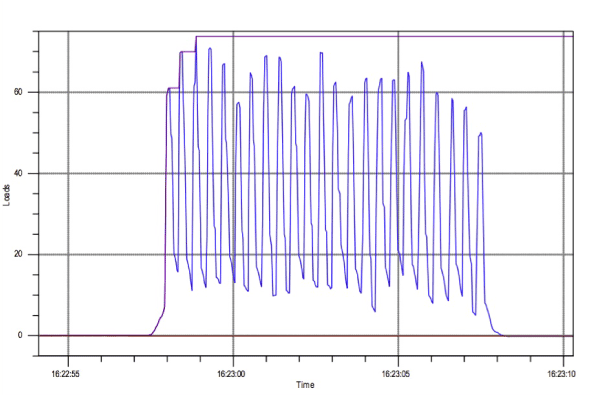
Figure 2. Force Meter screen showing two trials separated by a coaching session.
The distribution of adult chest stiffness reported by the Philips chest stiffness data enabled the authors to construct Figure 3, showing the force required to compress an adult chest and what percentage of the population can be compressed with this level of force.
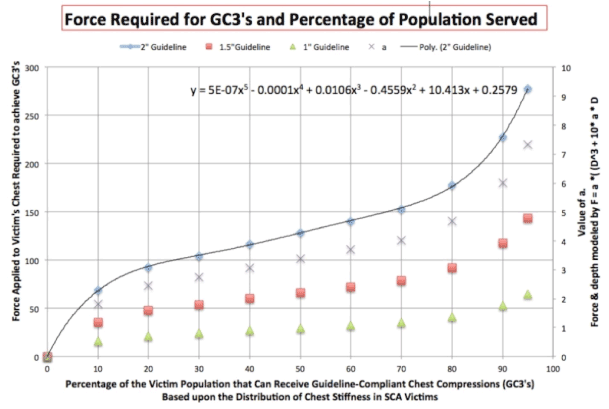
Figure 3. Report showing adult chest stiffness.
Figure 4 illustrates how leaning causes reduced perfusion in the brain, particularly due to an increase in right atrial diastolic blood pressure, a decrease in the cardiac index, and a significant drop in the aortic systolic pressure.
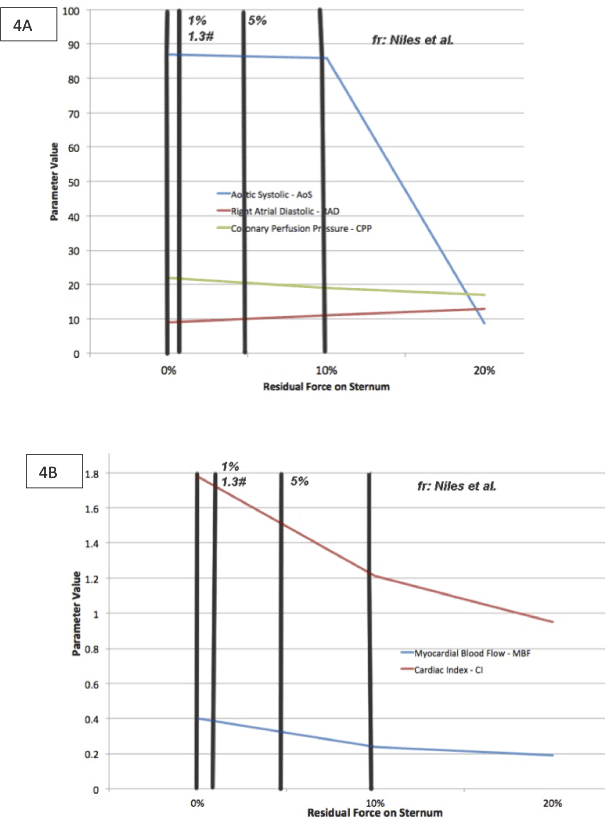
Figure 4. Report showing reduced perfusion in the brain.
All forty-four subjects were either EMTs or Paramedics with an Emergency Medical System at the time of the trial. The force trial was limited to 60 compressions to ensure that we were measuring the subject’s best performance, not one modulated by the subject’s stamina. The results we observed represent the best the subjects could produce.
The data gathered during the trial appears in Table 1. These data show (from left-to-right) a number unique to each participant, a reference number that appeared on the data acquisition form, the compression rate during the 60 compression trial, whether or not the rate was within the guideline limits (100-120 per minute), whether the subject was within the 0 to 1.5 pound “safe” limit for nearly all the compressions, whether there were any interruptions (there were none), the maximum number of pounds of leaning observed, and the minimum number of pounds observed.
Subject |
Data ref |
Rate/min |
Rate OK? |
Lean OK? |
Interrupt OK |
Max # Lean |
Min # Lean |
1 |
221215 |
117 |
Yes |
No |
|
20 |
0 |
2 |
221210 |
119 |
Yes |
No |
|
8 |
0 |
3 |
221155 |
153 |
No |
No |
|
9 |
0 |
4 |
221151 |
125 |
No |
No |
|
25 |
10 |
5 |
221015 |
201 |
No |
No |
|
22 |
5 |
6 |
221010 |
121 |
No |
|
|
0 |
0 |
7 |
221005 |
217 |
No |
No |
|
7 |
0 |
8 |
221000 |
126 |
No |
No |
|
7 |
0 |
9 |
220950 |
152 |
No |
|
|
1 |
0 |
10 |
220945 |
141 |
No |
|
|
0 |
0 |
11 |
211045 |
104 |
|
|
|
0 |
0 |
12 |
211047 |
122 |
No |
No |
|
4 |
0 |
13 |
211025 |
142 |
No |
No |
|
10 |
0 |
14 |
211023 |
164 |
No |
No |
|
22 |
0 |
15 |
211020 |
166 |
No |
No |
|
51 |
2 |
16 |
211015 |
184 |
No |
No |
|
2 |
0 |
17 |
211000 |
129 |
No |
No |
|
22 |
0 |
18 |
210935 |
158 |
No |
No |
|
22 |
0 |
19 |
210930 |
141 |
No |
No |
|
28 |
6 |
20 |
210920 |
122 |
No |
No |
|
20 |
2 |
21 |
201200 |
137 |
No |
|
|
0 |
0 |
22 |
201128 |
128 |
No |
|
|
0 |
0 |
23 |
201127 |
144 |
No |
|
|
0 |
0 |
24 |
201125 |
122 |
No |
|
|
0 |
0 |
25 |
201055 |
162 |
No |
No |
|
3 |
0 |
26 |
201050 |
184 |
No |
No |
|
22 |
0 |
27 |
201040 |
124 |
No |
|
|
0 |
0 |
28 |
201035 |
105 |
|
No |
|
8 |
0 |
29 |
200915 |
129 |
No |
|
|
0 |
0 |
30 |
200910 |
134 |
No |
No |
|
27 |
0 |
31 |
191125 |
145 |
No |
No |
|
3 |
0 |
32 |
191120 |
158 |
No |
|
|
0 |
0 |
33 |
191045 |
122 |
No |
No |
|
18 |
0 |
34 |
191020 |
102 |
|
No |
|
10 |
0 |
35 |
190950 |
135 |
No |
|
|
0 |
0 |
36 |
181730 |
117 |
|
No |
|
36 |
25 |
37 |
181715 |
88 |
No |
No |
|
22 |
0 |
38 |
181700 |
127 |
No |
No |
|
3 |
0 |
39 |
181345 |
120 |
|
No |
|
39 |
6 |
40 |
181045 |
119 |
|
No |
|
35 |
17 |
41 |
171423 |
155 |
No |
|
|
0 |
0 |
42 |
171416 |
146 |
No |
|
|
1 |
0 |
43 |
171310 |
121 |
No |
No |
|
47 |
10 |
44 |
171305 |
182 |
No |
No |
|
10 |
7 |
| |
|
138.9 Avg |
81.8% bad |
68.2% bad |
|
12.8 Avg |
2.0 Avg |
Table 1. Data gathered during the trial
Results
- Chest compression performed by these subjects was convincingly flawed for multiple reasons.
- Many EMS personnel and bystanders are physically not able to compress a victim’s chest to guideline depth. The root cause is due to a misconception among many that one’s ability to compress a chest to guideline depth depends upon strength. It does not. The force a person applies to a chest to achieve GC3’s is dependent upon four factors: The stiffness of the victim’s chest, the weight and weight distribution of the rescuer, and the compression method used. Some EMS personnel could not perform GC3’s on even an average stiffness chest. (e.g. subjects 23 and 32.)
- Many EMS personnel compress at too fast a rate and leave too much weight on the victim’s sternum at the top of a (supposedly) full recoil stroke. The root cause is an inability to self-regulate in most EMTs and Paramedics tested. During this trial, residual force less then 1.5 pounds was not counted as leaning, because the negative effect on the victim of 1.5 pounds of leaning is almost non-existent. (See figure 4 [4].)The vast majority (more than four out of five) of the test subjects failed to perform GC3’s due to excessive rate. Five-eighths failed to perform CG3’s due to “leaning” (the application of excessive residual force on the sternum.) Only one of the 44 subjects was able to control leaning and rate within guidelines.
- When a sub-set of the cohort was tested two to three months after the trial, it became clear that the effect of verbal coaching that was mostly effective in reducing leaning at the time of the original trial did not last. This rules out coaching in a training session as a solution.
- When the ambulance crew gets to an arrested victim, the victim either has or has not been receiving GC3’s from the time of the arrest until the hands-on arrival of the ambulance crew. The root causes are both the lack of training in a method that most bystanders can perform for ten minutes and the lack of alternative resources such as a personal AED. Many witnesses to a cardiac arrest are about the same age as the victim and hence sometimes are burdened with arthritis problems and might not be able to get the victim onto their back on a hard, flat surface – a requirement for effective CPR. Recent work has demonstrated that the use of heel compression by a bystander quadruples the number of rescuers that can perform GC3’s for ten minutes. Trenkamp, Perez 2015 [2]
Conclusions
These problems all appear to be solvable:
- Capacity, rate, and leaning problems can be solved most reliably by using a mechanical chest compression device. Such devices exist and are commercially available. At least one of the existing mechanical devices also solves the hyperventilation problem (a real problem not treated in this paper) because it runs on Oxygen and includes a ventilator. Aelen et al. 2013 [3] argue based upon a theoretical model that a depth of 5-6 cm is beyond the practical reach of many.
- Getting people trained in Heel Compression appears to have the potential to increase the number of times the victim has been receiving GC3’s from the time of the arrest until the ambulance crew’s “hands-on” arrival.
- The problem of wait2021 Copyright OAT. All rights reservcan also be reduced by broader availability of AEDs, particularly in private residences where most arrests occur.
References
- Circulation Editorial Board (2015) American Heart Association Guidelines Update for Cardiopulmonary Resuscitation and Emergency Cardiovascular Care. Circulation 132.
- Trenkamp, Perez October (2015) Heel compressions quadruple the number of bystanders who can perform chest compressions for ten minutes; AJEM Vol 33, Issue 10, pages 1449-1453
- Aelen et al. (2013) Chest Stiffness: Getting to a 6 cm Compression Depth Expectation. Circulation 128.
- Niles et al (2011) Prevalence and hemodynamic effects of leaning during CPR. Resuscitation 82: S23–S26.