Abstract
Objective: Smile line is an inevitable element in esthetic dentistry, does the lip length have any correspondence to the smile line? Our study provides scientific data as part of an evidence-based assessment regarding the relationship between the upper lip length and smile line in a Malaysian population.
Materials and methods: A randomized sample, consisting of 238 Malaysian aged between 18-35 years was used to carry out this study. Upon screening, the participant was asked to relax the lip and the lip length is recorded with a calibrated caliper. Measurement of the lip length was taken from subnasale to stomion superius. Smile line was then assessed by posed smile. All the data was taken in presence of at least 2 examiners to enable cross-checking of measurements. The Chi-Square test was then used to test the significance between both the variables.
Results: The lip lengths obtained from the sample ranged from 18-29 mm with mean 22.7 mm and standard deviation of 2.53. Both males and females have majority of average smile line. The Indians and Malays have mostly average smile lines, however, the Chinese showed more of high smile lines. In this study, the chi-square statistic exceeded the conventionally accepted significance level of 0.05, where p-value = 0.265. In other words, there is no statistically significant increase in smile line with increased lip length.
Conclusion: From our study, the lip length does not affect the smile line of an individual.
Key words
smile design, smile line, lip length, esthetic zone
Introduction
According to Garber and Salama, the smile is a voluntary facial expression indicating happiness, pleasure, and greeting [1]. The smile is also a unique gesture to the human race, unlike the much similar species, the primates [2]. Not only does it represent the human race, a smile is more than a form of communication which influences personality and individual performance in jobs and daily activities.
Smile line is defined as the position of the lower border of the upper lip during smile and thereby determines the display of tooth or gingiva at this hard and soft tissue interface [3].
Generally, a smile can be classified broadly into posed and unposed smiles. A forced and voluntary smile is produced during a posed smile, and it is considered reproducible and static. On the other hand, an unposed smile is observed during joy and emotion. It is non-sustainable, involuntary and dynamic. Posed smile can be further divided into strained and unstrained. A strained smile will produce maximum upper lip elevation [4].
Smile line was classified by Tjan, et al. into high, average and low [4]. High smile line shows the entire cervico-incisal length of maxillary anterior teeth and an adjoining band of gingiva [4]. An average smile, whereas, reveals 75-100% of the maxillary anterior teeth and the interproximal gingival only [4]. Lastly, a low smile line shows less than 75% of the upper anterior teeth, without any display of gingiva [4]. Lip contact should be evaluated from the position of lips in rest position, as well as the range of lip mobility when smiling. These determine the amount of tooth structure and gingival tissue being revealed during the comparison between the repose and full smile positions. Tjan, et al. also mentioned that an “optimum smile” is the one that displays full clinical crown of the six maxillary anterior teeth and also the premolars from frontal view [4]. Smile line is considered as acceptable if it is within the range of 2mm apical to heights of gingival of maxillary centrals [5].
Several studies also showed that females are 2.5 times more prevalent to high smile line, whereas males are more of low smile lines [6].
The two highly mobile fleshy folds that surround the orifice of mouth are nothing but lips. They can either be thin or full, wide or narrow, even short or long. Inclination of the teeth is one of the factors causing excessively prominent or recessive lip. For example, individuals who are completely edentulous generally has receded lips, causing the increased prominence of the nose and chin. The lips usually meet in a straight line or are curved towards the corners either in an upward or downward direction at rest. The short upper lip usually causes incompetent lips that always curves upward, remains open and produces an acute angle at the corner of the mouth [2].
Fonseca mentioned that normal upper lip length for females range from 18.0 to 22.0 mm and 20.0 to 24.0 mm in males [7]. A study by Hega, et al. showed that upper lip length was 3.1mm shorter in woman than in men [6]. Exposure of gingival architecture and dental components are affected by several lip factors. These variables are like upper and lower lip muscle mobility, lip strength and also lip vertical length. They complement other factors such as skeletal relationship in producing variable gingival and dental display by altering the position of the smile line [8].
There are studies which proved that subjects with high smile line have upper lip shorter lip length compared to low smile line subjects [6]. Many factors influences smile line including the lip length. Our study provides scientific data as part of an evidence-based assessment regarding the relationship between the upper lip length and smile line in a Malaysian population.
Material and method
A total of 238 participants were included in this study. The participants were patients, staffs and students at the MAHSA College. It was explained to potential participants that this was a study on smile line involving measurements of upper lip length and smile line assessment with photos taken for only lower part of the face (chin to nose). Informed consent was obtained from the participants.
The inclusion criteria for this study were:
- Voluntary involvement in the study
- Age between 18 to 35 years
- Malaysia citizen
- No history of craniofacial trauma, surgery or dental rehabilitation
- No anterior teeth malocclusion
- A healthy periodontium or a reduced but still healthy one
- No congenital anomalies
- At least 6 contiguous anterior and superior teeth quality equally distributed between left and right.
The exclusion criteria for this study were:
- Gross asymmetries
- Missing teeth that could have been visible on smile
- Excessive dental attrition
- History of lip surgery or enhancement
- Lip asymmetry
- Craniofacial syndromes
- Dental prosthesis for the aforementioned teeth in the inclusion criteria active
- Active orthodontic treatment
Gender, race and age of the subjects were recorded. The subjects were instructed to hold the head in natural head position by looking straight and relax their facial muscles. The Vernier caliper was used to measure the upper lip length (the distance between the base of the nose to the most inferior point at the center of the upper lip, Figures 1 and 2) in millimeter. Lip length measurement was done in presence of at least 2 examiners with 3 readings taken each to enable cross-checking of measurements. The mode of measurements was recorded as final reading.
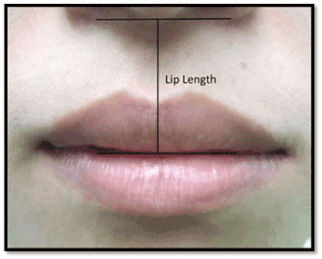
Figure 1. Lip length, from the subnasal to the most inferior point at the center of the upper lip.
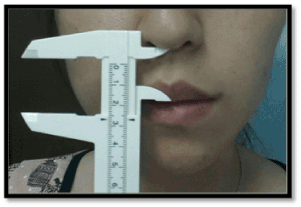
Figure 2. Lip Length measurement on the participant.
To prompt maximum smiling, humorous jokes were told to the participants in between casual conversations with the examiner. Hence, the subjects were unaware that their maximum smile were being analysed. Smile line was classified according to the 3 categories as in Figure 3.
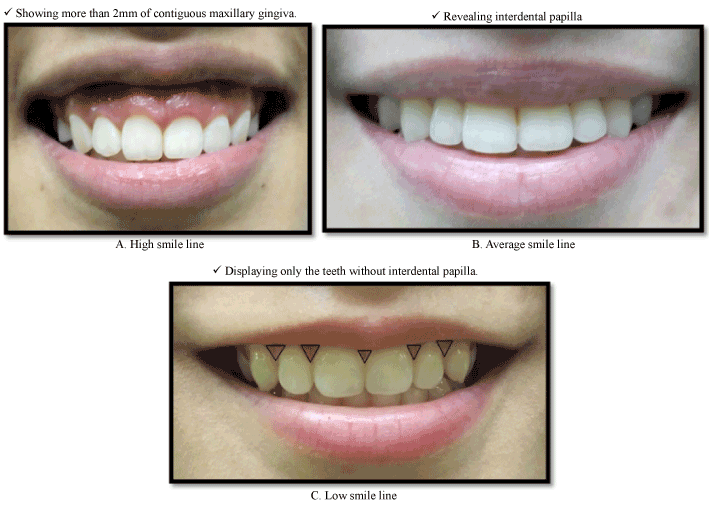
Figure 3. Smile line was classified according to the 3 categories: A) High smile line, B) Average smile line, C) Low smile line.
All participants were photographed for maximum smile with the camera lens adjusted parallel to the apparent occlusal plane focused only on the lower one third of the face (from nose to chin).
Data analysis
Chi-square test was used to determine possible significances. A P-level of <0.05 was set as to be significant.
Results
A total of 200 participants were included in the sample out of the 238 samples collected, of which 136 were female and 64 were male participants, aged from 18-35 years old (mean age =21.9). The sample frequencies are shown in Table 1. The gender distribution showed more females (68%) than males (32%) which can be represented in Figure 1.
Table 1. Total sample frequency.
Gender |
Race |
Total |
Malay |
Chinese |
Indian |
Female |
53 |
66 |
17 |
136 |
Male |
7 |
48 |
9 |
64 |
|
60 |
114 |
26 |
200 |
The race distribution of the sample are as follow: 60 (30.0%) Malays, 114 (57.0%) Chinese and 26 (13.0%) Indians shown in Figure 2.
The frequencies for the upper lip length of the total sample is shown in Figure 3.
The frequencies for the smile line of the total sample, and according to race and gender are shown in Figures 6, 7 and 8.
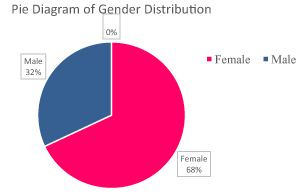
Figure 4. Gender distribution of total sample.
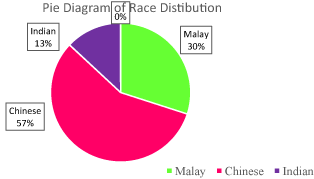
Figure 5. Race distribution of total Sample.
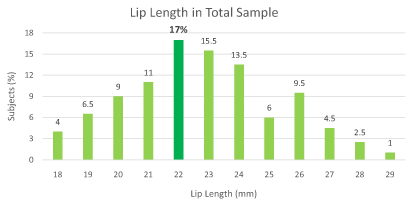
Figure 6. Lip length of total sample.
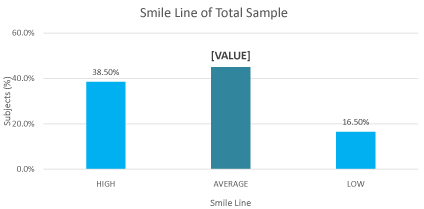
Figure 7. Smile line of total sample.
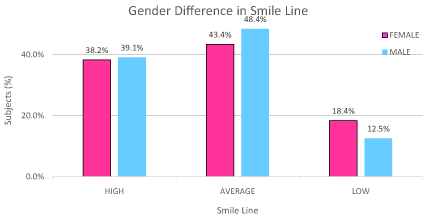
Figure 8. Gender difference in smile line of total sample.
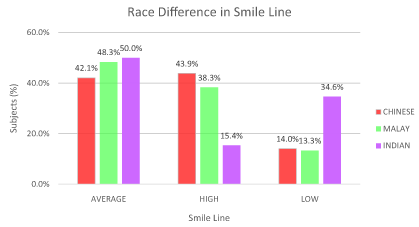
Figure 9. Race difference in smile line of total sample.
The average (mean) upper lip length for the entire sample was 22.79 mm (SD, 2.53). The most frequent upper lip length in females and males were both medium lip length (50.7% and 54.7% respectively). The most frequent upper in lip length in Chinese was medium lip length (59.7%), in Malays and Indians were the short lip length (48.3% and 62% respectively).
The most frequent smile line was the average smile line (45%). The most frequent smile line in both females and males were the average smile line, 43.4% and 48.4% respectively. The most frequent smile line in the Chinese was the high smile line (43.0%). The most frequent smile line in the Malays and Indians were the average smile line (48.3% and 50% respectively).
Statistical analysis
To test the statistical significance of the difference in upper lip length in relation to smile line, Chi-square test was used. The P-value was 0.052 which was more than the significance value of 0.05. The null hypothesis (H₀) was therefore accepted. There was no significant relationship between upper lip length and smile line.
Discussion
Smile line is important for reconstruction of the dentogingival relationship to produce an esthetic and functional harmony [8]. There are several factors that will affect the smile line, for example the strength of lips muscles and its mobility, lip length, crown height, and skeletal jaw relationship specifically jaw length [8]. On the other hand, malalignment of teeth, abnormal passive eruption, and gingival recession including presence of “black of triangle” in the interproximal area can lead to unaesthetic appearance [8].
A main objective of this study was to provide scientific data as a part of evidence-based assessment of the relationship between the upper lip length and smile line. We found a non-statistically significant (P=0.052) relationship between upper lip length and smile line. A limitation in a study design was that it was cross-sectional, and thereby correlative; thus, cause and effect could not be clearly established. However our data clearly demonstrate that there is no relationship between smile line and upper lip length at rest. As found in our samples, none of the Indian population show long lip length (0%) however they occupy highest percentage (34.6%) in low smile line category. From the reviewed literature, our study support Peck, et al. observation that there is no significant difference between upper lip length and smile line [9]. Similarly, a study by Miron, et al. stated that the longer the lip length the higher the smile line, which is in accordance to our findings [6].
In our study, most subjects (45%) have average smile line which is in accordance to a study reported by Desai, et al. (78%), Tjan, et al. (68.9%) and Dong, et al. (56%) [10].
Gender plays an influential role in determining smile line. Our findings show that average and high smile pattern can be considered as both the male (48.4% and 39.1% respectively) and female norm (43.4% and 38.2% respectively).
In the standpoint of Puppin, report shows women tend to have average and high smile line (55.9% and 37.7% respectively) and men tend to have average and low smile line (54% and 23.8% respectively) [11]. Another report by Peck, et al. observed average (52.2%) and high (32.5%) smile line in women but male usually feature average and low smile line (48% and 33% respectively) [9]. Both of the report is similar to our results in female findings. On the contrary, our results for male smile line differ from those report mentioned above. In our opinions, this might be attributed to ethnic-related features and mean age difference but it requires further investigation. On the other hand, Liebart, et al. states that age and gender does not affect the position of smile line due to lip stretching during forceful smile [12].
The three largest ethnic groups in Malaysia are the Malay, Chinese and Indian which are included in our study. There is no comparable study in the literature has addressed Malay ethnic smile line. Therefore, it cannot be compared to any previous norm. It might not be surprising to find that most subjects show average followed by high and then low smile line (48.3%, 38.3% and 13.3% respectively).
A study published by Sepolia, et al. in year 2014 concluded that most Indians show average smile line (59%) during forced smile regardless of gender. However, low smile line is dominant (49.5%) during natural smile [8]. Sepolia, et al. also explained that the present of this result might be due to Indian culture where people are shy to smile normally unless being requested [8]. In our study, Indian ethnic occupy highest percentage (34.6%) in low smile line category. However it is more likely that it is due to ethnic-related features, cultural assimilation and mean age difference.
Hu, et al. from Peking University of Beijing, China conducted a study to investigate the smile line of Han-Chinese population [13]. In their study, most subjects show high followed by average and then low smile line (31%, 50% and 19% respectively) [13]. Our study differs slightly as we found highest percentage of high, followed by average and then low smile line (43.9%, 42.1%, and 14% respectively). However, there is not much difference between the percentage of high smile line and average smile line, with only 1.8% in difference. The dissimilar results might be due to ethnic-related features, cultural assimilation and mean age difference as well. Other than that, Hu, et al. has significantly smaller sample size which is 62 subjects compared to our study. Hu, et al. also mentioned that Chinese has higher smile line in comparison with Caucasian due to musculoskeletal anatomical difference especially in the maxilla region [13]. They mentioned that convex facial profile is more common in Chinese population as compared to Caucasian leading to more occurrences of high smile line in Chinese population [13].
Small sample size due to time constraints might be the reason of the non-significant results between the relationship of upper lip length and smile line. So, larger sample size should be used for further investigation.
Convenient sampling method was used which cannot represents the whole Malaysian population. It can be improved by including other age groups, other Malaysian ethnics and also collecting samples from all the states in Malaysia.
Digital analysis of smile line and lip length is recommended to obtain a more precise result so that human errors can be avoided. For example, digital videography and Adobe Photoshop.
Conclusion
Firstly, our study shows that the most common smile line in a Malaysian population is the average smile line. Secondly, the most common smile line in the Malay and Indian population is the average smile line, whereas in the Chinese population is the high smile line. Thirdly, in both genders the most common smile line is also the average smile line. Finally, there is no significant relationship between the upper lip length and smile line.
Acknowledgements
Acknowledge goes to Mr. Mohammed Zaki Noor Al-Hashimi/biostatistics lecturer in MAHSA College, for his great support and effort.
References
- David GA, Salama MA (1996) The aesthetic smile: Diagnosis and treatment. Periodontol 2000 11: 18-28. [Crossref]
- Matthews TG (1978) The anatomy of a smile. J Prosth Dent 39: 128-134. [Crossref]
- Mohan B (2010) Principles of smile design. J Conserv Dent 13: 225-232. [Crossref]
- Tjan AHL, Miller GD (1984) Some esthetic factors in a smile. J Prosthet Dent 51: 24-28. [Crossref]
- Nicholas DC (2007) Smile Design. Dental Clin North America 51: 299-318.
- Hagai H, Calderon S, Allon D (2012) upper lip changes and gingival exposure on smiling: vertical dimension analysis. American J Orthodontics Dentofacial Orthoped 141: 87-93. [Crossref]
- Philip R (2012) The influence of lip length and lip mobility on maxillary incisal exposure. American J Esthetic Dent 2: 116-125.
- Shipra S (2014) Visibility of gingiva - An important determinant for an esthetic smile. J Indian Soc Periodontol 18: 488-492. [Crossref]
- Sheldon P, Peck L, Kataja M (1992) The gingival smile line. Angle Orthodontist 62: 92-100. [Crossref]
- Christopher M, Nanda R (2007) Dynamic smile analysis in young adults. American J Orthodontics Dentofacial Orthoped 132: 307-315. [Crossref]
- Camara AC (2010) Aesthetics in orthodontics: six horizontal smile lines. Dental Press J Orthod 15: 118-131.
- Marie-Françoise L (2004) Smile line and periodontium visibility. Perio 1: 17-25.
- Xiu-lian H (2011) Measurement and analysis of smile line of 62-Han Chinese. Chin J Stomatol 46: 660-664. [Crossref]


