CCAAT/Enhancer-binding proteins (C/EBPs) are DNA-binding proteins that regulate cell-specific growth and differentiation. Here, we have generated ras-transformed NIH 3T3 cells stably expressing C/EBP α or C/EBPb. In cells overexpressing C/EBP α and C/EBPb, growth arrest, changes in morphology and differentiation were induced. cDNA microarray analysis followed by RNA blot analysis identified genes that are possibly involved in growth arrest and/or differentiation of cells in response to C/EBP α and C/EBPβtransfection. Our results demonstrate that C/EBP α and C/EBPβcause growth-inhibitory effects, which may be mediated by up-regulated proteins such as amyloid precursor protein and proteoglycans.
CCAAT/Enhancer-binding proteins, cell growth, cell differentiation
ADM: adriamycin, APP: amyloid precursor protein, C/EBP: CCATT/enhancer binding protein, DMEM: Dulbecco’s modified Eagle’s minimum essential medium, Oxct: 3’-oxoacid CoA transferase, ras-NIH: activated Ha-ras-transformed NIH3T3 mouse fibroblasts, SePP: selenoprotein P
Transcription factors of the CCAAT/Enhancer-binding protein (C/EBP) family are highly conserved leucine-zipper DNA-binding proteins that are expressed in a variety of tissues and cell types. The six mammalian C/EBPs (a, b, d, g, e, CHOP) bind to DNA and facilitate the activation or repression of gene transcription [1-3]. Replacement of the basic region of C/EBP family members with that of other C/EBPs leads to alterations in DNA-binding specificity for the resultant homo- or heterodimer fusion proteins [4]. C/EBP α is highly expressed in liver, fat, lung, peripheral leucocytes, epidermis, intestine, and skeletal muscle [5] C/EBP α has been implicated in the regulation of tissue-specific gene expression and differentiation of adipocytes and hepatocytes [6], as well as negative regulation of cell growth [7]. The importance of C/EBP α in the regulation of growth arrest and differentiation is exemplified by human acute myeloid leukemia [8]. Dominant-negative mutations in C/EBP α are thought to results in a block of the differentiation of granulocytic blasts and have implicated C/EBP α as a tumor suppressor gene [2,9]. These findings suggest that expression of the different C/EBP protein isoforms is tightly regulated and that the ratio of isoforms is important in controlling proliferation and differentiation.
Deregulated expression of truncated C/EBP and C/EBP isoforms interferes with terminal differentiation and induces cell transformation in 3T3-L1 adipocytes [10]. Hence, regulation of the translation initiation that determines the ratio of C/EBP isoforms has a crucial role in the control of cell proliferation and differentiation in cells expressing C/EBP α and C/EBPb. C/EBP-deficient animals exhibit an absence of subcutaneous white adipose tissue and granulocytes, and typically die within a few hours of birth due to hypoglycemia [11], demonstrating that this transcription factor plays a key role in tissue-specific gene expression and differentiation.
Both C/EBPβand C/EBP α are involved in regulating the proliferation and differentiation of adipocytes and hepatocytes [6]. C/EBPβalso plays an essential role in ovarian granulosa cell biology and development and differentiation of the mammary gland [12]. Thus, disruption of signaling through C/EBPβappears to contribute to malignant transformation. At very early stages of liver proliferation initiated by partial hepatectomy, the transcription factor C/EBPβis activated mainly through posttranslational modifications [13]. Lamb et al. have identified a cyclin-dependent kinase (CDK)-independent mechanism by which the interaction of cyclin D1 with the transcription factor C/EBPβ may mediate tumorigenesis [14]. It has been suggested that C/EBPβacts as a constitutive repressor of cyclin D1 targets and that cyclin D1 antagonizes this repressor function. C/EBPd may also be involved in the acute-phase response and appears to be required for the G0 growth arrest of epithelial cells in mammary tissues [15].
Studies in recent years have pinpointed several potential mechanisms for C/EBP α-mediated cell growth arrest. It has been suggested that C/EBP α expression in human fibrosarcoma cell line leads to the induction of p21, an inhibitor of CDK, promoter activity, and the accumulation of p21 protein. Further study has indicated the potential ability of C/EBP α to stabilize p21 protein and thereby halt cell-cycle progression [16]. Iakova and colleagues have presented evidence that aging switches the C/EBP α pathway of growth arrest in liver from CDK inhibition to repression of E2F transcription [17]. The exact role of C/EBP α in cell growth arrest, and whether this function is separate from its known activities as a transcriptional activator, remain unclear.
In this study, we have examined effects of C/EBP α and C/EBPβon cell growth. We demonstrate that C/EBP transfection results in a reduction in proliferation, and changes in morphology, and differentiation in C/EBP-expressing cells. We used cDNA microarrays to identify candidate genes whose expression levels altered in response to C/EBP α transfection. We used Northern blot to confirm the up-regulation of transcripts of these genes in the C/EBP α transfectants, and found that genes related to growth inhibition and tumor suppression, such as proteoglycans and amyloid precursor protein, are upregulated by C/EBPs.
Cell culture
Activated c-Ha-ras-transformed NIH3T3 (ras-NIH) [18] and their transfected cells were cultured in Dulbecco’s modified Eagle’s medium (DMEM) supplemented with 5% calf serum (CS).
Plasmids and transfections
Plasmids expressing mouse C/EBP α and C/EBPβunder the control of the human elongation factor-1a promoter of pEF-Bos [19] were described previously [20,21], and transfected into ras-NIH cells using Lipofectamine reagent (Thermo Fisher Scientific, Waltham, MA) as previously described [22]. After culture in the presence of G418 (400 mg/ml) for 2 weeks, surviving clones were isolated. Expression of the transfected DNAs was verified by Western and Northern blot analysis.
Preparation of cell extract and immunoblotting analysis
Cells were washed with phosphate-buffered saline three times and incubated in lysis buffer [0.5% Nonidet P-40, 20 mM Tris-HCl (pH 7.5), 1 mM EDTA, 1 mM phenylmethylsulfonyl fluoride, 50 µM leupeptin, 50 µM pepstatin A and 50 µM N-acetyl-Leu-Leu-norleucinal (ALLN)] for 10 min at 4°C (23). After centrifugation at 13000 × g for 10 min at 4°C, the supernatant and the pellet were analyzed as the cytoplasmic and nuclear fractions, respectively. Ten to fifteen micrograms of protein was separated by SDS-polyacrylamide gel electrophoresis and then transferred to nitrocellulose membranes (Toyo Roshi, Ltd., Tokyo, Japan). Western blotting was performed by standard methods using the following primary antibodies: anti-C/EBP α, anti-C/EBPβ(Santa Cruz Biotechnology, Santa Cruz, CA), and anti-Ras monoclonal antibodies, NCC-RAS-001 (Funakoshi, Tokyo, Japan). Horseradish peroxidase-conjugated anti-mouse or anti-rabbit antibodies (New England Biolabs) were used as secondary antibodies and the membranes were visualized by ECL (GE Healthcare).
Northern blot analysis
Total RNA was isolated using the acid/guanidine thiocyanate/phenol–chloroform extraction method [24]. RNAs were separated by electrophoresis in denaturing formaldehyde-agarose (1%) gels, visualized by ethidium bromide staining to check integrity and equal loading, and then blotted onto nylon membranes. Digoxigenin-labeled RNA probes were synthesized by a transcription kit (Roche Diagnostics, Mannheim, Germany) from cDNAs subcloned into the plasmid pcDNA II. The pME18S-FL3/cDNA construct was generated by PCR, subcloned into the pGEM-T vector, excised with EcoRI, and then used to generate DIG-labeled RNA probes for Northern blot analysis. Hybridization, washing, and chemiluminescent detection on X-ray films were done as recommended by Roche Diagnostics as described previously [25].
Growth rate determinations
A total of 2 × 10⁴ cells were seeded and cultured in 35 mm dishes in triplicate. After the indicated periods of growth, cells were trypsinized and counted on a Coulter Conter ZM (Beckman Coulter, Inc., Brea, CA) according to the manufacturer’s protocol.
Anchorage-independent growth
Cell growth in soft agar medium was examined as described previously [26]. One thousand cells were plated in soft agar medium containing 4% SeaPlaque-agarose, 10% CS, and DMEM. After culture at 37°C for 3 weeks, colonies whose diameters were larger than 0.1 mm were scored. Colony-forming efficiency was calculated by dividing the colony number by the number of cells plated.
Flow cytometric analysis
Cells were washed three times with PBS and incubated in staining solution (0.1 % Triton X-100, 100 µg/ml of RNase A, 40 µg/ml of propidium iodide and 4 mM sodium citrate) on ice for 10 min. NaCl was then added to the solution to a final concentration of 0.15 M. The cells were examined by FACScan with the CellQuest System, and cell-cycle distribution was analyzed by ModFit LT software (Becton Dickinson Immunocytometry Systems, San Jose, CA).
Oil-Red-O staining
ras-NIH and FmCB-a7 cells were washed with PBS, fixed with 4% paraformaldehyde overnight at 4°C, and stained with Oil-Red-O solution for 5 min [2:3, 0.3% (w/v) Oil Red O (Sigma) in isopropanol and water before filtering]. Next, 7% Giemsa solution containing 50% methanol was added and the cells were analyzed by bright-field microscopy.
cDNA microarray analysis
A microarray was prepared essentially as described previously [27] with 2,304 mouse liver cDNA clones provided by K. Hashimoto (National Institute of Infectious Diseases, Tokyo, Japan) and S. Sugano (Institute of Medical Sciences, University of Tokyo, Tokyo, Japan). Total RNA was prepared from C/EBP α-transfected (FmCBa-14) cells and from parental cells by the acid/guanidine thiocyanate/phenol–chloroform extraction procedure [24]. Poly(A)+ RNA was isolated by using oligo (dT)-paramagnetic beads dynabeads Oligo(dT)25 (Dynal, Oslo, Norway). Next, 2 µg of poly(A)+ RNA and 4.5 µg of oligo(dT) in 15 µl of solution were heat-denatured at 70°C for 10 min and immediately chilled on ice. The mixture was made up to 30 µl with solution containing 50 mM Tris-HCl (pH 8.3), 75 mM KCl, 3 mM MgCl2, 10 mM DTT, 0.5 mM dATP, 0.5 mM dCTP, 0.5 mM dGTP, 0.2 mM dTTP, 0.1 mM Cy3- or Cy5-dUTP, and 400 units of reverse transcriptase SuperScript II (Thermo Fisher Scientific, Waltham, MA). The reaction was allowed to proceed at 42°C for 1 h. After alkaline degradation of template RNA, the Cy3- or Cy5-labeled cDNA was purified with Centricon-30 microconcentrators (GE Healthcare). Hybridization was carried out in a solution containing 2 µg/µl yeast RNA, 2 µg/µl poly(A), 3.4 × SSC (1 × SSC comprises 0.15 M NaCl and 15 mM sodium citrate), and 0.3% SDS at 65˚C overnight under humidified conditions. Microarrays were washed twice for 5 min with 2 × SSC and 0.1% SDS at room temperature, and twice for 5 min with 0.2 × SSC and 0.1% SDS at 40°C, and then rinsed with 0.2 × SSC. The fluorescent images were scanned with a laser-scanning device (Scan-Array 4000, GSI Lumonics, Bedford, MA) as described previously [28].
Constitutive ectopic expression of C/EBP α and C/EBP Β in ras-NIH cells
Mouse ras-NIH cells were stably transfected with the C/EBP expression system using lipofection as described in Materials and Methods. Clones surviving selection in G418 medium were tested for expression of C/EBP by Western blot and Northern blot analysis (Figure 1A-F). Among the clones expressing C/EBP α or C/EBPb, two of each, designated FmCBa-7 and FmCBa-14, and FmCBb-10 and FmCBb-16, respectively, were selected.
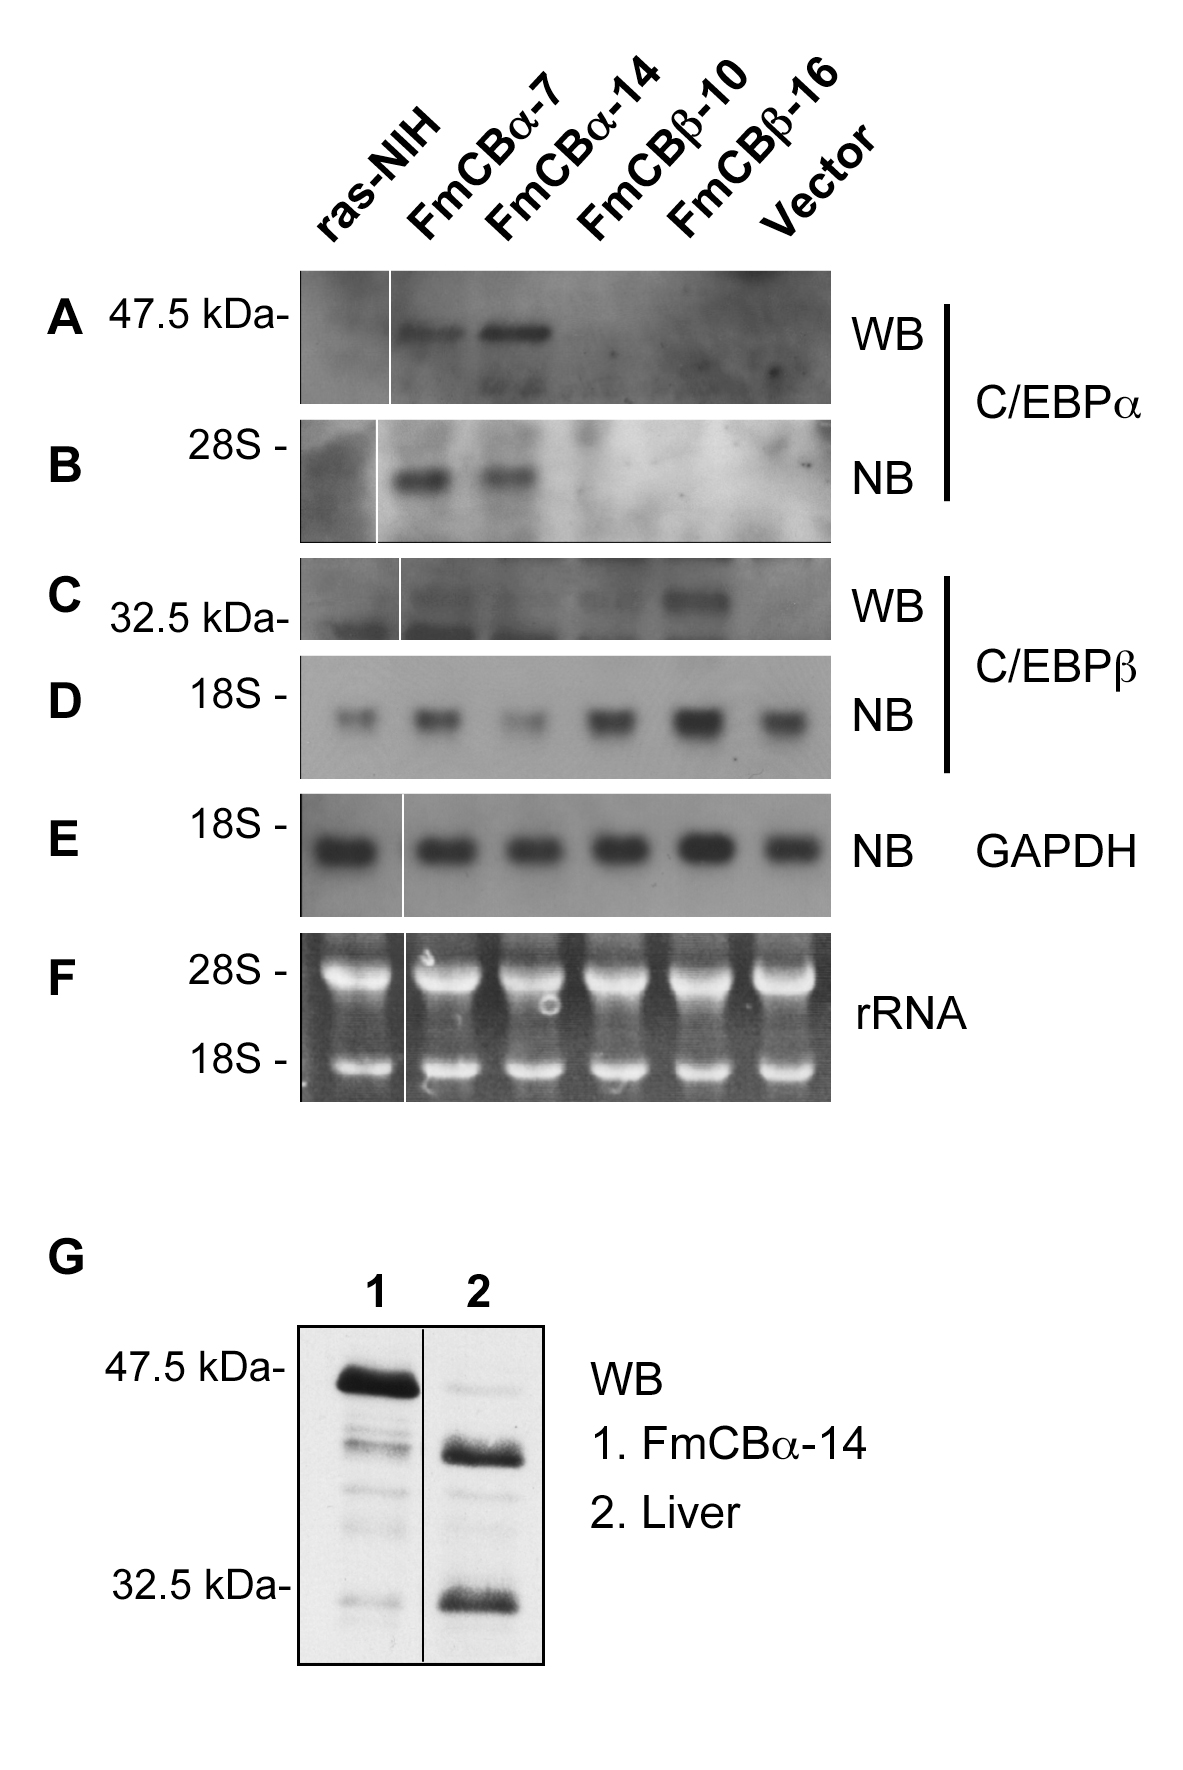
Figure 1. Constitutive ectopic expression of C/EBP α and C/EBPβin ras-transformed NIH3T3 cells. C/EBPα and C/EBPβwere stably transfected into ras-NIH cells. Expression of C/EBPα (FmCBa-7 and FmCBa-14) was examined by Western (A, 2 and 3) and Northern (B, 2 and 3) blotting, and that of C/EBPβ(FmCBb-10 and FmCBb-16) was examined by Western (C, 2 and 3) and Northern (D, 2 and 3) blotting. Parental ras-NIH cells (lane 1) and control cells transfected with empty vector (lane 6) were also analyzed. GAPDH was examined by Northern blot analysis as a loading control (E). Typical fluorogram of ethidium bromide staining of 28S and 18S rRNAs before blotting is presented (F). For comparison, Western blot analysis using extracts of FmCBa-14 cells and mouse liver was examined for C/EBPα on the same blot (G). WB: Western blot, NB: Northern blot. The positions of protein size markers, 47.5 kDa and 32.5 kDa, and those of 28S and 18S rRNAs are shown at the left.
In Western blot analysis (WB) for C/EBP α expression, a protein band of 46 kDa was detected. This band of 46 kDa was not detected in the parental strain (ras-NIH), in a clone transfected with control vector, or in FmCBb cells (Figure 1A). In northern blot analysis (NB), a band of C/EBP α mRNA was detected only in extracts from FmCBa-7 and FmCBa-14 cells (Figure 1B, lanes 2 and 3). In Western blot analysis for C/EBPb, a 35-kDa protein band was detected in FmCBb-10 and FmCBb-16 cells, and these clones showed a higher expression of C/EBPβmRNA than did the parental strain or a control transfected clone (Figure 1C and D).
We compared the relative molecular mass (Mr) of the overexpressed C/EBP α protein with that of mouse liver C/EBP α. A single transcript can encode at least four or five distinct C/EBP α or C/EBPβisoforms, respectively, from different in-frame translation start sites [10]. It has been reported that 42 kDa and 30 kDa proteins are expressed predominantly for mouse liver C/EBP α; however, the FmCBa-14 cells expressed an Mr of 46 kDa (Figure 1G), presumably because of incorporation of a Kozak consensus sequence [29] just in front of the uppermost initiation ATG codon of the C/EBP α construct. Thus, we conclude that the transfection of C/EBP α and C/EBPβinto ras-NIH cells resulted in clones that stably expressed these proteins.
Growth inhibition of FmCB cells
We next plated ras-NIH, FmCBa, and FmCBb cells at low density and examined proliferation under standard conditions. After 4 days, the number of ras-NIH cells had increased by 60-fold (Figure 2A) or 45- fold (Figure 2B). By contrast, the number of FmCBa-7, and FmCBa-14 cells had increased by only 15- and 30-fold, respectively (Figure 2A), and that of FmCBb-10 and FmCBb-16 cells had increased by only 24- and 26-fold, respectively (Figure 2B). These data support a role for C/EBP in growth arrest; in other words, increasing levels of C/EBP decrease proliferation under standard conditions.
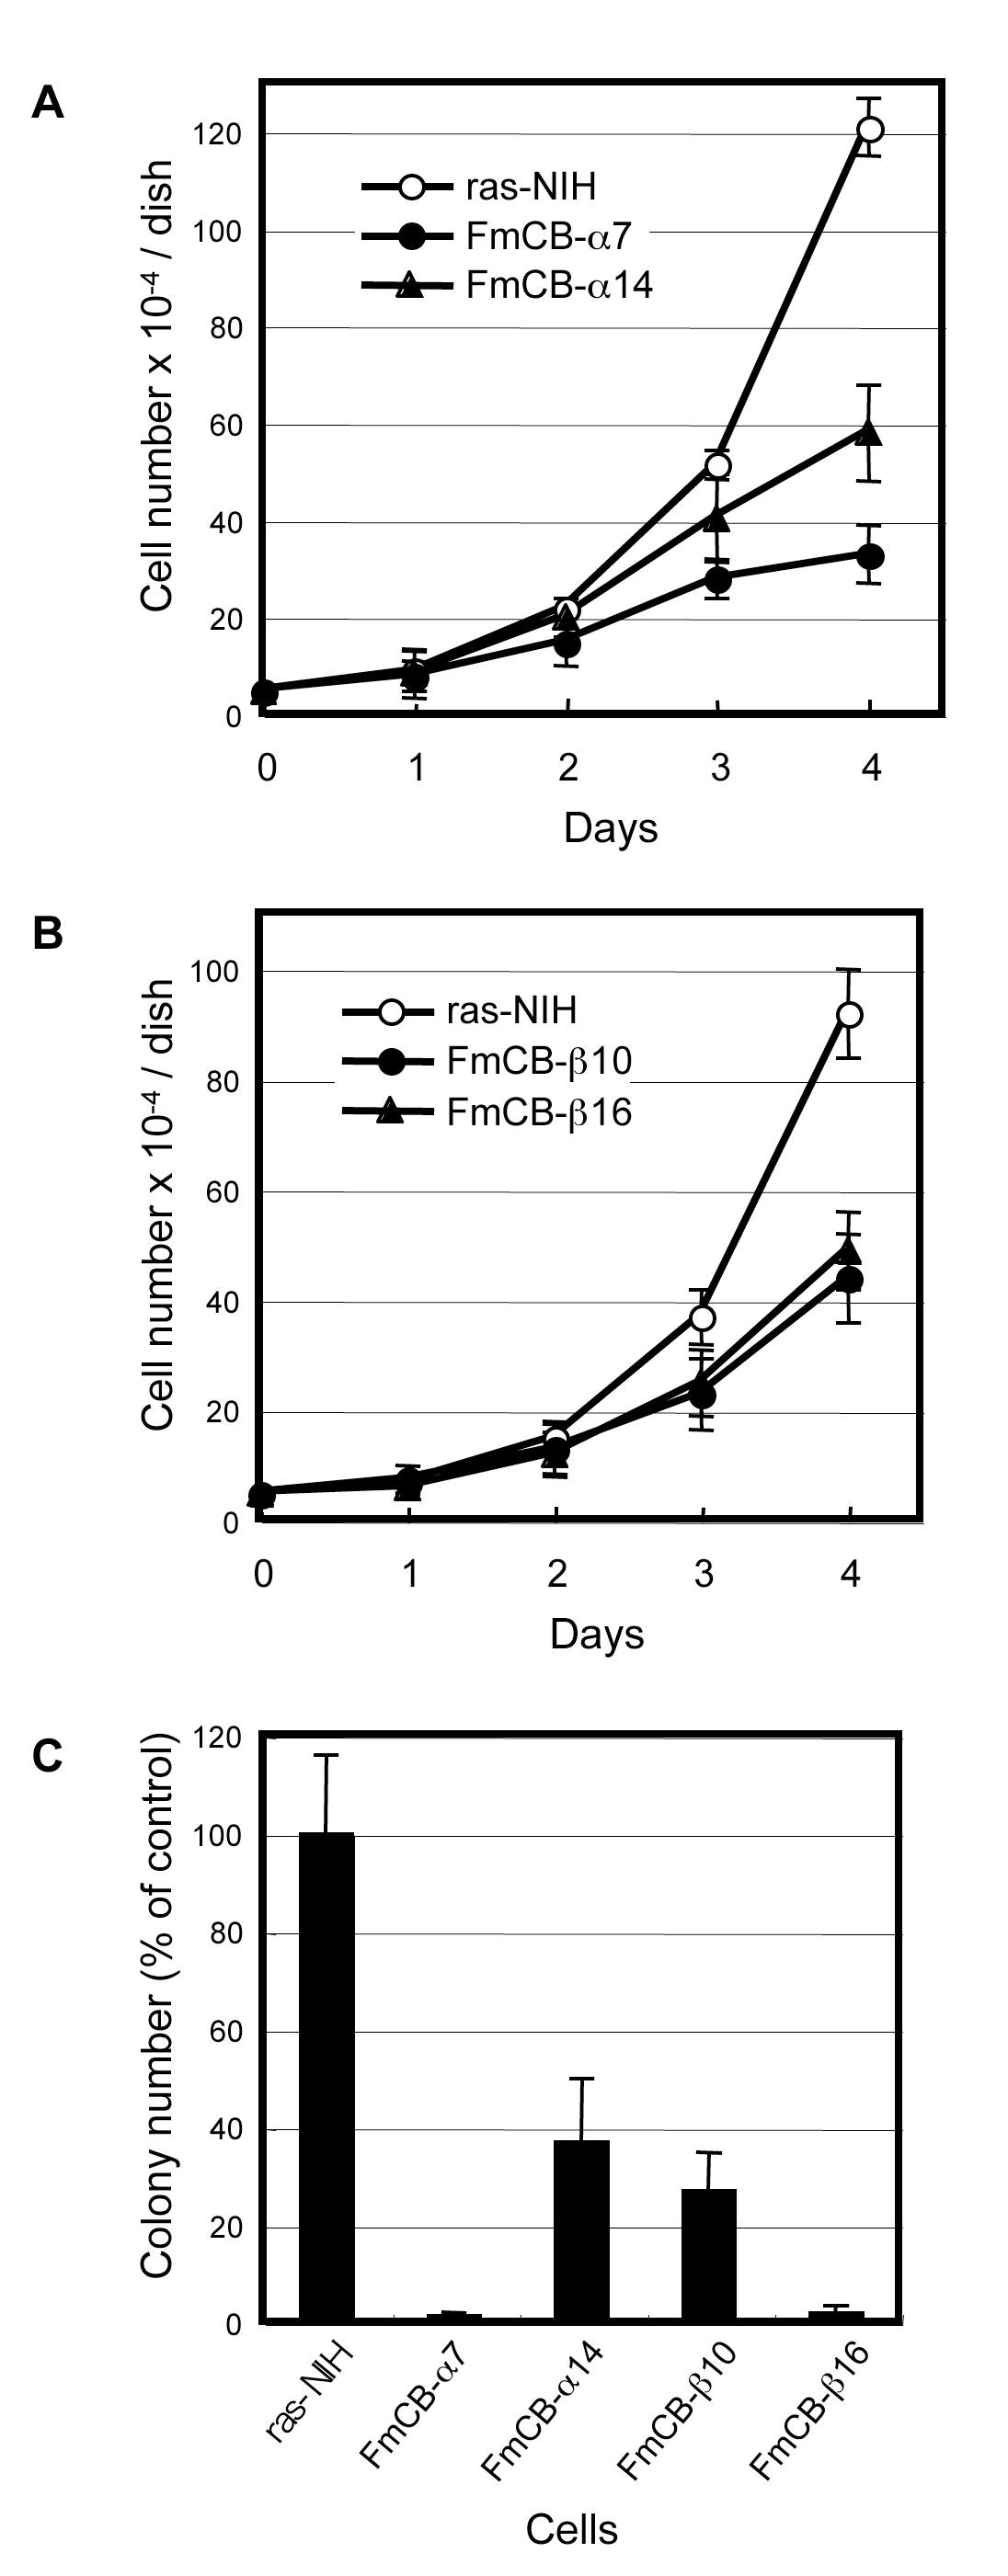
Figure 2. Growth inhibition of FmCB cells overexpressing C/EBP α or C/EBPb, and colony-forming efficiency of the C/EBP-transfected clones. The same number (5 × 10⁴) of C/EBP α transfectants (A, FmCBa-7 and FmCBa-14), C/EBPβtransfectants (B, FmCBb-10 and FmCBb-16), or parental ras-NIH cells (A, B) were seeded in 35-mm dishes in triplicate on day 0, and the cell number was determined on the days indicated. Values represent the mean ± S.E. Anchorage-independent growth in soft agar medium was investigated for control clones (ras-NIH) and transfected clones (FmCBa-7, FmCBa-14, FmCBb-10 and FmCBb-16) (C).
Because anchorage-independent growth is one of the specific phenotypes that has been observed in malignant cells [26], we investigated the growth of FmCB cells in soft agar medium. All four clones overexpressing C/EBP showed low colony-forming efficiency in soft agar medium, whereas the ras-NIH cells showed high colony-forming efficiency (Figure 2C). This implies that both C/EBP α and C/EBPβmay have the potential to suppress the phenotype of ras-transformed tumor cells.
The inhibitory effect of C/EBP on cell proliferation prompted us to examine changes in cell-cycle distribution by flow cytometric analysis. Nuclear DNA was stained with propidium iodide and examined by FACScan. As shown in Figure 3, a different cell-cycle distribution was observed between FmCBa-7 and ras-NIH cells. FmCBa-7 cells showed an accumulation of populations in the late S to G2/M phase (diploid), as well as in the G0/G1 phase (aneuploid) of the cell cycle, and contained many giant aneuploid cells. Apoptosis, detected as a hypodiploid sub-G1 peak, was also seen in FmCBa-7 cells. For the C/EBP-expressing clones such as FmCBb-16, the peak equivalent to the G0/G1 aneuploid phase was higher than that of the G2/M phase in ras-NIH cells, and these clones showed a slight change in cell-cycle distribution (Figure 3C–E). Thus, a G2/M (or G0/G1 of aneuploid cells) cell-cycle arrest was induced in FmCBa-7 and FmCBb-16 cells, which seems to be related to the many giant aneuploid cells that appeared on overexpression of C/EBP α or C/EBPb.
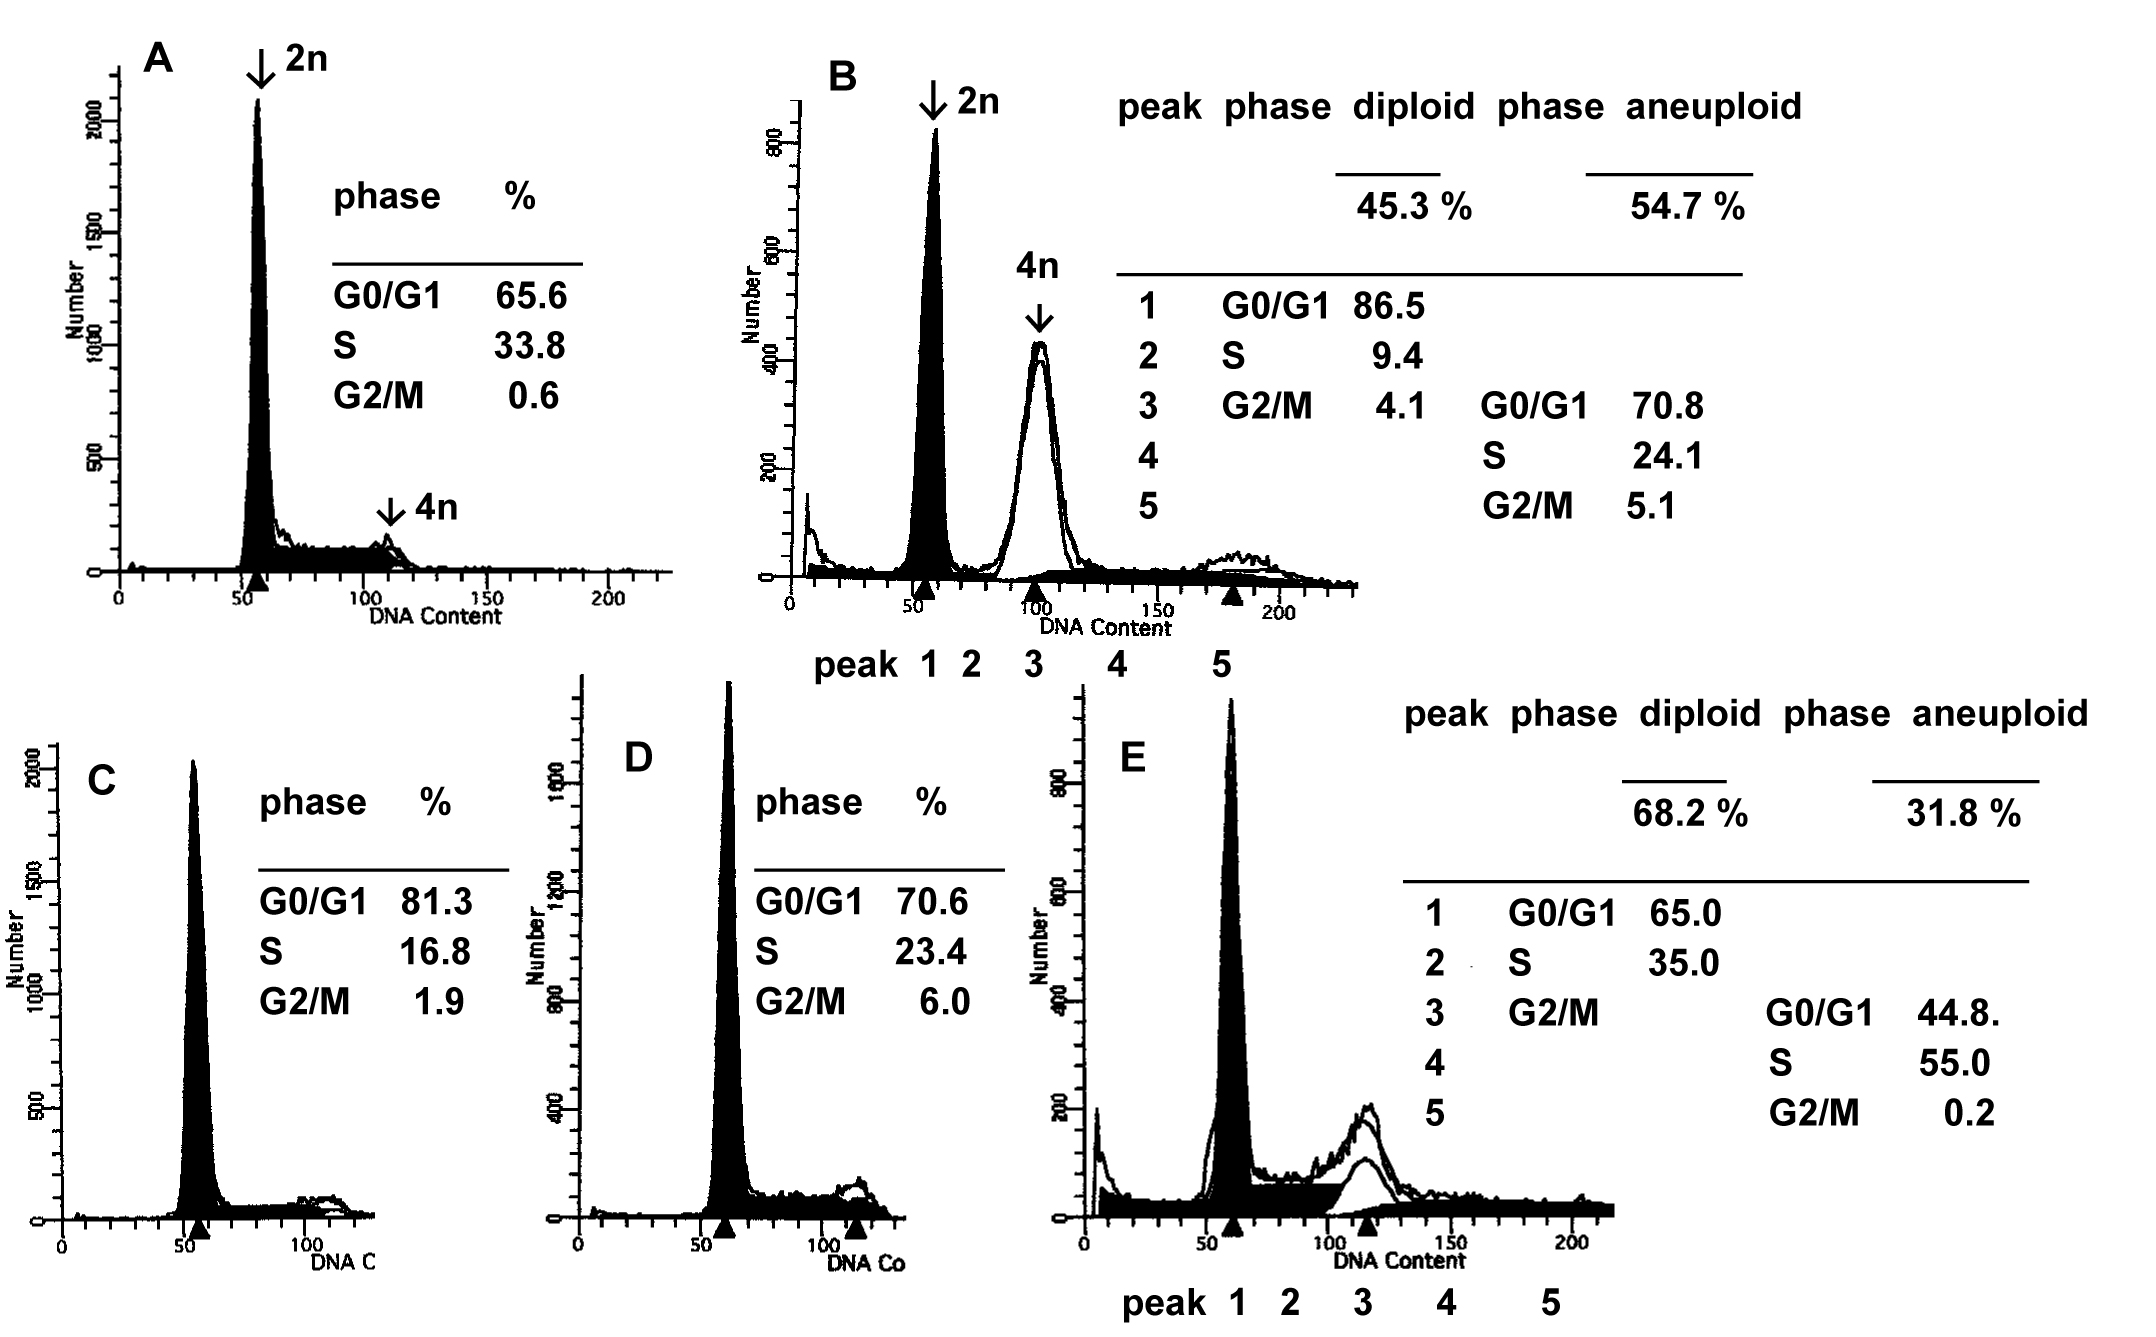
Figure 3. Flow cytometric analysis of cells transfected with C/EBP. ras-NIH (A), FmCBa-7 (B), FmCBa-14 (C), FmCBb-10 (D), and FmCBb-16 (E) cells were labeled with propidium iodide and examined by FACScan analysis to determine their cell-cycle distribution.
Change in phenotype and differentiation of FmCB cells
We observed the changes in the phenotype of the C/EBP α- or C/EBPb-expressing cells by an optical microscope. As shown in Figure 4A, in ras-NIH cells, sustained ectopic expression of ras gave rise to a heterogeneous population of predominantly small and spindle-shaped cells that were poorly differentiated. The cells displayed reduced adherence to the culture dish, forming dense foci. Thus, upregulation of ras prevents proliferation arrest and contact inhibition, interferes with terminal adipogenic differentiation, and induces a transformed phenotype. In FmCBa-7 cells, by contrast, there was a majority of giant aneuploid cells, contact inhibition increased (Figure 4B), and flat revertant-like cells were also present. In FmCBa-14 cells, there were more flat revertant-like cells than in ras-NIH cells, but the extent of contact inhibition and formation of foci was similar to that observed in ras-NIH cells (Figure 4C). Giant aneuploid cells and small and spindle-shaped cells were present in FmCBb-10 cells (Figure 4D); in addition, a lot of giant aneuploid cells and flat cells were present in FmCBb-16 cells (Figure 4E). Thus, the FmCB cells overexpressing C/EBP exhibited changes in phenotype.
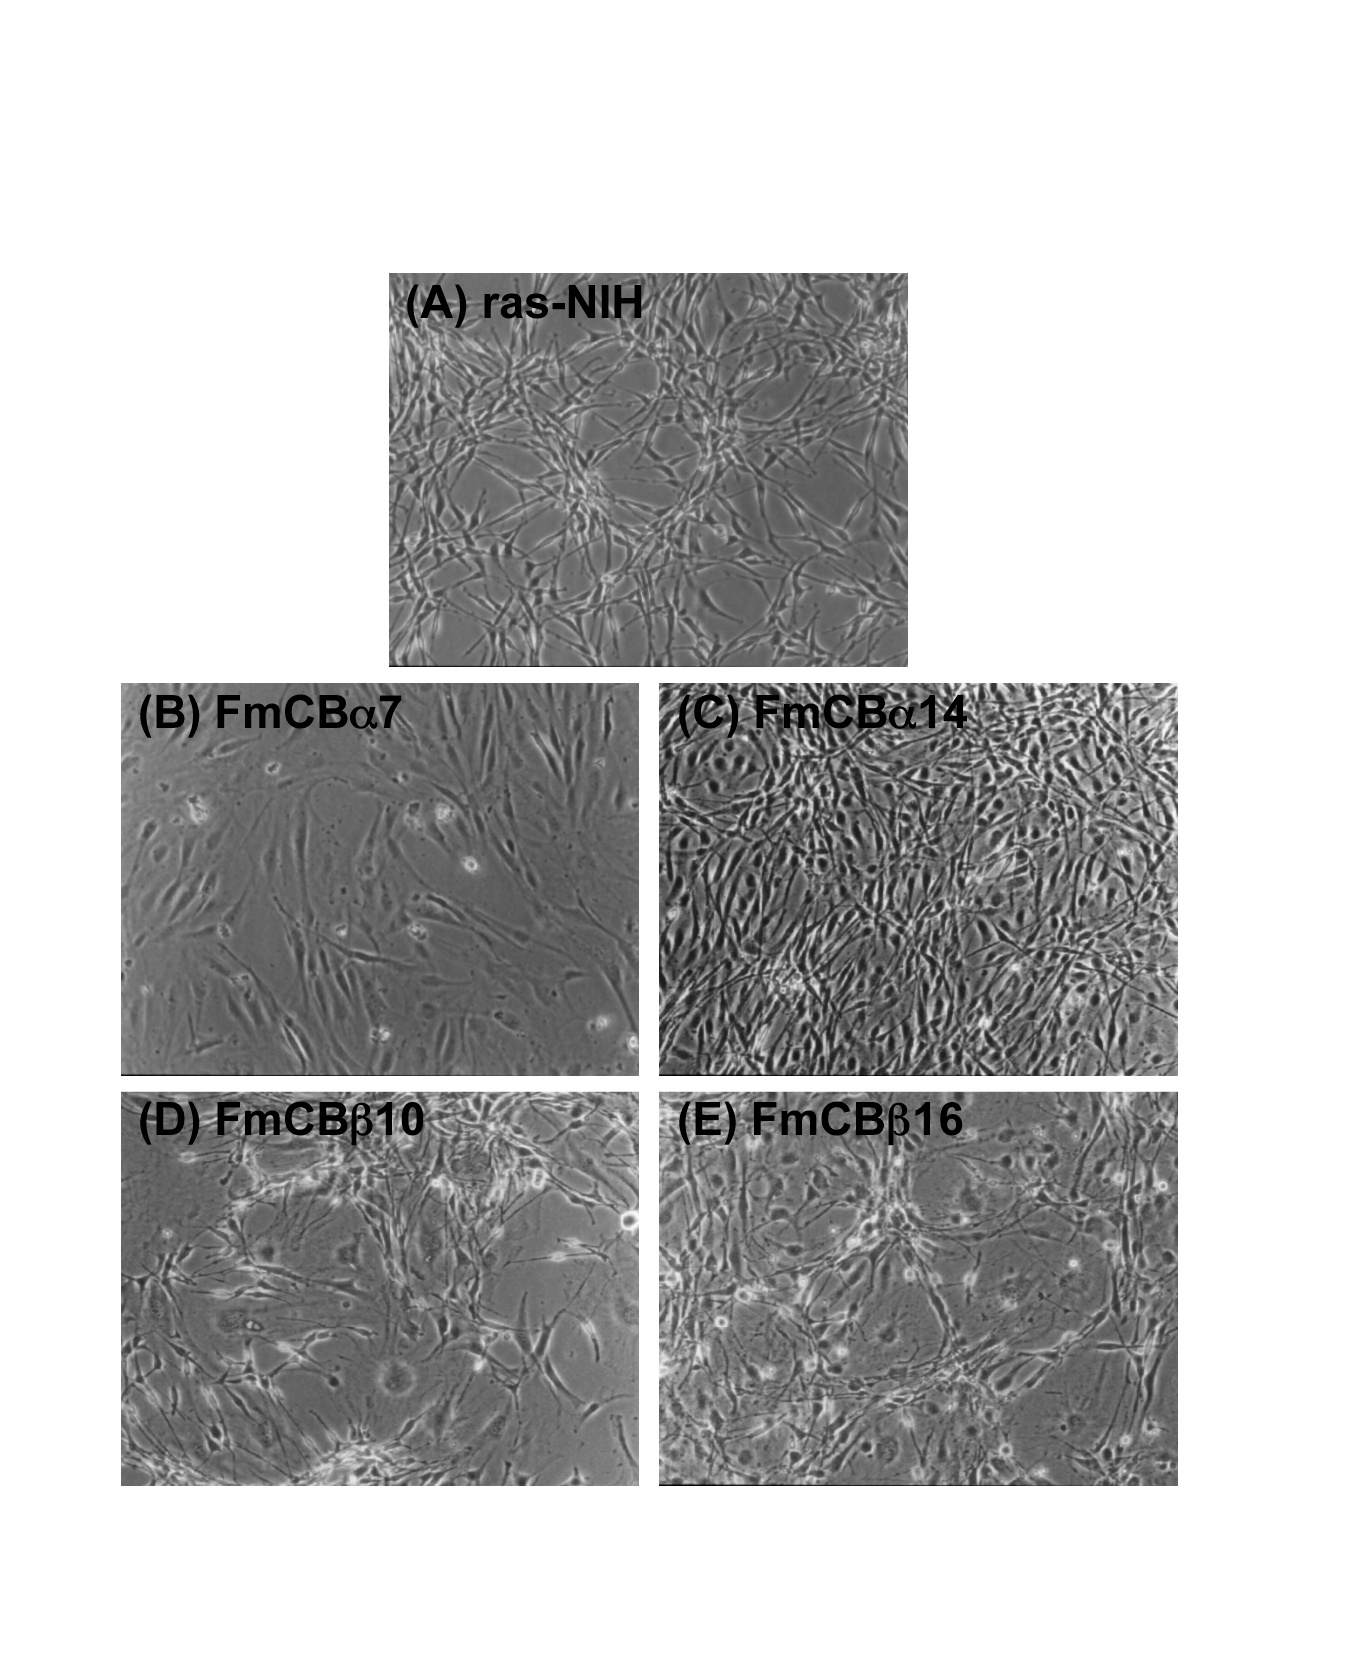
Figure 4. Phase-contrast micrographs of FmCB cells transfected with C/EBP. ras-NIH (A), FmCBa-7 (B), FmCBa-14 (C), FmCBb-10 (D), and FmCBb-16 (E) cells were subjected to phase-contrast micrography, as described in Materials and Methods.
Apparently, proper translational regulation of C/EBP expression is a prerequisite for terminal adipogenic differentiation and proliferation arrest. As it has been reported that 3T3-L1 cells are differentiated to fat cells by the expression of C/EBP α [30], we examined whether lipid was increased in FmCBa and FmCBb cells by using Oil Red O staining. More lipid droplets were observed in the cytosol of FmCBa-7 cells (Figure 5A) than in that of ras-NIH cells (Figure 5B). In addition, giant aneuploid cells were again more prominent in FmCBa-14, FmCBb-10, and FmCBb-16 cells than in ras-NIH cells (Figure 5C–E). These findings suggest that the production of fat and giant aneuploid cells increased, and that terminal adipogenic differentiation was induced, by the overexpression of C/EBP α or C/EBPβin FmCB cells.
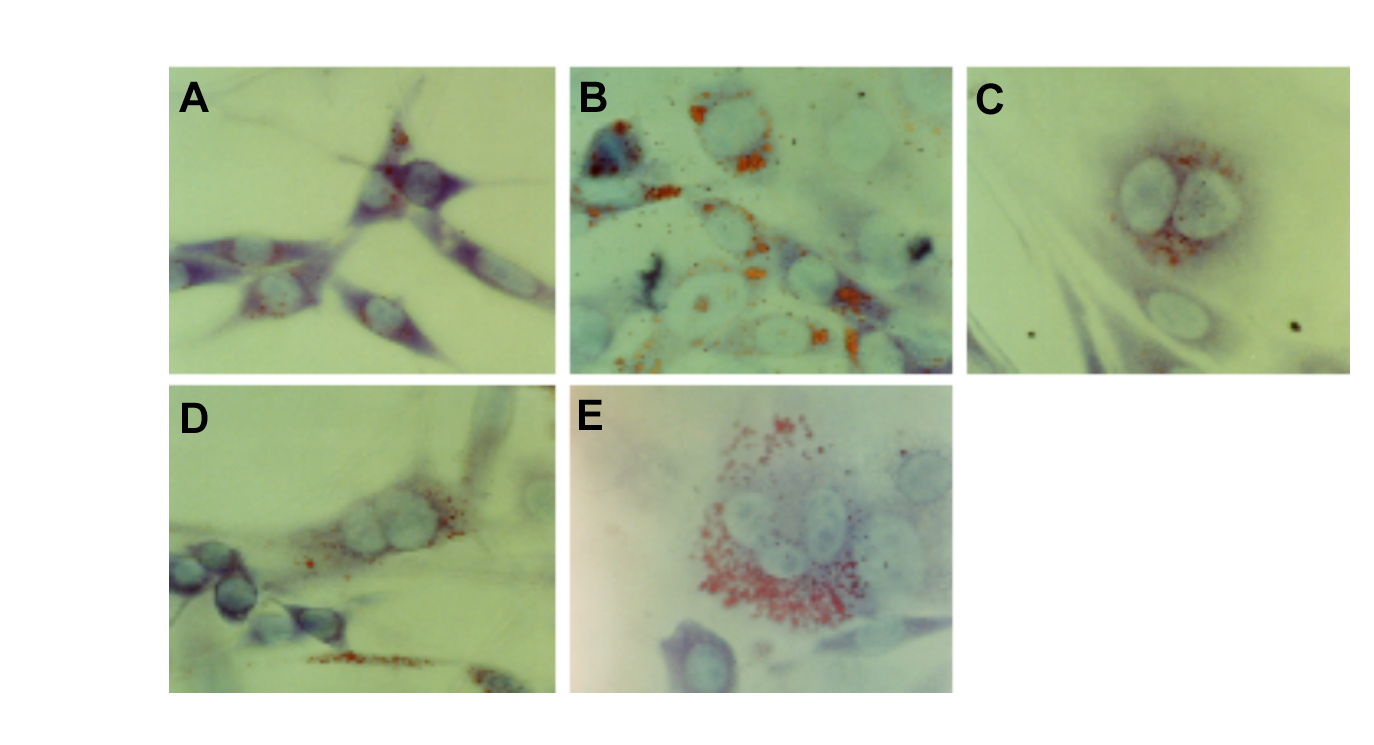
Figure 5. Increase in lipid droplets in cell lines overexpressing C/EBP. ras-NIH (A), FmCBa-7 (B), FmCBa-14 (C), FmCBb-10 (D), and FmCBb-16 (E) cells were fixed with 4% paraformaldehyde, stained with Oil-Red-O/Giemsa solution containing 50% methanol, and then analyzed by bright-field microscopy as described in Materials and Methods.
Northern blot analysis of C/EBP α -regulated genes identified by cDNA microarray analysis in FmCB β -14 cells
Next, we carried out cDNA microarray analysis to elucidate candidate gene targets of C/EBP α that might play an important role in the growth arrest of tumor cells and in the terminal differentiation caused by the expression of C/EBP. We used an in-house microarray [27] containing about 2,300 mouse liver cDNA clones. Poly(A)+ RNAs derived from FmCBa-14 and ras-NIH cells were subjected to Cy3 and Cy5 labeling, respectively, coupled with cDNA synthesis. Equal amounts of the two labeled cDNAs were mixed and then allowed to hybridize to the microarray. Reverse labeling with Cy3 and Cy5 was also done to correct for possible differences in the incorporation efficiency of these dyes. Table 1 lists the genes that showed at least 2.0-fold higher mRNA levels in FmCBa-14 cells in the microarray analysis.
The mRNA levels of 17 genes were increased in C/EBP α-transfected cells. No gene was found to be downregulated as a result of transfection of C/EBP α. To confirm the validity of the microarray analysis and these changes in mRNA levels in both FmCBa and FmCBb cells, we obtained primers specific for the 17 genes (Table 1), and performed Northern blot analysis using these probes (Figure 6). Of these genes, the mRNA levels of eight were elevated in both FmCBa and FmCBb cells as compared with those in ras-NIH cells or in control cells transfected with empty vector, including proteoglycan II (decorin), proteoglycan I (biglycan), amyloid precursor protein (APP), selenoprotein P (SePP), 3’-oxoacid CoA transferase (Oxct) and membrane protein TMS-2. The mRNA level of dixin-1 was increased mainly in FmCBb cells. Furthermore, the mRNA levels of some of other unknown genes were elevated predominantly in FmCBa cells.
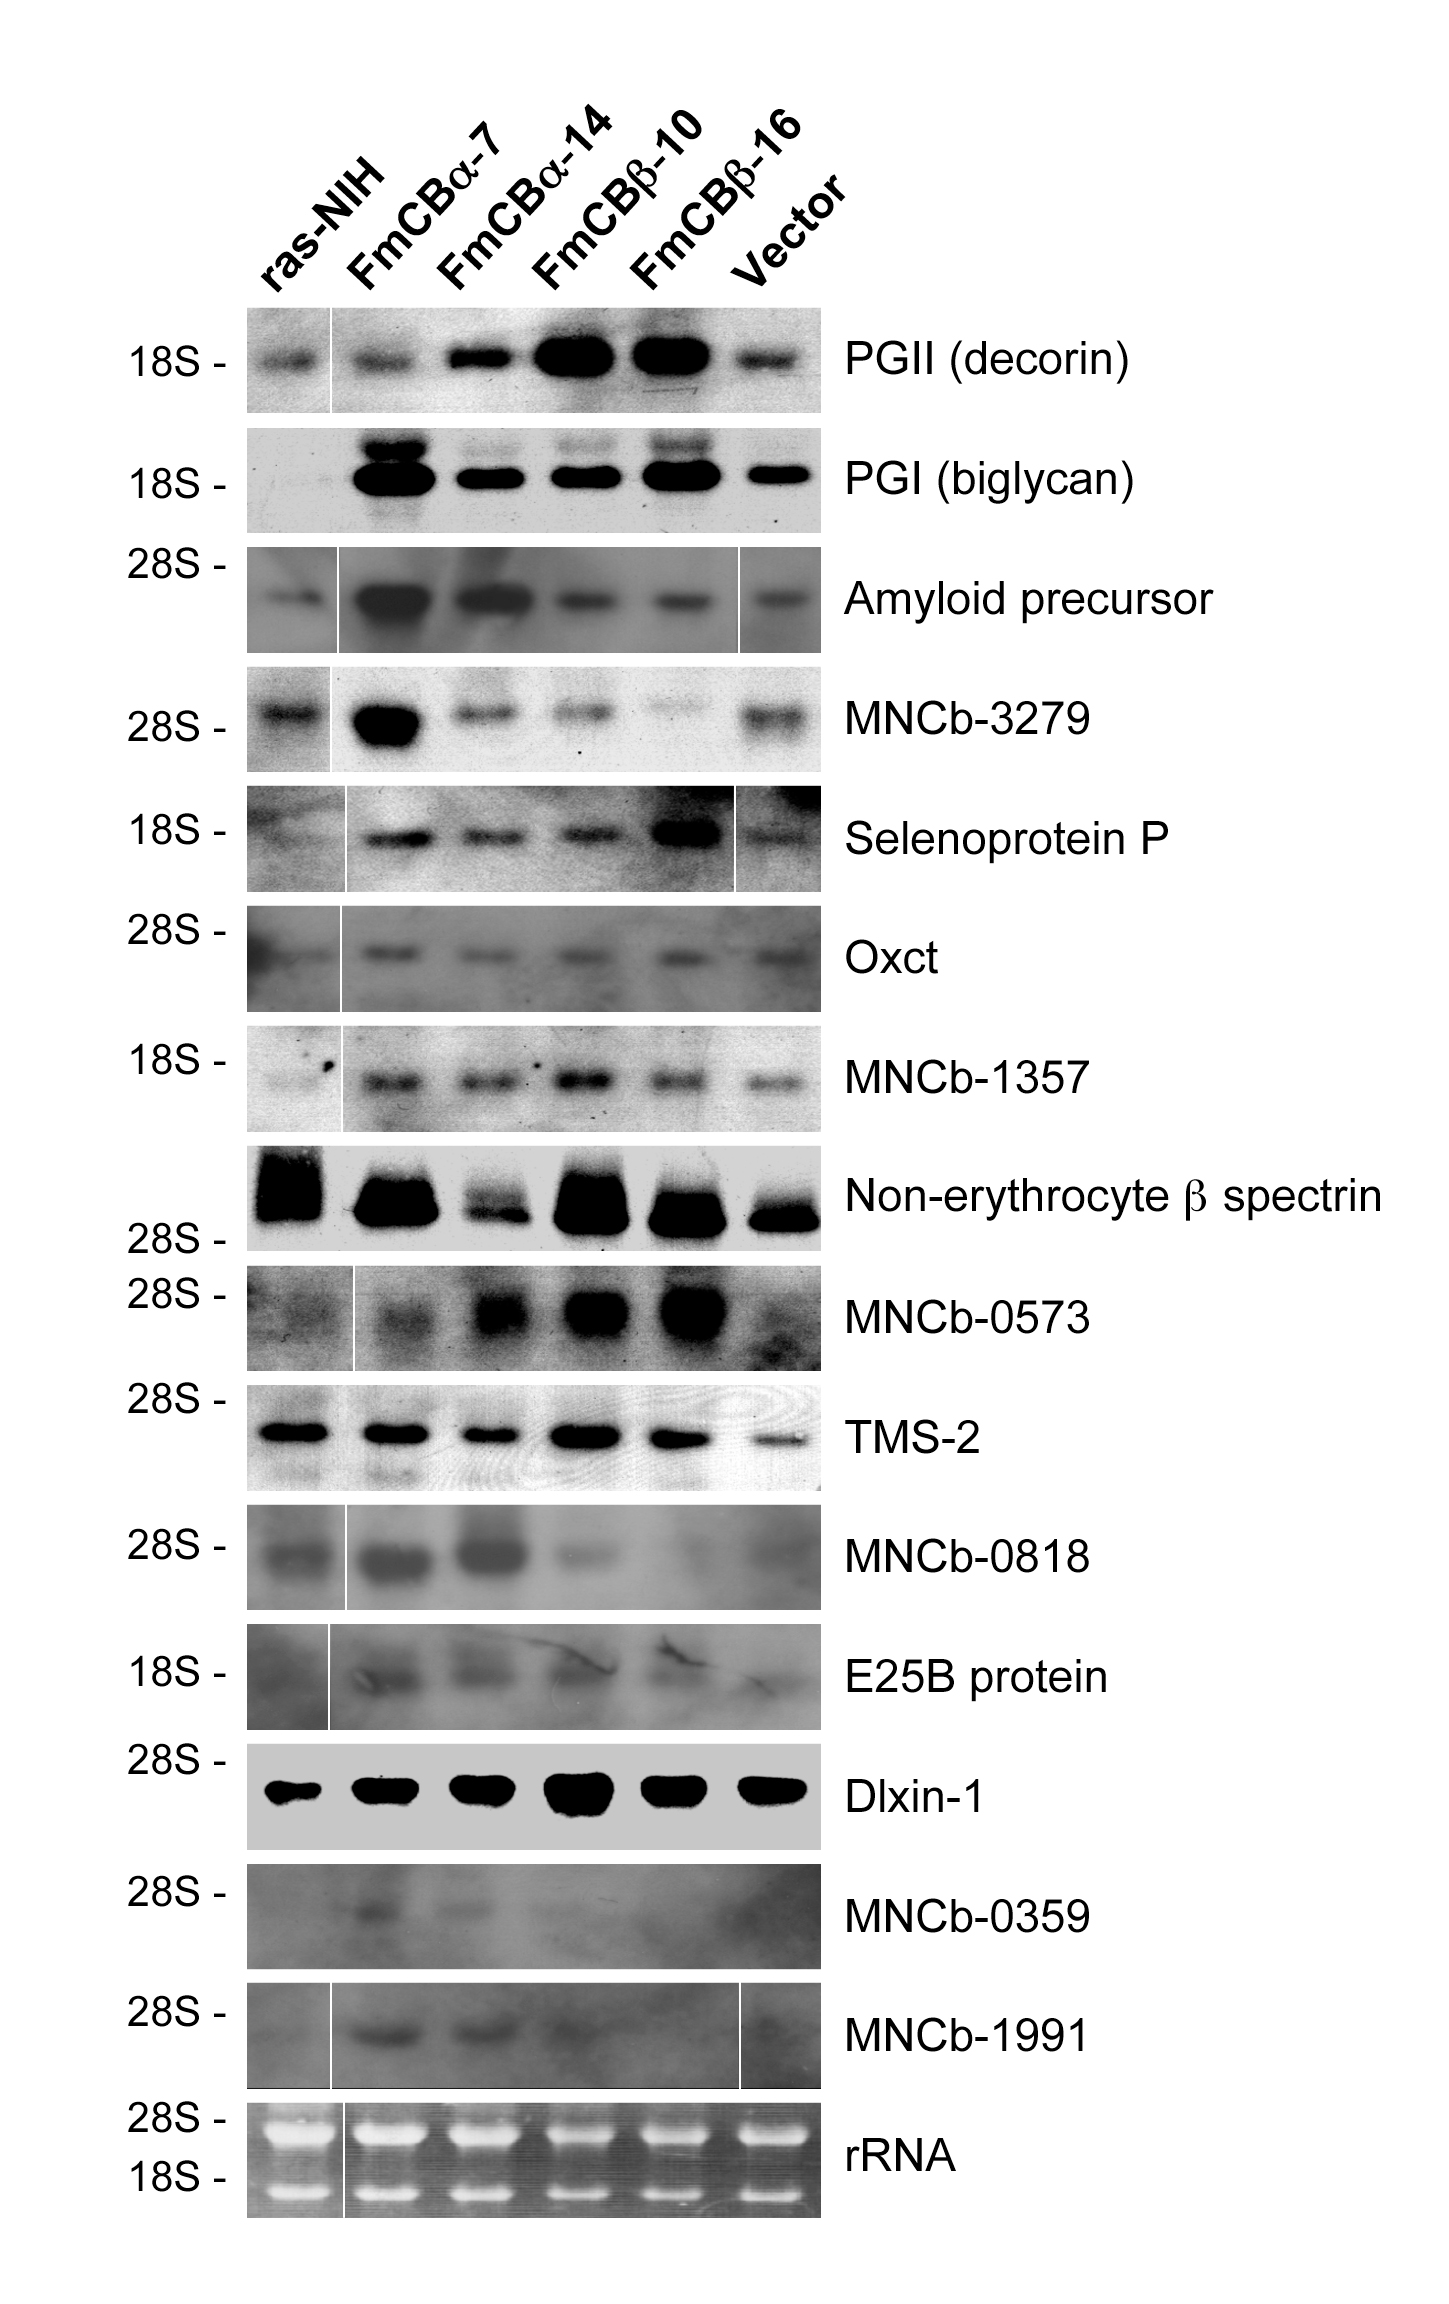
Figure 6. Northern blot analysis of C/EBP α-regulated genes identified by cDNA microarray analysis. Microarray analysis was done as described in Materials and Methods. Total RNAs were prepared from the indicated clones and analyzed for the mRNA expression by Northern blot analysis. Bottom panel shows typical fluorogram of ethidium bromide staining of rRNAs before blotting.
We have examined the effects of C/EBP α and C/EBPβon the phenotypes and gene expression. Enforced and stable expression of C/EBP α and C/EBPβin ras-NIH cells caused growth inhibition (Figure 2A and B), inhibition of colony-forming efficiency in soft agar medium (Figure 2C), cell cycle arrest (Figure 3), morphological change into flat revertant-like cells (Figure 4) and induction of adipogenic differentiation (Figure 5). The increase in mass of adipose tissue associated with obesity is known to result from an increase in the number and size of adipocytes. Zhang et al. have reported the role of CREB in transcriptional regulation of the C/EBPβgene during adipogenesis [31]. A dominant-negative variant of C/EBP disrupted the mitotic clonal expansion and differentiation of 3T3-L1 pre-adipocytes.
These phenotypic changes may be attributable to the alteration of gene expression, which was examined by cDNA microarray analysis (Table 1) followed by Northern blot analysis (Figure 6). We identified two genes encoding proteoglycans (PGII; decorin, PGI; biglycan), which are a class of sulfated glycoproteins of the extracellular matrix and cell surface that play a crucial role in the development and maintenance of neuronal systems by modulating axonal outgrowth, axonal branching and synaptogenesis [32]. Decorin and biglycan are small proteoglycans localized to the extracellular matrix of the artery wall that contain, respectively, two or one attachment sites for GAG (glycosaminoglycan) chains of the chondroitin/dermatan sulfate type [33]. Decorin binds to collagens type I, II and IV in vivo and promotes the formation of fibers with increased stability and changes in solubility. Furthermore, the decorin core protein binds to growth factors, including transforming growth factor-b (TGF-b), thereby inhibiting their bioactivity, and is a direct negative modulator of TGF-b synthesis. Decorin may directly interfere with the cell cycle via induction of the potent CDK inhibitor p21 [34]. There is mounting evidence that decorin inhibits the growth of various tumor cell lines. Santra et al. found that decorin causes functional inactivation of the oncogenic ErbB2 protein in breast carcinoma cells [35]. This leads to the growth inhibition and cytodifferentiation of mammary tumor cells and a concurrent suppression of their tumorigenic potential. Decorin may function as a natural antagonist of neoplastic cells enriched in ErbB2 and plays an anti-oncogenic role, as discussed below. We have recently reported that decorin is also upregulated by transfection with COUP-TFI which also showed similar growth-inhibitory potential as C/EBP α and C/EBPβin ras-NIH cells [36]. Thus, decorin may play a key role in growth inhibition as well as malignant transformation.
Amyloid-b protein precursor (APP) which is a membrane-bound protein ubiquitously expressed in a variety of cell types is cleaved by b- and g-secretase to generate a 4-kDa amyloid-b, and Alzheimer’s disease is characterized by the deposits of this amyloid-b peptide [37]. However, the biological functions of APP remain largely uncertain, particularly in tumors. Meng et al. have shown that APP is involved in the growth of human colon carcinoma cells [38]. Induction of apoptosis by a proteolytic peptide derived from APP was also reported [39].
Selenoprotein P (SePP), the major selenoprotein in plasma, has been implicated in selenium transport, selenium detoxification and antioxidant defense [40,41]. Calvo and co-workers have shown that SePP functions correlate with tumorigenicity and that there is a down-regulation of SePP in mouse and human tumors [42].
In conclusion, our understanding of the molecular basis underlying the growth inhibition caused by expression of members of the C/EBP family will be an important step towards differentiation and tumor suppression.
We are grateful to N. Seki (Department of Functional Genomics, Graduate School of Medicine, Chiba University), K. Hashimoto (National Institute of Infectious Diseases) and S. Sugano (Institute of Medical Sciences, University of Tokyo), for supporting the microarray analysis. We also thank T. Sekiya for Ha-ras-transformed NIH3T3 cells.
Grant in Aid from the Ministry of Education, Culture, Sports, Science and Technology of Japan.
The authors declare that they have no competing interests.
- Takiguchi M (1998) The C/EBP family of transcription factors in the liver and other organs. Int J Exp Pathol 79: 369-391.[Crossref]
- Roe JS, Vakoc CR (2014) C/EBP α: critical at the origin of leukemic transformation. J Exp Med 211: 1-4.
- van der Krieken SE, Popeijus HE, Mensink RP, Plat J (2015) CCAAT/Enhancer Binding Protein b in relation to ER Stress, Inflammation, and Metabolic Disturbances. Biomed Res Int 2015: 324815. [Crossref]
- Olive M, Williams SC, Dezan C, Johnson PF, Vinson C (1996) Design of a C/EBP-specific, dominant-negative bZIP protein with both inhibitory and gain-of-function properties. J Biol Chem 271: 2040-2047. [Crossref]
- Wang GL, Shi X, Salisbury E, Timchenko NA (2008) Regulation of apoptotic and growth inhibitory activities of C/EBP α in different cell lines. Exp Cell Res 314: 1626-1639. [Crossref]
- Cao Z, Umek RM, McKnight SL (1991) Regulated expression of three C/EBP isoforms during adipose conversion of 3T3-L1 cells. Genes Dev 51538-1552. [Crossref]
- Slomiany BA, D'Arigo KL, Kelly MM, Kurtz DT (2000) C/EBPα inhibits cell growth via direct repression of E2F-DP-mediated transcription. Mol Cel Biol 205986-5997. [Crossref]
- Song G, Wang L, Bi K, Jiang G (2015) Regulation of the C/EBP α signaling pathway in acute myeloid leukemia. Oncol Rep 2015: 3848.
- Pabst T, Mueller BU, Zhang P, Radomska HS, Narravula S, et al. (2001) Dominant-negative mutations of CEBPa, encoding CCAAT/enhancer binding protein-alpha (C/EBP α), in acute myeloid leukemia. Nat Genet 27: 263-270. [Crossref]
- Calkhoven CF, Muller C, Leutz A (2000) Translational control of C/EBP α and C/EBPβisoform expression. Gene Dev 14:1920-1932. [Crossref]
- Wang ND, Finegold MJ, Bradley A, Ou CN, Abdelsayed SV, et al. (1995) Impaired energy homeostasis in C/EBP α knockout mice. Science 269: 1108-1112. [Crossref]
- Porse BT, Pedersen TA, Xu X, Lindberg B, Wewer UM, et al. (2001) E2F repression by C/EBP α is required for adipogenesis and granulopoiesis in vivo. Cell 107: 247-258. [Crossref]
- Taub R (1996) Liver regeneration 4: transcriptional control of liver regeneration. FASEB J 10: 413-427. [Crossref]
- Lamb J, Ramaswamy S, Ford HL, Contreras B, Martinez RV, et al. (2003) A mechanism of cyclin D1 action encoded in the patterns of gene expression in human cancer. Cell 114: 323-334. [Crossref]
- Yu X, Si J, Zhang Y, Dewille JW (2010) CCAAT/Enhancer Binding Protein-delta (C/EBP-delta) regulates cell growth, migration and differentiation. Cancer Cell Int 10: 48. [Crossref]
- Timchenko NA, Harris TE, Wilde M, Bilyeu TA, Burgess-Beusse BL, et al. (1997) CCAAT/enhancer binding protein alpha regulates p21 protein and hepatocyte proliferation in newborn mice. Mol Cell Biol 17: 7353-7361. [Crossref]
- Iakova P, Awad SS, Timchenko NA (2003) Aging reduces proliferative capacities of liver by switching pathways of C/EBP α growth arrest. Cell 113: 495-506. [Crossref]
- Sekiya T, Fushimi M, Hori H, Hirohashi S, Nishimura S, et al. (1984) Molecular cloning and the total nucleotide sequence of the human c-Ha-ras-1 gene activated in a melanoma from a Japanese patient. Proc Natl Acad Sci USA 81: 4771-4775. [Crossref]
- Mizushima S, Nagata S (1990) pEF-BOS, a powerful mammalian expression vector. Nucleic Acids Res 18: 5322. [Crossref]
- Nishiyori A, Tashiro H, Kimura A, Akagi K, Yamamura K, et al. (1994) Determination of tissue specificity of the enhancer by combinatorial operation of tissue-enriched transcription factors: both HNF-4 and C/EBPβare required for liver-specific activity of the ornithine transcarbamylase enhancer. J Biol Chem 269: 1323-1331.[Crossref]
- Chowdhury S, Gotoh T, Mori M, Takiguchi M (1996) CCAAT/enhancer-binding protein b (C/EBPb) binds and activates while hepatocyte nuclear factor-4 (HNF-4) does not bind but represses the liver-type arginase promoter. Eur J Biochem 236: 500-509. [Crossref]
- Nabeya Y, Suzuki T, Furuya A, Koide N, Ohkoshi M, et al. (2011) Calpain regulates thymidylate synthase-5-fluoro-dUMP complex levels associated with response to 5-fluorouracil in gastric cancer cells. Cancer Sci 102: 1509-1515. [Crossref]
- Liu TL, Shimada H, Ochiai T, Shiratori T, Lin SE, et al. (2006) Enhancement of chemosensitivity toward peplomycin by calpastatin-stabilized NF-kB p65 in esophageal carcinoma cells: possible involvement of Fas/Fas-L synergism. Apoptosis 11: 1025-1037.
- Chomczynski P, Sacchi N (1987) Single-step method of RNA isolation by acid guanidinium thiocyanate-phenol-chloroform extraction. Anal Biochem 162: 156-159. [Crossref]
- Matsumoto E, Ishihara A, Tamai S, Nemoto A, Iwase K, et al. (2010) Time of day and nutrients in feeding govern daily expression rhythms of the gene for sterol regulatory element-binding protein (SREBP)-1 in the mouse liver. J Biol Chem 285: 33028-33036. [Crossref]
- Hiwasa T, Sawada T, Sakiyama S (1996) Synergistic induction of anchorage-independent growth of NIH3T3 mouse fibroblasts by cysteine proteinase inhibitors and a tumor promoter. J Biol Chem 271: 9181-9184. [Crossref]
- Yoshikawa T, Nagasugi Y, Azuma T, Kato M, Sugano S, et al. (2000) Isolation of novel mouse genes differentially expressed in brain using cDNA microarray. Biochem Biophys Res Commun 275: 532-537. [Crossref]
- Iwase K, Ishihara A, Yoshimura S, Andoh Y, Kato M, et al. (2014) The secretogranin II gene is a signal integrator of glutamate and dopamine inputs. J Neurochem 128: 233-245. [Crossref]
- Kozak M (1989) The scanning model for translation: an update. J Cell Biol 108: 229-241. [Crossref]
- Farmer SR (2006) Transcriptional control of adipocyte formation. Cell Metab 4: 263–273. [Crossref]
- Zhang YY, Li X, Qian SW, Guo L, Huang HY, et al. (2011) Transcriptional activation of histone H4 by C/EBPβduring the mitotic clonal expansion of 3T3-L1 adipocyte differentiation. Mol Biol Cell 22: 2165-2174. [Crossref]
- Huston JP, Weth K, De Souza Silva A, Junghans U, Muller HW, et al. (2000) Facilitation of learning and long-term ventral pallidal-cortical cholinergic activation by proteoglycan biglycan and chondroitin sulfate C. Neuroscience 100: 355-361. [Crossref]
- Fisher LW, Termine JD, Young MF (1989) Deduced protein sequence of bone small proteoglycan I (biglycan) shows homology with proteoglycan II (decorin) and several nonconnective tissue proteins in a variety of species. J Biol Chem 264: 4571-4576. [Crossref]
- >Kovanen PT, Pentikainen MO (1999) Decorin links low-density lipoproteins (LDL) to collagen: a novel mechanism for retention of LDL in the atherosclerotic plaque. Trends Cardiovasc Med 9: 86-91. [Crossref]
- Santra M, Eichstetter I, Iozzo RV (2000) An anti-oncogenic role for decorin. Down-regulation of ErbB2 leads to growth suppression and cytodifferentiation of mammary carcinoma cells. J Biol Chem 275: 35153-35161. [Crossref]
- Morii S, Kato M, Seki N, Shinmen N, Iwase K, et al. (2014) Inhibition of cell growth by nuclear receptor COUP-TFI: possible involvement of decorin in growth inhibition. Biochem Physiol S4: 001.
- Bandyopadhyay S, Rogers JT (2014) Alzheimer's disease therapeutics targeted to the control of amyloid precursor protein translation: maintenance of brain iron homeostasis. Biochem Pharmacol 88: 486-494. [Crossref]
- Meng JY, Kataoka H, Itoh H, Koono M (2001) Amyloid b protein precursor is involved in the growth of human colon carcinoma cell in vitro and in vivo. Int J Cancer 92: 31-39. [Crossref]
- Lu DC, Rabizadeh S, Chandra S, Shayya RF, Ellerby LM, et al. (2000) A second cytotoxic proteolytic peptide derived from amyloid beta-protein precursor. Nat Med 6: 397-404. [Crossref]
- Schomburg L, Schweizer U, Holtmann B, Flohe L, Sendtner M, et al. (2003) Gene disruption discloses role of selenoprotein P in selenium delivery to target tissues. Biochem J 370: 397-402. [Crossref]
- Méplan C, Hesketh J (2014) Selenium and cancer: a story that should not be forgotten-insights from genomics. Cancer Treat Res 159: 145-166. [Crossref]
- Calvo A, Xiao N, Kang J, Best CJ, Leiva I, et al. (2002) Alterations in gene expression profiles during prostate cancer progression: functional correlations to tumorigenicity and down-regulation of selenoprotein-P in mouse and human tumors. Cancer Res 62: 5325-5335. [Crossref]