Chronic kidney disease related mineral and bone disorders (CKD-MBD) cause significant morbidity and mortality. Guidelines for treatment and prevention of CKD-MBD have put focus on the treatment of secondary hyperparathyroidism in patients on hemodialysis by maintaining levels of parathormone (PTH) between 2 to 9 times the upper normal limit. However, levels of PTH are not always accurately correlated to the degree of bone remodeling, and some patients may suffer from hyperparathyroidism though their PTH levels are within the targets. Therefore, it is important to identify other bone markers that could help us adequately assess bone status in these patients, such as total alkaline phosphatase (TALP). In this case report, we describe a patient who suffered from poorly controlled hyperparathyroidism with very high levels of TALP despite having PTH levels within the targets. TALP could thus be an important bone marker and should be taken into consideration complementary to PTH when evaluating the bone status of a patient on dialysis.
CKD-MBD, bone markers, renal osteodystrophy, osteitis fibrosa, adynamic bone disease, secondary hyperparathyroidism
Chronic kidney disease related mineral and bone disorders (CKD-MBD) contribute to a greater risk for fractures and significant cardiovascular mortality in patients on dialysis [1-7]. These disorders may lead to a diverse set of bone manifestations, characterized by either low or high bone turnover states and abnormal or deficient bone structure and mineralization. These include osteitis fibrosa (where secondary hyperparathyroidism leads to high bone turnover), adynamic bone disease (where excessive suppression of parathyroid hormone leads to low bone turnover), osteomalacia (where vitamin D deficiency leads to abnormal bone metabolism) and mixed uremic osteodystrophy [3-7]. These patients may also suffer from osteoporosis, further complicating assessment and comprehension of their bone status.
In order to improve bone health in patients on dialysis, guidelines for treatment and prevention of CKD-MBD have focused on treatment of secondary hyperparathyroidism. The latest guidelines from kidney disease: Improving Global Outcomes (KDIGO) encourage lowering parathyroid hormone (PTH) levels by controlling hyperphosphatemia as well as using calcimimetics, calcitriol or vitamin D analogs [8]. High levels of PTH (>300 pg/mL) have been significantly associated with osteitis fibrosa whereas low levels (<150 pg/mL) are associated with adynamic bone disease [9].
KDIGO recommends maintaining PTH levels between 2 to 9 times the upper normal limit for the assay in patients on dialysis, which are the PTH levels most commonly associated with normal bone remodeling [8].
However, PTH levels are not always accurately correlated to the degree of bone remodeling [6,9]. In fact, some patients suffer from low turnover or high turnover bone diseases, documented by bone biopsies, although their PTH is within the targets set by KDIGO. In a study led by Barretto et al., 14% of patients with high turnover bone disease had intact PTH (iPTH) levels below 150 pg/mL and 38% of patients with low turnover bone disease had iPTH levels above 300 pg/mL [9]. Also, out of the 22 patients who had iPTH levels between 150 and 300 pg/mL, 6 had high turnover and 14 had low turnover bone disease. In another study by Sprague et al., the sensitivity and specificity of iPTH using KDIGO cutoffs were of 65% and 67.3% for low turnover disease; and 37% and 85,8% for high turnover disease [6]. These studies thus clearly demonstrate the limits of PTH in assessing bone disease.
Bone biopsy remains the gold standard for the diagnosis and classification of renal osteodystrophy. KDIGO recommends performing a bone biopsy when the knowledge of the type of renal osteodystrophy will impact treatment decisions [8]. Other indications include unexplained fractures, suspicion of osteomalacia, refractory hypercalcemia, an atypical response to standard therapies for elevated PTH or progressive decreases in BMD despite standard therapy. However, bone biopsies are rarely performed. A survey completed by members of the European Renal Association – European Dialysis and Transplant Association (ERA-EDTA) showed that bone biopsy is perceived as an invasive, painful, laborious but clinically useful procedure [10]. Furthermore, histomorphometric expertise is not widely available, complex, time-consuming and costly, which limits the use of bone biopsy. Interestingly, other than the usual indications for bone biopsies, a discordance between parathyroid hormone (PTH) and alkaline phosphatase levels was considered an indication for a bone biopsy by almost 50% of the respondents.
In fact, since it is sometimes difficult to determine if hyperparathyroidism is well controlled based solely on PTH levels, recent international guidelines suggest the use of other bone markers, such as serum total and bone-specific alkaline phosphatase (TALP and BALP respectively) [8,11]. The caveat of using TALP to assess bone turnover status is that other conditions, such as hepatic cholestasis, also cause increases in TALP. We can, however, use it as an alternative to BALP as long as gamma-glutamyl-transferase (GGT) is normal [5,7]. Though it would generally be expected that PTH and BALP move in the same direction with changes in bone turnover, these two markers can sometimes evolve in opposite directions [7]. Thus, high BALP with PTH levels within the targets could indicate uncontrolled secondary hyperparathyroidism, such as in the case of the patient described in this case report.
Our patient was a 61-year-old woman of Haitian origin. She was known for type 2 diabetes complicated by peripheral neuropathy, retinopathy and most importantly diabetic nephropathy causing end-stage renal disease for which she was on hemodialysis since April 2003. She also suffered from coronary artery disease, having had a coronary stent in 2013, and a multinodular goiter with Hurtle cells.
In January 2011, she developed secondary hyperparathyroidism. Her laboratory results indicated a PTH of 112.6 pmol/L (upper normal limit being 7.2 pmol/L) with a TALP of 279 U/L (35-125), a serum calcium of 2.41 mmol/L (corrected for an albumin at 34 g/L) and a serum phosphate of 2.01 mmol/L (Table 1). She was taking alphacalcidiol 0.25 mcg orally three times per week at the time. Since both her serum phosphate and calcium-phosphate product (4.81) were already high, it was decided to initiate cinacalcet 30 mg orally once daily instead of increasing her alphacalcidiol to treat her hyperparathyroidism. She appeared to respond well to the addition of cinacalcet, with her PTH subsequently decreasing to 35.7 pmol/L and reaching the targets set by KDIGO. Her TALP levels however remained high and even started to increase in March 2012, as can be seen in Figure 1.

Figure 1: Variations of TALP in time with adjustment of medication. IV: intravenously; OD: Once Daily; PO: Per os; TALP: Total Alkaline Phosphatase; Vit D3: vitamin D3
Table 1. Pertinent laboratory results to assess our patient’s bone status
Date |
TALP (U/L) |
GGT (U/L) |
PTH
(pmol/L) |
Calcium (mmol/L) |
Phosphorus (mmol/L) |
Vitamin D (25)OH
(nmol/L) |
Vitamin D 1,25(OH)
(pmol/L) |
27-01-2011 |
279
(35-125) |
29
(0-40) |
112.6
(1.6-7.2) |
2.41
(2.20-2.60) |
2.01
(0.70-1.40) |
- |
- |
06-12-2012 |
1772
(35-125) |
32
(0-40) |
26.2
(1.6-7.2) |
2.25
(2.20-2.60) |
1.21
(0.70-1.40) |
22.0
(23-113) |
33.0
(43-168) |
04-04-2013 |
1535
(35-125) |
35
(0-40) |
69.4
(1.6-7.2) |
2.31
(2.20-2.60) |
1.29
(0.70-1.40) |
45.8
(23-113) |
46.0
(43-168) |
02-05-2013 |
1691
(35-125) |
72
(0-40) |
18.2
(1.3-11.6) |
2.42
(2.20-2.60) |
1.00
(0.70-1.40) |
62.3
(23-113) |
65.0
(43-168) |
19-09-2013 |
647
(35-125) |
28
(0-40) |
291.8
(1.3-11.6) |
2.52
(2.20-2.60) |
0.73
(0.70-1.40) |
87.8
(23-113) |
201.0
(39-180) |
27-02-2014 |
92
(35-125) |
32
(0-40) |
48.4
(1.3-11.6) |
2.72
(2.20-2.60) |
1.31
(0.70-1.40) |
68.2
(23-113) |
114.0
(39-180) |
· Normal values set by the laboratory are indicated in parenthesis. Note that the normal levels for PTH changed between April and May 2013 and that the normal levels for vitamin D 1,25(OH) changed between May and September 2013.
· Values of calcium indicated in this table were all corrected for the corresponding value of albumin at the time.
· GGT: gamma-glutamyl-transferase; PTH: parathormone; TALP: total alkaline phosphatase |
During one of her hemodialysis sessions in the autumn of 2012, the patient complained of new bone pain.
At the time, her laboratory results were as follows:
- TALP at 1772 U/L (35-125)
- GGT at 32 U/L (0-40)
- PTH at 26.2 pmol/L (1.6-7.2)
- Calcium (Ca) 2.25 mmol/L (2.20-2.60), corrected for an albumin at 36 g/L
- Phosphate (P) 1.21 mmol/L (0.70-1.40)
- Ca x P 2.72
- Vitamin D 25(OH) 22.2 nmol/L (23-113)
- Vitamin D 1,25(OH) 33.0 pmol/L (35-125)
Given the low levels of both 1.25(OH) vitamin D and 25(OH) vitamin D, her alphacalcidol was switched to calcitriol 0.5 mcg given orally three times per week and vitamin D 10 000 IU taken orally once per week was initiated. This change was done based on literature that suggests that uremia in end-stage renal disease is associated with enzymatic hepatic dysfunction altering 25- hydroxylation of vitamin D3 [12]. Rauscher et al. demonstrated that calcitriol, which is the fully hydroxylated active form of vitamin D3, is more effective than alphacalcidol, which needs 25- hydroylation to be effective, in lowering serum PTH level in chronic hemodialysis patients [12].
These changes unfortunately did not lead to any significant improvement in her bone pain. In April 2013, her laboratory results showed:
- TALP at 1917 U/L (35-125)
- GGT at 72 U/L (0-40)
- PTH at 69 pmol/L (1.6-7.2)
- Ca 2.31 mmol/L (2.20-2.60), corrected for an albumin at 37 g/L
- P 1.29 mmol/L (0.70-1.40)
- Ca x P 2.90
- Vitamin D 25(OH) 45.8 nmol/L (23-113)
- Vitamin D 1,25(OH) 46.0 pmol/L (35-125)
Given the persistent bone pain coupled with a very high TALP, it was decided to complete the workup to further characterise her bone disorder. An alkaline phosphatase electrophoresis was performed, which confirmed that 97% of the TALP was of bone origin. Plain radiographs were also performed. Radiographs of her knees and hands were suggestive of hyperparathyroidism, with subperiostal resorption (Figure 2). The skull radiograph demonstrated a salt and pepper skull (Figure 2). Finally, radiographs of her spine showed a rugger jersey spine (Figure 4), a brown tumor at D12, as well as multiple vascular calcifications. Magnetic resonance imaging of her spine confirmed the presence of and better characterised the brown tumor (Figure 5). A bone scan ruled out Paget’s disease. It is to be noted that she did not undergo a bone biopsy due to lack of accessibility.
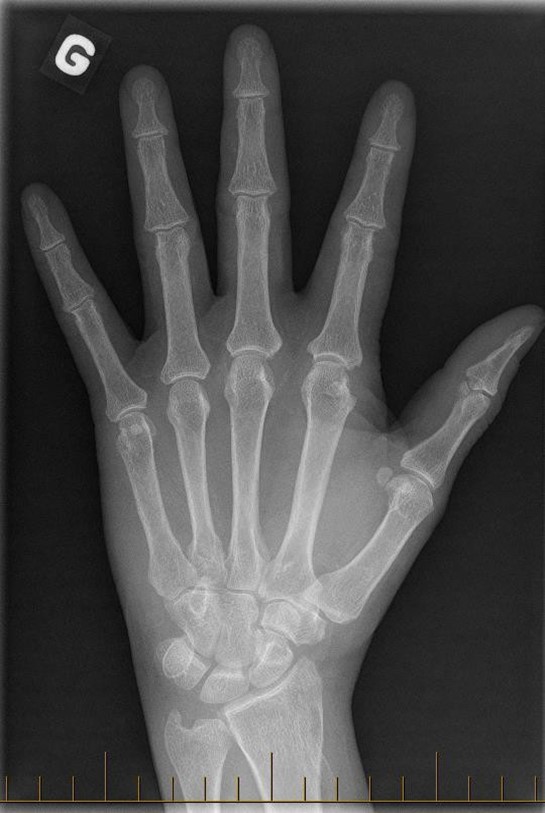
Figure 2: Radiograph of the patient’s left hand, showing subperiostal resorption of the middle phalanges
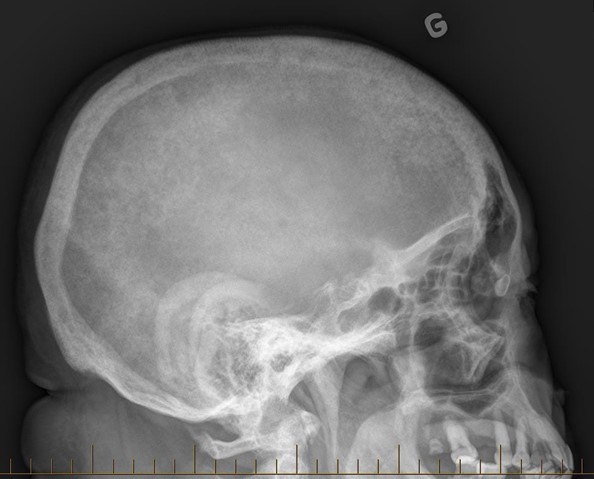
Figure 3: Radiograph of the patient’s skull, showing a salt and pepper skull
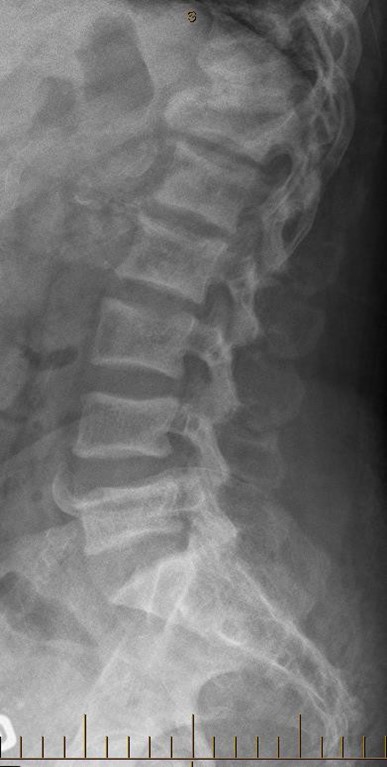
Figure 4: Radiograph of the patient’s spine, showing a rugger jersey spine
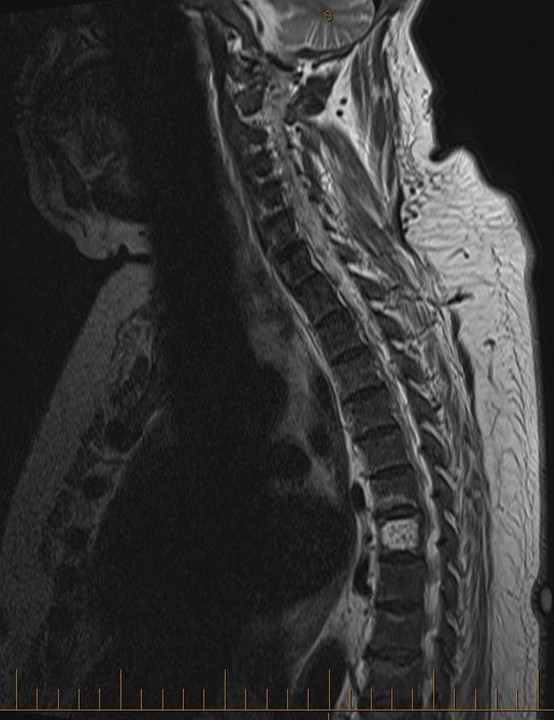
Figure 5: Magnetic resonance imaging of the patient’s spine, showing a brown tumor at D12
These investigations were highly suggestive of secondary hyperparathyroidism with high turnover bone disease. Since her calcium-phosphate product was now below 3 and her serum phosphate normalized, her calcitriol was increased from 0.5 to 1.5 mcg three times per week in an effort to decrease bone turnover.
One month later, her PTH decreased to 18 pmol/L (<2 times the upper normal limit which was 11.6 pmol/L at the time), indicating that her secondary hyperparathyroidism seemed controlled. Her calcium was then at 2.42 mmol/L (corrected for an albumin at 37 g/L) and thus could not have contributed to her PTH suppression (Table 1). However, her TALP was still elevated at 1681 U/L (Figure 1). Her calcitriol was subsequently increased to 2 mcg three times per week and her cinacalcet from 30 to 60 mg once a day. Surprisingly, her PTH increased significantly after this treatment adjustment, with a peak to 291 pmol/L in September 2013, as her TALP was lowering (Figure 6). Once again, her calcium at the time was at the upper normal limit (2.52 mmol/L, with an albumin at 40 g/L) and likely did not contribute to this rise in PTH.
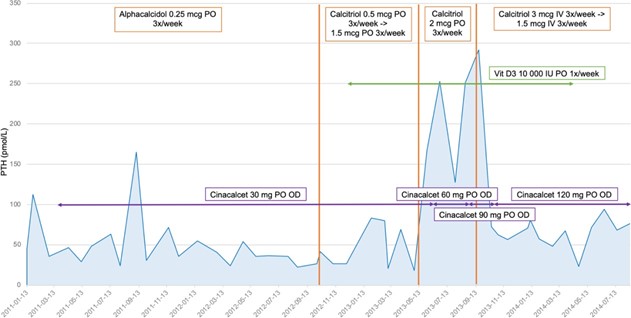
Figure 6: Variations of PTH in time with adjustment of medication. IV: intravenously; OD: Once Daily; PO: Per os; PTH: Parathormone; Vit D3: vitamin D3
Given ongoing bone pain and now elevated PTH, her treatment was subsequently adjusted with calcitriol given intravenously on dialysis and with progressive increases in the doses of calcitriol and cinacalcet, as can be seen in Figures 1 and 6. She responded adequately to treatment, as evidenced by a decrease in both TALP and PTH, as well as a significant decrease in her bone pain.
Primary hyperparathyroidism with normal PTH is well described in the literature [13-15], yet there is a paucity of data regarding secondary hyperparathyroidism with normal PTH levels. Wallace et al. have evoked multiple possible hypotheses to explain this phenomenon in primary hyperparathyroidism [13]. Pulsatile PTH secretion, post-translational modification of the PTH molecule affecting its measurement but not its function, presence of active PTH fragments that cannot be measured, and presence of antibodies interfering with the assay are possibilities. The most likely explanation according to Wallace et al., however, is a heightened peripheral sensitivity to normal PTH levels, though this has yet to be clearly demonstrated in the literature. Other possible theories include: a lower setpoint of PTH secretion, anatomic barriers in local circulation around a parathyroid adenoma that keep PTH high focally but low peripherally and possibly other hormones affecting PTH secretion and its variability [13]. Interestingly, Wallace et al., along with two others [13-15] have demonstrated that patients with primary hyperparathyroidism and normal PTH suffer from the same clinical consequences as patients with high PTH. This suggests that this entity is not simply an early stage of the disease.
We can thus wonder if our patient had unusual amounts of an active form of PTH which was not detected by our assay. In a case of severe primary hyperparathyroidism, Räkel et al. demonstrated that there was overproduction of an amino-terminal form of PTH (N-PTH), distinct from PTH (1-84) which is thought to be the active form [16]. This molecular form of PTH was not detected by the second-generation PTH assay, which is the assay currently used. However, the third generation PTH assay detected both the PTH (1-84) and N-PTH. PTH levels were therefore higher when measured with the third generation PTH assay compared to the second-generation PTH assay in the patient studied by Räkel et al.
The relationship between the level of PTH and underlying bone changes appears to be influenced by race, body mass index, nutritional as well as inflammatory status, and skeletal resistance to PTH which can be seen in the uremic state [17]. For the same value of PTH, low turnover bone disease is more prevalent in Afro-Americans [18]. PTH is also proportionally associated with BMI [19]. Malnutrition seems to affect the relationship between high PTH and bone disease as well, possibly lowering the adverse outcomes of high PTH [20]. However, these factors could not explain the PTH levels within the normal limits despite high turnover in our patient who was of Haitian origin and also had a high BMI. In addition, we know that factors such as the method of venous sampling may influence PTH levels in dialysis patients. PTH concentrations appear to be 30% higher in central line versus peripheral vein [21].
Curiously, once we started treating her hyperparathyroidism more aggressively, her PTH peaked although her calcium was normal and even closer to the upper normal limit. This has not been previously described in the literature and we believe it merits further evaluation. Our patient seemed to be compliant to her medication but we can wonder if she had missed a few doses of cinacalcet, which could explain this peak in PTH.
On the other hand, the discordance between levels of PTH and BALP in secondary hyperparathyroidism has already been noted by previous studies [22,23]. In a study by Delanaye et al., no significant correlation was found between the variations of PTH and TALP on a short (6 weeks) or long (52 weeks) period of time in patients on dialysis. That study showed that it was very frequent for PTH levels to be high while BALP levels were low and vice versa (51% and 81% of cases on a short and long period of time, respectively) [22]. Urena et al. conducted a study on 110 patients on dialysis which showed a dissociation between the BALP and PTH levels in 25% of patients. These patients had high BALP (>20 ng/mL) and definitive histological signs of hyperparathyroidism despite PTH values below 200 pg/mL (21 pmol/L) [23]. This study is the first and only other study we have found that suggests that a patient on hemodialysis may suffer from high turnover bone remodeling despite levels of PTH within the targets. As mentioned previously, a discordance between parathyroid hormone (PTH) and alkaline phosphatase levels was considered an indication for a bone biopsy by almost 50% of the respondents in a survey completed by ERA-EDTA members [10].
Furthermore, Sardiwal et al. have shown that BALP levels are much more stable with time and have a better correlation when compared to PTH for the diagnosis of secondary hyperparathyroidism in patients on dialysis [24]. Regidor et al. showed an association between higher serum alkaline phosphatase (especially if > 120 U/L) and poor survival in hemodialysis patients, independently of serum PTH [25]. This emphasizes the importance and usefulness of BALP when assessing bone status in patients on dialysis.
We describe a case of severe secondary hyperparathyroidism characterized by multiple bone complications despite having serum PTH levels within targets set by the latest KDIGO guidelines. As we have shown, high TALP with normal GGT or high BALP in a dialysis patient is suggestive of poorly controlled hyperparathyroidism though PTH levels may be only mildly elevated. We therefore suggest that the recommendation that PTH be maintained between 2 to 9 times the upper limit of normal should be individualized, taking into account other clinical and laboratory features which may indicate overt hyperparathyroidism in the absence of elevated serum PTH, such as TALP/BALP. Our case report should sensitize nephrologists to the possibility of secondary and maybe even tertiary hyperparathyroidism in hemodialysis patients despite PTH levels within the targets and emphasizes the importance of taking into consideration other bone markers such as TALP.
- Naylor KL, McArthur E, Leslie WD, Fraser LA, Jamal SA, et al. (2014) The three-year incidence of fracture in chronic kidney disease. Kidney Int 86: 810-818. [Crossref]
- Sardiwal S, Magnusson P, Goldsmith DJ, Lamb EJ (2013) Bone alkaline phosphatase in CKD-mineral bone disorder. Am J Kidney Dis 62: 810-822. [Crossref]
- Ureña P, De Vernejoul MC (1999) Circulating biochemical markers of bone remodeling in uremic patients. Kidney Int 55: 2141-2156. [Crossref]
- Delanaye P, Souberbielle JC, Lafage-Proust MH, Jean G, Cavalier E (2014) Can we use circulating biomarkers to monitor bone turnover in CKD haemodialysis patients? Hypotheses and facts. Nephrol Dial Transplant 29: 997-1004. [Crossref]
- Chiang C (2017) The use of bone turnover markers in chronic kidney disease-mineral and bone disorders. Nephrology (Carlton) 22 Suppl 2: 11-13. [Crossref]
- Sprague SM, Bellorin-Font E, Jorgetti V, Carvalho AB, Malluche HH, et al. (2016) Diagnostic Accuracy of Bone Turnover Markers and Bone Histology in Patients with CKD Treated by Dialysis. Am J Kidney Dis 67: 559-566. [Crossref]
- Jean G, Souberbielle JC, Granjon S, Lorriaux C, Hurot JM, et al. (2013) Bone biomarkers in haemodialysis patients: bone alkaline phosphatase or ß-Crosslaps?. Nephrol Ther 9: 154-159. [Crossref]
- Ketteler M, Block GA, Evenepoel P, Fukagawa M, Herzog CA, et al. (2017) Executive summary of the 2017 KDIGO Chronic Kidney Disease-Mineral and Bone Disorder (CKD-MBD) Guideline Update: what's changed and why it matters. Kidney Int 92: 26-36. [Crossref]
- Barreto FC, Barreto DV, Moysés RM, Neves KR, Canziani ME, et al. (2008) K/DOQI-recommended intact PTH levels do not prevent low-turnover bone disease in hemodialysis patients. Kidney Int 73: 771-777. [Crossref]
- Evenepoel P, D'Haese P, Bacchetta J, Cannata-Andia J, Ferreira A, et al. (2017) Bone biopsy practice patterns across Europe: the European renal osteodystrophy initiative-a position paper. Nephrol Dial Transplant 32: 1608-1613. [Crossref]
- Fukagawa M, Yokoyama K, Koiwa F, Taniguchi M, Shoji T, et al. (2013) Clinical practice guideline for the management of chronic kidney disease-mineral and bone disorder. Ther Apher Dial 17: 247-288. [Crossref]
- Rauscher S, Lafrance JP, Pichette V, Bell RZ, Desforges K, et al. (2017) Conversion of oral alfacalcidol to oral calcitriol in the treatment of secondary hyperparathyroidism in chronic hemodialysis patients. Int Urol Nephrol 49: 325-328. [Crossref]
- Wallace LB, Parikh RT, Ross LV, Mazzaglia PJ, Foley C, et al. (2011) The phenotype of primary hyperparathyroidism with normal parathyroid hormone levels: how low can parathyroid hormone go? Surgery 150: 1102-1112. [Crossref]
- Mischis-Troussard C, Goudet P, Verges B, Cougard P, Tavernier C, et al. (2000) Primary hyperparathyroidism with normal serum intact parathyroid hormone levels. QJM 93: 365-367. [Crossref]
- Amin AL, Wang TS, Wade TJ, Yen TW (2011) Normal PTH levels in primary hyperparathyroidism: still the same disease? Ann Surg Oncol 18: 3437-3442. [Crossref]
- Räkel A, Brossard JH, Patenaude JV, Albert C, Nassif E, et al. (2005) Overproduction of an amino-terminal form of PTH distinct from human PTH(1-84) in a case of severe primary hyperparathyroidism: influence of medical treatment and surgery. Clin Endocrinol (Oxf) 62: 721-727. [Crossref]
- Lamb EJ, Delaney MP (2014) Does PTH Offer Additive Value to ALP Measurement in Assessing CKD-MBD? Perit Dial Int 34: 687-691. [Crossref]
- Malluche HH, Mawad HW, Monier-Faugere MC (2011) Renal osteodystrophy in the first decade of the new millennium: analysis of 630 bone biopsies in black and white patients. J Bone Miner Res 26: 1368-1376. [Crossref]
- Drechsler C, Grootendorst DC, Boeschoten EW, Krediet RT, Wanner C, et al. (2011) Changes in parathyroid hormone, body mass index and the association with mortality in dialysis patients. Nephrol Dial Transplant 26: 1340-1346. [Crossref]
- Drechsler C, Krane V, Grootendorst DC, Ritz E, Winkler K, et al. (2009) The association between parathyroid hormone and mortality in dialysis patients is modified by wasting. Nephrol Dial Transplant 24: 3151-3157. [Crossref]
- Vulpio C, Bossola M, Speranza D, Zuppi C, Luciani G, et al. (2010) Influence of blood sampling site on intact parathyroid hormone concentrations in hemodialysis patients. Clin Chem 56: 489-490. [Crossref]
- Delanaye P, Dubois BE, Jouret F, Krzesinski JM, Moranne O, et al. (2013) Parathormone and bone-specific alkaline phosphatase for the follow-up of bone turnover in hemodialysis patients: is it so simple? Clin Chim Acta 417: 35-38. [Crossref]
- Urena P, Prieur P, Pétrover M (1996) Alkaline phosphatase of bone origin in hemodialyzed patients. 110 assays. Presse Med 25: 1320-1325. [Crossref]
- Sardiwal S, Gardham C, Coleman AE, Stevens PE, Delaney MP, et al. (2012) Bone-specific alkaline phosphatase concentrations are less variable than those of parathyroid hormone in stable hemodialysis patients. Kidney Int 82: 100-105. [Crossref]
- Regidor DL, Kovesdy CP, Mehrotra R, Rambod M, Jing J, et al. (2008) Serum alkaline phosphatase predicts mortality among maintenance hemodialysis patients. J Am Soc Nephrol 19: 2193-2203. [Crossref]
Editorial Information
Editor-in-Chief
Article type
Case Report
Publication History
Received: July 12, 2021
Accepted: July 28, 2021
Published: August 05, 2021
Copyright
©2021 Kachmar J. This is an open-access article distributed under the terms of the Creative Commons Attribution License, which permits unrestricted use, distribution, and reproduction in any medium, provided the original author and source are credited.
Citation
Kachmar J, Albert C, Dupuis M-E, Imbeault B, Vallee M (2021) A case of secondary hyperparathyroidism in a patient on hemodialysis with parathormone levels within the targets and high total alkaline phosphatase. Clin Med Rep 4: DOI: 10.15761/CMR.1000160.