Abstract
Purpose: The aim of this study was to compare fat oxidation and cardio-respiratory adaptations during exercise between non-obese OSA patients and controls matched for age, BMI and physical activity levels.
Method: Twelve recently diagnosed non-obese severe OSA patients (apnea-hypopnea index=39.1±21.0 events/hr, body mass index, BMI=27.8±2.3 kg.m-2) and twelve controls matched for age, BMI and physical activity levels were included in the study. Subjects underwent polysomnography, ultrasonography measurement of carotid intima-media thickness (CIMT) and biological measurements (lipid profile, glucose metabolism, hsCRP). Subjects performed a maximal progressive exercise test as well as a standardized exercise calorimetry test to assess maximal fat oxidation (MFO) and Lipoxmax.
Result: OSA patients presented greater right CIMT, blood levels of free fatty acids and hsCRP. However, maximal exercise capacity, MFO and Lipoxmax did not differ between groups.
Conclusion: Our results suggest that despite vascular remodeling indicating an increased cardiovascular risk, exercise capacity and fat oxidation are not altered in non-obese severe OSA patients when compared with controls matched for age, BMI and physical activity levels. Despite normal cardiorespiratory and metabolic exercise adaptations in non-obese OSA patients, exercise training should not be neglected to limit the well-known development of cardio-metabolic morbidity.
Abbreviations
AHI: Apnea-hypopnea index, BMI: Body mass index, CIMT: carotid intima-media thickness, CPAP: Continuous positive airway pressure, FFA: free fatty acids, HOMA2-IR: Homoeostasis model assessment for insulin resistance, hsCRP: High sensitive c reactive protein, MFO: Maximal fat oxidation, OSA: Obstructive sleep apnea, VO2peak: Peak aerobic capacity
Introduction
Obstructive sleep apnoea (OSA) syndrome is a common chronic sleep disorder characterized by repetitive episodes of upper airway obstruction during sleep [1]. OSA has been independently associated with hypertension and metabolic consequences [2]. This can potentially contribute to impairing cardiovascular, ventilatory and metabolic responses to exercise [3]. Previous studies conducted over the past decade have found conflicting results regarding peak aerobic capacity (VO2peak) in OSA patients [4-8]. In fact, there is evidence that sleep apnoea impairs exercise capacity as shown by lower maximal oxygen consumption, maximal workload and abnormal cardiovascular responses. Two more recent studies have provided more conflicting results. On one hand, Rizzi et al.’s study examining exercise capacity in lean and obese OSA patients compared with non-OSA lean and obese controls provides evidence suggesting that OSA alone does not impair cardiorespiratory fitness [9]. These authors also observed in another study that cardiorespiratory fitness was not impaired in sedentary lean moderate OSA subjects [10]. On the other hand, Mansukhani et al. recently showed an independent association between the severity of sleep-disordered breathing and reduced exercise capacity, after adjusting for known confounders (i.e. obesity and cardiopulmonary disease) [11].
The metabolic complications related to OSA (Levy et al., 2009) [2] associated to the increased cardiovascular risk can alter substrate utilization during exercise and alter endurance capacity as shown in obesity [12]. A recent study in OSA patients with type 2 diabetes and/or the metabolic syndrome found that OSA severity correlated with decreased fat oxidation [13]. However, a study examining healthy, non-obese participants exposed to chronic intermittent hypoxia, showed increased fat oxidation and unaltered exercise capacity [14].
In light of these results, we aimed to compare maximal exercise capacity and substrate balance (i.e. fat oxidation) during exercise in recently diagnosed untreated non-obese severe obstructive sleep apnea patients with controls matched for age, BMI and physical activity levels.
Method
Subject
A total of 24 consecutive male subjects underwent baseline screening before being potentially included in the study. Twelve inactive non-obese patients recently diagnosed with OSA (AHI>30 events.h-1, measured within 3 months of inclusion) and 12 controls (AHI<5 events.h-1) matched for age, BMI and physical activity levels volunteered to participate. The local Human Research Ethics Committee approved this study. Exclusion criteria were: age <18 or > 65 years, BMI>30 kg.m-2, AHI between 5 and 30 events.h-1, level of physical activity determined with Voorips score > 9, which corresponds to the threshold beyond which individuals are no longer considered inactive [15], alcohol consumption > 5 units/day, tobacco consumption, unstable cardiovascular and/or hepatic disease, treatment for cholesterol and/or vasoactive treatment.
Polysomnography
Measurement of sleep apnoea–hypopnoea was performed by full overnight polysomnography and analyzed as previously described [16]. Measurements of respiratory events were made by a sleep specialist according to the American Academy of Sleep Medicine guidelines [17]: apnoea (> 90% nasal flow reduction for ≥ 10 s) and hypopnoea (≥50% reduction in nasal flow associated with ≥ 3% desaturation). None of these patients were being treated with a continuous positive airway pressure mask. Subjective sleepiness was assessed using the Epworth Sleepiness Score [18].
Cardiovascular measurements
Ultrasonography measurement of carotid intima-media thickness (CIMT) was performed by the same experienced cardiologist after an overnight fast. B-mode ultrasonography was performed with a HP Sonos 2500 (Hewlett Packard, UK) system using a sectorial probe of 7.5 MHz with axial and lateral resolution of 0.15 mm. The methodology used to determine right and left CIMT, the carotid lumen diameter has previously been described [19]. A plaque was defined as an echogenic structure encroaching into the vessel lumen with a distinct area and with a CIMT more than 50% greater than those of the neighboring sites.
Maximal exercise test
Subjects performed a maximal progressive exercise test to exhaustion on an electromagnetic cycle ergometer (Ergoselect, Medisoft, Dinant, Belgium). Exercise began at 40 W and power output was increased by 20 W every minute until exhaustion. ECG, heart rate (HR) (ECG, Schiller, CardioLaptop AT-110, Switzerland) and gas exchange (Ergocard, Medisoft, Belgium) were monitored. Peak VO2 was defined as the highest VO2 that could be sustained for at least 30 s during the last stage of cycling exercise.
Submaximal exercise indirect calorimetry
Procedure
All subjects completed a submaximal exercise test in the morning, after an overnight fast. A 2-min recording of resting ventilation and respiratory exchange ratio parameters was performed to obtain stable values followed by the submaximal exercise test. The test followed the procedures of Brun et al. [20]. A 3-min warm-up at 20% was followed by four 6-min steady-state workloads at 30, 40, 50 and 60% of their maximal aerobic power, previously determined during the maximal exercise test. In order to avoid gas exchange disturbances linked to hyperventilation during exercise, subjects were not allowed to start cycling if RER was greater than 0.85.
Determination of metabolic indices during exercise
The Lipoxmax is the exercise intensity at which lipid oxidation induced by increasing intensity reaches a maximum (maximal fat oxidation rate: MFO) and after which it decreases as carbohydrates becomes the predominant fuel. MFO and Lipoxmax were assessed using indirect calorimetry. Calculation of carbohydrate and lipid oxidation rates was assessed from gas exchange measurements during the last minute of each workload period and according to the non-protein respiratory quotient technique as described previously [20,21].
Biological measurements
A venous blood sample was obtained to measure lipid profile, plasma glucose, HbA1C, hsCRP, insulin resistance (homoeostasis model assessment for insulin resistance or HOMA2-IR) that was calculated by the HOMA2 program [22], in the morning after a 12-h fast. Plasma glucose, triglycerides and cholesterol concentrations were determined using enzymatic colorimetric methods on a Modular® analyzer (Roche Diagnostics). LDL-cholesterol was calculated using the Friedewald formula [Total cholesterol − (HDLcholesterol + triglycerides/5)]. Serum insulin was measured by immunoradiometric assay (Bis-Insulin IRMA®, CisBio, France). Serum high-sensitive CRP (hsCRP) was measured by immunonephelometry using a BN2 automated system (Dade Berhing, USA).
Statistical analysis
Data are reported as mean ± SD. T-tests were used to compare OSA and controls when normality and equality of variance were reached. Otherwise, a non-parametric Mann & Whitney test was performed. Statistical significance was set at p < 0.05.
Result
Participants’ characteristics
Baseline anthropometric, clinical and polysomnographic characteristics are presented in Table 1. OSA patients were non obese (BMI=27.8 ± 2.3 kg.m-2) but presented severe OSA evidenced by an AHI of 39.1 ± 21.0 events.h-1, an Epworth score of 11.9 ± 4.5 and a minimal nocturnal SaO2 of 81.6 ± 9.8%. Despite no difference in blood pressure compared to controls, OSA patients exhibited greater right carotid intima-media thickness (CIMT). OSA presented higher free fatty acids (FFA) and hsCRP (Figure 1, Table 1).
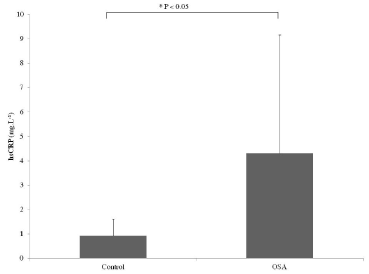
Figure 1. Difference in C-reactive protein levels between OSA and control participants
* P < 0.05 versus control group
Table 1. Baseline anthropometric, clinical, polysomnographic data
|
Control (n=12) |
OSA(n=12) |
Anthropometric Data |
|
|
Age (years) |
47.3 ± 6.8 |
49.4 ± 8.4 |
BMI (kg.m-2) |
25.5 ± 3.8 |
27.8 ± 2.3 |
Waist/hip ratio |
0.98 ± 0.04 |
0.99 ± 0.10 |
Blood pressure |
|
|
SBP (mm Hg) |
128 ± 14 |
131 ± 13 |
DBP (mm Hg) |
80 ± 14 |
86 ± 9 |
Intima-media thickness |
|
|
Right CIMT (µm) |
543 ± 71 |
664 ± 153 * |
Left CIMT (µm) |
639 ± 142 |
711 ± 188 |
Biological Parameters |
|
|
Glucose (mmol.L-1) |
5.14 ± 0.37 |
5.47 ± 0.67 |
Insulin (µUI.mL-1) |
6.15 ± 2.07 |
7.24 ± 3.03 |
HOMA % B |
75.2 ± 15.1 |
75.5 ± 25.2 |
HOMA % S |
135.6 ± 40.9 |
127.8 ± 64.6 |
HOMA-2 IR |
0.80 ± 0.27 |
0.95 ± 0.43 |
HbA1c (%) |
5.39 ± 0.25 |
5.62 ± 0.55 |
HDL-c (g.L-1) |
0.54 ± 0.11 |
0.52 ± 0.12 |
LDL-c (g.L-1) |
1.33 ± 0.27 |
1.27 ± 0.21 |
Total cholesterol (g.L-1) |
2.12 ± 0.23 |
2.00 ± 0.26 |
Triglycerids (g.L-1) |
1.23 ± 0.66 |
1.02 ± 0.47 |
FFA (mmol. L-1 ) |
274 ± 88 |
5.3 ± 3.5 |
Polysomnography Data |
|
|
AHI (events/h of sleep) |
5.2 ± 4.5 |
39.1 ± 21.0 * |
Mean nocturnal SaO2 (%) |
94.2 ± 1.5 |
93.0 ± 2.1 |
Minimal nocturne SaO2 (%) |
90.3 ± 1.5 |
81.6 ± 9.8 * |
Epworth sleepiness score |
7.1 ± 5.7 |
11.9 ± 4.5 * |
Physical Activity |
|
|
Voorips score |
6.3 ± 6.6 |
5.3 ± 3.5 |
BMI: body mass index; SBP: systolic blood pressure; DBP: diastolic blood pressure; HR: heart rate; CIMT: carotid
intima media thickness; HOMA2-IR: homoeostasis model assessment for insulin resistance; HOMA2-%S: insulin
sensitivity; HOMA2-%B: steady-state beta cell function; AHI: apnoea-hypopnea index; SaO2: oxygen saturation.
Wmax: maximal power output; * P < 0.05 versus control group.
Maximal and sub-maximal exercise tests
Cardiorespiratory fitness did not differ between groups, as evidenced by similar VO2peak and maximal power output values (Table 2). Both groups presented % predicted VO2peak values, above 100%. Moreover, substrate utilization during submaximal exercise did not differ (Table 2, Figure 2).
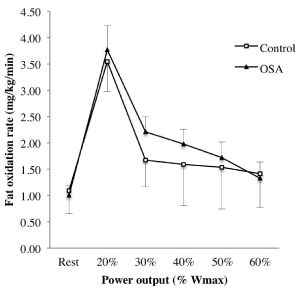
Figure 2. Fat oxidation rate during submaximal exercise in OSA (triangle) and control (square) participants
Table 2. Exercise data
| |
|
Control (n=12) |
OSA(n=12) |
Maximal Exercise Test |
|
|
|
VO2peak (L.min-1) |
|
3.1 ± 0.8 |
3.1 ± 0.6 |
VO2peak (%predicted) |
|
114.2 ± 18.0 |
120.3 ± 40.4 |
Wmax (W) |
|
232.1 ± 49.8 |
203.8 ± 57.5 |
Power output at VT (W) |
|
130.9 ± 38.6 |
121.9 ± 12.1 |
Wmax (%predicted) |
|
113.1 ± 14.6 |
106.5 ± 31.2 |
HRmax (bpm) |
|
174.3 ± 6.9 |
168.7 ±10.6 |
HRmax (%predicted) |
|
97.3 ± 4.2 |
94.2 ± 5.5 |
Maximal lactate (mmol. L-1) |
|
8.8 ± 2.2 |
8.9 ± 1.9 |
Exercise calorimetry |
|
|
|
Lipoxmax (W) |
|
89.4 ± 38.9 |
76.5 ± 27.5 |
Lipoxmax (%Wmax) |
|
37.6 ± 16.6 |
39.5 ± 11.2 |
Maximal fat oxidation (mg.min-1) |
|
281.0 ± 93.3 |
289.5 ± 103.6 |
Maximal fat oxidation (mg.kg-1.min-1) |
|
3.5 ± 1.4 |
3.4 ± 1.1 |
VT: ventilatory threshold; Wmax: maximal power output; HRmax: maximal heart rate.
Discussion
The main result of the present study was that recently diagnosed untreated non-obese severe obstructive sleep apnea patients show altered lipid profile, inflammation and signs of cardiovascular remodeling, but no decrease in fat oxidation or maximal exercise performance when compared with controls matched for age, BMI and physical activity levels.
Study participants were representative of a typical middle-aged, non-obese OSA population presenting some cardio-vascular and metabolic co-morbidities. Rizzi et al. examined exercise capacity and blood parameters in lean patients with moderate OSA and found that they presented greater glycemia and cervical circumference when compared with non-OSA controls [10]. Another recent study showed an association between OSA and altered glucose and lipid metabolism, independent of the effects of obesity, gender and age in over 1,000 patients with OSA [23].
Cardiorespiratory fitness
Previous studies have reported conflicting results regarding cardiorespiratory fitness in OSA patients. Some have found no difference in exercise capacity [4-8]. Tonini et al. [14] used a model of chronic intermittent hypoxia to mimic that seen in OSA in healthy patients and also reported unaltered maximal exercise capacity.
A study in children showed specific and independent effects of OSA on cardiorespiratory fitness [24]. Lower peak cardiac output was observed in children with OSA. However, this result is intriguing because even though peak oxygen consumption expressed in mL.kg-1. min-1 was lower in OSA patients compared with non-OSA, when VO2peak was expressed in L. min-1, it was unaltered.
Body mass index and male sex associated with type 2 diabetes have been shown to be independent predictors of (measured on a treadmill) in a study comparing obese and non-obese OSA patients to obese and non-obese patients without OSA [9]. Furthermore, authors reported VO2max in mL.kg-1.min-1 which does not necessarily reflect lower aerobic fitness [25]. Conversely, an independent association has been observed between the severity of sleep-disordered breathing and reduced exercise capacity, after adjusting for known confounders in a large cross-sectional study (i.e. obesity and cardiopulmonary disease) [11].
Conflicting results observed to date are likely attributable to differences in patient populations (age, severity of OSA, habitual level of physical activity and duration of exposure to OSA), differences in the determination of cardiorespiratory fitness (treadmill versus cycle ergometer) and interpretation of results (per unit of body weight vs lean mass vs predicted values). In addition, it may be due to the fact that despite involving a great number of participants, these studies are mostly correlational. Even though we included a small sample of patients, the major strengths of our study are the following: our two groups were matched according to habitual physical activity, peak aerobic capacity was directly assessed (as opposed to Mansukhani et al.’s study which used a nomogram) during a standardized weight supported exercise (i.e. cycling exercise), peak aerobic capacity was reported in absolute units or as a percentage of predictive values and lastly, the OSA group we recruited was severe but not yet treated for OSA. However, we cannot exclude the possibility that the absence of alteration in peak capacity in our group is due to a short exposition to OSA in our OSA group.
Fat oxidation
Substrate utilization during exercise has been scarcely documented in OSA patients. Research in this area may provide clinical applications for improving metabolic health and reducing OSA-related complications with exercise training. Lipoxmax and MFO did not differ between OSA patients and controls indicating that fat oxidation was not altered in OSA patients. A recent study in OSA patients with type 2 diabetes and/or the metabolic syndrome showed that the severity of OSA aggravated the well-known impairment of fat oxidation during exercise in this population [13]. However, the patients in this study were obese and presented metabolic co-morbidities (i.e. type 2 diabetes, metabolic syndrome), which are known physiological modifiers of substrate balance during exercise and have been shown to shift MFO and Lipoxmax to lower intensities [26]. In our study, OSA patients were non-obese and free of type 2 diabetes but presented vascular remodeling compatible with the early independent effects of OSA and early signs of inflammation (increased hsCRP). Therefore, even in the presence of early markers of cardiovascular risk, the OSA patients in our study did not present impaired lipid oxidation during exercise.
It could also be hypothesized that lipid oxidation during exercise is not sensitive enough to detect early metabolic alterations. The only metabolic abnormality reported in the OSA patients included in our study is higher level of FFA at rest despite similar BMI and waist/hip ratio with controls. This could be the result of different body composition between groups (i.e. increased fat mass in OSA patients), which was not measured in the present study. The progression of OSA complications seems to be variable; in the present study we observed early signs of inflammation (greater hsCRP) and vascular remodeling while metabolic modifications seem to be delayed as we did not observe modified fat oxidation during exercise.
Finally, to conclude on physical fitness as a whole, it is possible, as suggested by studies comparing OSA obese to non OSA obese subjects [8] or treating apnea [27] that OSA is an aggravating factor of obesity and metabolic syndrome or diabetes regarding impairment of aerobic capacity or substrate oxidation balance during submaximal exercise.
Practical implications
Our results showed that untreated non-obese severe obstructive sleep apnea patients present unaltered maximal exercise response and lipid oxidation during submaximal exercise. However, these patients showed signs of early cardio-vascular remodeling (increased intima media thickness), metabolic abnormalities and inflammation.
The first line therapy of OSA is continuous positive airway pressure (CPAP), however its effects on cardio-metabolic abnormalities markers associated with OSA (visceral obesity, insulin-resistance, lipid profile) are limited [28]. Physical activity has been associated with reduced incidence and severity of sleep-disordered breathing in longitudinal and cross-sectional studies [29-32]. It can also positively influence these cardio-metabolic risk markers. Thus, a combined approach integrating CPAP and physical activity programs can improve symptoms of OSA as well as prevent the progression of cardiometabolic abnormalities that are frequently associated with OSA.
Conclusion
This study demonstrates signs of cardiovascular remodeling but no modification of substrate utilization during exercise, in non-obese patients with severe OSA. Although our study cannot be interpreted as definitive evidence of the sequence of pathophysiological events in the cardiovascular morbidity associated with OSA, our results suggest that early intimal changes precede changes in substrate utilization.
Disclosure of interest
All authors have read and approved of the manuscript. The authors have not declared any conflicts of interest.
Acknowledgement
This research was supported by a grant from the clinical research board of the Grenoble University Hospital (DRCI).
References
- Horner RL (2008) Pathophysiology of obstructive sleep apnea. J Cardiopulm Rehabil Prev 28: 289-298. [Crossref]
- Levy P, Bonsignore MR, Eckel J (2009) Sleep, sleep-disordered breathing and metabolic consequences. Eur Respir J 34: 243-260. [Crossref]
- Aron A, Zedalis D, Gregg JM, Gwazdauskas FC, Herbert WG (2009) Potential clinical use of cardiopulmonary exercise testing in obstructive sleep apnea hypopnea syndrome. Int J Cardiol 132: 176-186. [Crossref]
- Alonso-Fernandez A, Garcia-Rio F, Arias MA, Mediano O, Pino JM, et al. (2006) Obstructive sleep apnoea-hypoapnoea syndrome reversibly depresses cardiac response to exercise. Eur Heart J 27: 207-215. [Crossref]
- Hargens TA, Guill SG, Zedalis D, Gregg JM, Nickols-Richardson SM, et al. (2008) Attenuated heart rate recovery following exercise testing in overweight young men with untreated obstructive sleep apnea. Sleep 31: 104-110. [Crossref]
- Kaleth AS, Chittenden TW, Hawkins BJ, Hargens TA, Guill SG, et al. (2007) Unique cardiopulmonary exercise test responses in overweight middle-aged adults with obstructive sleep apnea. Sleep Med 8: 160-168. [Crossref]
- Lin CC, Hsieh WY, Chou CS, Liaw SF (2006) Cardiopulmonary exercise testing in obstructive sleep apnea syndrome. Respir Physiol Neurobiol 150: 27-34. [Crossref]
- Vanhecke TE, Franklin BA, Zalesin KC, Sangal RB, deJong AT, et al. (2008) Cardiorespiratory fitness and obstructive sleep apnea syndrome in morbidly obese patients. Chest 134: 539-545. [Crossref]
- Rizzi CF, Cintra F, Mello-Fujita L, Rios LF, Mendonca ET, et al. (2013) Does obstructive sleep apnea impair the cardiopulmonary response to exercise? Sleep 36: 547-553. [Crossref]
- Rizzi CF, Cintra F, Risso T, Pulz C, Tufik S, et al. (2010) Exercise capacity and obstructive sleep apnea in lean subjects. Chest 137: 109-114. [Crossref]
- Mansukhani MP, Allison TG, Lopez-Jimenez F, Somers VK, Caples SM (2013) Functional aerobic capacity in patients with sleep-disordered breathing. Am J Cardiol 111: 1650-1654. [Crossref]
- Perez-Martin A, Raynaud E, Mercier J (2001) Insulin resistance and associated metabolic abnormalities in muscle: effects of exercise. Obes Rev 2: 47-59. [Crossref]
- Desplan M, Brun JF, Pillard F, Fedou C, Prefaut C, et al. (2012) Decreased fat oxidation during exercise in severe obstructive sleep apnoea syndrome. Diabetes Metab 38: 236-242. [Crossref]
- Tonini J, Michallet AS, Flore P, Nespoulet H, Pepin JL, et al. (2011) Effect of chronic intermittent hypoxia on exercise adaptations in healthy subjects. Respir Physiol Neurobiol 179: 287-293. [Crossref]
- Voorrips LE, Ravelli AC, Dongelmans PC, Deurenberg P, Van Staveren WA (1991) A physical activity questionnaire for the elderly. Med Sci Sports Exerc 23: 974-979. [Crossref]
- Monneret D, Tamisier R, Ducros V, Garrel C, Levy P, et al. (2012) The impact of obstructive sleep apnea on homocysteine and carotid remodeling in metabolic syndrome. Respir Physiol Neurobiol 180: 298-304. [Crossref]
- Force AA (1999) Sleep-related breathing disorders in adults: recommendations for syndrome definition and measurement techniques in clinical research. The Report of an American Academy of Sleep Medicine Task Force. Sleep 22: 667-689. [Crossref]
- Johns MW (1991) A new method for measuring daytime sleepiness: the Epworth sleepiness scale. Sleep 14: 540-545. [Crossref]
- Baguet JP, Moreau-Gaudry A, Siche JP, Douchin S, Tremel F, et al. (2000) Carotid remodeling in essential hypertension: role of blood pressure, indexed parameters, and association with cardiac mass and aortic stiffness. Clin Exp Hypertens 22: 717-729. [Crossref]
- Brun JF, Jean E, Ghanassia E, Flavier S, Mercier J (2007) Metabolic training:new paradigms of exercise training for metabolic diseases with exercise calorimetry targeting individuals. Ann Readapt Med Phys 50: 528-534, 520-527. [Crossref]
- Flore P, Bricout VA, van Biesen D, Guinot M, Laporte F, et al. (2008) Oxidative stress and metabolism at rest and during exercise in persons with Down syndrome. Eur J Cardiovasc Prev Rehabil 15: 35-42. [Crossref]
- Wallace TM, Levy JC, Matthews DR (2004) Use and abuse of HOMA modeling. Diabetes Care 27: 1487-1495. [Crossref]
- Togeiro SM, Carneiro G, Ribeiro Filho FF, Zanella MT, Santos-Silva R, et al. (2013) Consequences of obstructive sleep apnea on metabolic profile: a Population-Based Survey. Obesity (Silver Spring) 2: 847-851. [Crossref]
- Evans CA, Selvadurai H, Baur LA, Waters KA (2014) Effects of obstructive sleep apnea and obesity on exercise function in children. Sleep 37: 1103-1110. [Crossref]
- Lorenzo S, Babb TG (2012) Quantification of cardiorespiratory fitness in healthy nonobese and obese men and women. Chest 141: 1031-1039. [Crossref]
- Ghanassia E, Brun JF, Fedou C, Raynaud E, Mercier J (2006) Substrate oxidation during exercise: type 2 diabetes is associated with a decrease in lipid oxidation and an earlier shift towards carbohydrate utilization. Diabetes Metab 32: 604-610. [Crossref]
- Pendharkar SR, Tsai WH, Eves ND, Ford GT, Davidson WJ (2011) CPAP increases exercise tolerance in obese subjects with obstructive sleep apnea. Respir Med 105: 1565-1571. [Crossref]
- Hoyos CM, Killick R, Yee BJ, Phillips CL, Grunstein RR, et al. (2012) Cardiometabolic changes after continuous positive airway pressure for obstructive sleep apnoea: a randomised sham-controlled study. Thorax 67:1081-9. [Crossref]
- Awad KM, Malhotra A, Barnet JH, Quan SF, Peppard PE (2012) Exercise is associated with a reduced incidence of sleep-disordered breathing. Am J Med 125: 485-490. [Crossref]
- Giebelhaus V, Strohl KP, Lormes W, Lehmann M, Netzer N (2000) Physical Exercise as an Adjunct Therapy in Sleep Apnea-An Open Trial. Sleep Breath 4: 173-176. [Crossref]
- Peppard PE, Young T (2004) Exercise and sleep-disordered breathing: an association independent of body habitus. Sleep 27: 480-484. [Crossref]
- Sengul YS, Ozalevli S, Oztura I, Itil O, Baklan B (2011) The effect of exercise on obstructive sleep apnea: a randomized and controlled trial. Sleep Breath 15: 49-56. [Crossref]