Background: As a physical pollutant in the workplace, noise has physiological and psychological consequences for people.
Objective: The aim of this study was to investigate the relationship between annoyance and hearing loss in the people exposed to chronic noise in the automotive industry.
Methods: 250 workers exposed to sound pressure in the work environment were randomly selected. The DANPLEX-AS54 audiometry device was also used to measure the workers’ hearing levels. Furthermore, an annoyance inventory containing questions numbered 1 to 11 to indicate the level of annoyance was used as well.
Results: using Pearson correlation coefficient to evaluate hearing levels and annoyance, we found out a significant positive relationship between annoyance and hearing level at frequencies of 2000, 4000 and 8000 in the left ear, and frequency of 6000 in the right ear (P <0.001). Also, there was a significant relationship between annoyance and NIHL (noise-induced hearing loss) in the left ear, and general conditions (both ears) (P <0.001).
Conclusion: The results of this study, showed that there was a significant positive relationship between noise annoyance and hearing loss among the workers, and the likelihood of noise annoyance increased with the incidence of hearing loss.
occupational health, noise occupational, hearing loss, mental health
The advancement of technology, population growth, the use of vehicles and other issues of life all contribute to the annoyance of the modern men and depriving them of comfort by producing unpleasant noise [1]. Various studies have shown that unwanted noise can lead to hearing impairment, interruptions in speech, sleep disturbance, noise annoyance, and reduced performance of individuals and chronic physiological effects, including hypertension [2]. Negative effects of exposure to annoying noise not only affect hearing, but also lead to psychological and mental problems that may affect the lifestyle and work of the individuals [1,3]. Exposure to the noise pollution caused by industries and suffering from hearing loss resulted from it is one of the main problems of all industries [4]. Also, exposure to noise above the standard level can be a source of stress for workers, and reduce their level of comfort during work [5].
Continuous and prolonged exposures to 85 dB can cause temporary or permanent noise-induced hearing loss (NIHL), and this disorder can lead to interruptions in speech communication of individuals both quantitatively and qualitatively. Hence, the lack of proper and effective understanding will be followed by warning signs [6]. NIHL is today one of the problems of the world of advancement and industry, which affects all individuals regardless of age, gender and race [7,8]. NIHL is the most common cause of occupational deafness, due to the destructive effect of noise on the inner hearing organ, called the Organ of Corti [9]. People with hearing impairment try harder than ordinary people to talk to others and understand them, as a result of which they will get tired quickly and making active and effective communication will be difficult for them. This will lead to their isolation. Hearing loss also has psychosocial consequences. Studies show that hearing impaired people tolerate more stress and are more isolated. They experience emotional instability, because hearing loss reduces friendly communications, self-confidence and personal autonomy. It may have a negative impact on the individuals’ quality of life and cause psychological problems [10].
Annoyance is one of the harmful consequences of noise that is considered a mental problem of workers in the workplace. It is a negative mental attitude to the work environment, in which case the individual is totally reluctant to be present in a high -noise environment. Annoyance causes a fear of high-noise environments, anger and reduced accuracy in the workplace. Furthermore, sound intensity as well as exposure time and sound source are auditory factors affecting annoyance, and the feelings of fear and anger as well as cognitive impairment are among non-auditory factors that affect work activities. [11]. Studies on noise annoyance indicate a relationship between feeling annoyed and the sound level. However, other sound features, such as frequency, are also important in this relationship [12,13]. The aim of this study was to investigate the relationship between annoyance and hearing loss. Hearing loss has significant negative impacts on the social life and work environment of the individuals exposed to noise, and makes a negative attitude toward noise in the workplace. The impacts of hearing loss on workers and their attitude towards the work environment as well as their fear of exposure to noise, and ultimately noise annoyance are the issues discussed in this study. As there are few studies conducted on the relationship between annoyance and hearing loss, this study was carried out to investigate annoyance in people who have experienced hearing loss due to prolonged exposure to noise
Participants and setting
This descriptive-analytical research was carried out in 2017 to investigate the relationship between annoyance and hearing loss in automotive industry workers. The tools used to conduct the study included an annoyance inventory and an audiometer. The number of workers in the automotive industry was 600, of whom 300 were randomly selected based on statistical relations. After studying their medical records to know about the history of organic diseases of the hearing system, we excluded 50 individuals due to hearing impairment, and the other 250 ones were divided in two groups. The first group included 106 individuals exposed to the sound pressure levels below 85 dB, and the second included 144 people exposed to higher-than 85 dB sound pressure levels. They were all subjected to an audiometric test using the DANPLEX-AS54 audiometer (which was previously calibrated). The tonal audiometric test (air conduction) was also used to assess the workers' hearing loss. Prior to entering the workplace and starting the shift work, the subjects were examined in an acoustic room with 8 standard frequencies of 250, 500, 2000, 3000, 4000, 6000 and 8000. In this study, the data derived from the audiograms for the left and right ears of the individuals in the exposure group were calculated and recorded at all frequencies. Besides, the mean hearing thresholds at low frequency (HTL-L) and high frequency (HTL-H) were measured and recorded as well. Measuring the level of sound pressure in the workplace using the Testo device (model CEL-815) based on the ISO 9612: 2009 standard showed that the individuals’ exposure level was 81 to 89 dB. The data were then analyzed using the SPSS statistical software, and were compared to the base frequency (25 dB), which was considered a measure for hearing loss. The hearing threshold over 25 dB indicated hearing loss at that frequency [14]. The relationship between hearing loss and the age and work experience of the workers was statistically analyzed using the SPSS software and the t-test. Moreover, the degrees of hearing loss obtained from the subjects exposed to noise were compared based on the classification by the American National Standards Institute and the Academy of Otolaryngology. The noise-induced annoyance was also measured using a questionnaire containing a numerical question. The question was numbered 1 to 11, the highest of which indicated the highest degree of annoyance [15]. Besides, the subjects’ demographic information was investigated using a general questionnaire.
Data analysis
The statistical tests used in this study included descriptive and analytical ones. The former included central tendency and dispersion, and in the latter, the data were analyzed through Pearson correlation coefficient, independent t-test and repeated measures. The statistical analysis was done through the use of SPSS 22 software, and the significance level in all tests was considered lower than 0.05.
In this study, the mean ages of the subjects in the two groups were 36.33± 3.81 and 35.73 ±3.44 years, respectively, and no significant relationship was observed between the two groups in terms of age (P=0.201). Also, the mean work experiences in the two groups were 14.94 and 14.92 years, respectively, which showed no statistically significant difference (P=0.939). There was no significant relationship between educational levels, either (P=0.549). Regarding marital status, most of the subjects were married and there was no significant relationship between the two groups (P=0.235). Table 1 shows the demographic data of the subjects in terms of the received sound pressure level within 8 hours.
Table 1. Relationship between demographic information and received sound pressure level in the studied groups
| |
LEpd |
Total
Mean±Sd |
t |
P value |
≤85
Mean±Sd |
>85
Mean±Sd |
Age(year) |
35.73±3.44 |
36.33±3.81 |
36.07±3.66 |
1.28 |
0.201 |
Experience(year) |
14.92±1.89 |
14.94±2.15 |
14.94±2.04 |
0.076 |
0.939 |
|
Number (%) |
Number (%) |
Total Number (%) |
X2 |
P value |
Education |
Diploma |
58 (54.7%) |
69 (47.9%) |
127 (50.8%) |
1.198 |
0.549 |
Associate degree |
27 (25.5%) |
44 (30.6%) |
71 (28.4) |
Bachelor's degree and more |
21 (19.8%) |
31 (21.5%) |
52 (20.8%) |
marriage status |
single |
11 (10.4%) |
9 (6.3%) |
20 (8%) |
1.413 |
0.235 |
married |
95 (89.6%) |
135 (93.8%) |
230 (92%) |
Using the independent T-test to examine the hearing degrees of right and left ears at a frequency of 250 to 8000 based on the received sound pressure showed that there was a significant relationship in the left ear at frequencies of 500 and 2000, and in the right ear at frequencies of 500, 250, 2000, 3000, 4000, and 6000. Furthermore, there was a significant relationship between the overall hearing loss in the left and right ears, and in general, the received sound pressure level (Table 2).
Table 2. Evaluation of hearing loss in different frequencies based on the received sound pressure level using the independent t-test
|
Sound Frequency |
LEpd |
P value |
t |
≤85
Mean±Sd |
>85
Mean±Sd |
Left ear
|
250 |
12.22±2.49 |
11.77±2.40 |
0.157 |
1.42 |
500 |
18.25±4.68 |
21.53±4.51 |
<0.001** |
5.54 |
1000 |
25±0.75 |
25.4±0.64 |
0.632 |
0.479 |
2000 |
27.74±4.42 |
29.51±4.02 |
0.01* |
3.26 |
3000 |
29.58±7.71 |
29.69±7.93 |
0.911 |
0.112 |
4000 |
37.50±4.79 |
38.02±6.42 |
0.464 |
0.734 |
6000 |
31.32±9.44 |
29.44±10.84 |
0.146 |
1.45 |
8000 |
24.95±9.19 |
26.56±9.74 |
0.184 |
1.33 |
NIHL |
28.55±3.29 |
27.12±2.62 |
<0.001** |
3.70 |
Right ear |
250 |
13.54±2.58 |
12.22±3.22 |
<0.001** |
3.58 |
500 |
19.01±2.71 |
20.35±3.95 |
0.02* |
3.17 |
1000 |
28.68±2.21 |
28.61±2.24 |
0.811 |
0.239 |
2000 |
32.50±4.64 |
35.38±7.62 |
<0.001** |
3.70 |
3000 |
30.57±10.49 |
27.74±6.94 |
0.017* |
2.40 |
4000 |
42.31±4.88 |
44.20±8.90 |
0.033* |
2.14 |
6000 |
28.44±8.90 |
33.58±12.78 |
< 0.001** |
3.74 |
8000 |
26.89±10.61 |
24.51±11.47 |
0.093 |
1.68 |
NIHL |
30.62±3.47 |
32.23±5.02 |
0.003* |
2.98 |
Total |
NIHL |
27.85±2.48 |
29.19±1.97 |
< 0.001** |
4.57 |
*Statistically significant less than <0.05
**Statistically significant less than <0.01
Using the repeated measures test, we investigated the process of hearing changes at frequencies of 250 to 8000, the results of which are shown in Figures 1 and 2. As shown in Figure 1 (right ear), there was no significant difference between the two groups in terms of hearing loss (P=0.241), but a significant difference was found between the degree of hearing and the frequencies in general (P=<0.001). In Figure 2 (left ear), there was no significant difference between the two groups in terms of hearing loss (P=0.452), either, but the degree of hearing had a significant relationship with the frequencies in general (P=< 0.001).
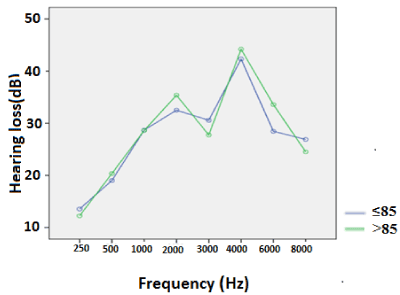
Figure 1. Hearing level in the right ear
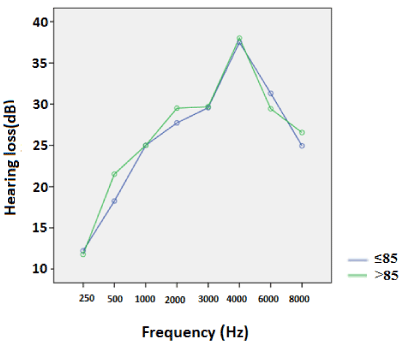
Figure 2. Hearing level in the left ear
Investigating the relationship between the hearing level and annoyance through the use of Pearson correlation coefficient showed a significant relationship in the left ear at frequencies 2000, 4000, and 8000, and in the right ear at frequency 6000. In addition, there was a significant relationship between annoyance and NIHL (noise-induced hearing loss) in the left ear and general conditions (both ears) (Table 3).
Table 3. Relation between annoyance and hearing level at different frequencies using Pearson correlation coefficient
|
Sound Frequency |
Mean±Sd |
Pearson
Correlation |
P value |
Left ear
|
250 |
11.96±2.44 |
0.026 |
0.684 |
500 |
20.14±4.85 |
0.044 |
0.484 |
1000 |
25.02±0.71 |
-0.116 |
0.068 |
2000 |
28.76±4.28 |
0.184 |
0.003 |
3000 |
29.64±7.83 |
0.003 |
0.957 |
4000 |
37.80±5.78 |
0.213 |
0.001* |
6000 |
30.24±10.29 |
-0.084 |
0.185 |
8000 |
25.88±9.52 |
-0.151 |
0.017 |
NIHL |
27.95±3.00 |
0.185 |
0.003* |
Right ear |
250 |
12.78±3.03 |
-0.016 |
0.796 |
500 |
19.78±3.53 |
-0.089 |
0.161 |
1000 |
28.64±2.22 |
-0.121 |
0.055 |
2000 |
34.16±6.66 |
-0.034 |
0.591 |
3000 |
28.94±8.72 |
-0.004 |
0.955 |
4000 |
43.40±7.51 |
0.053 |
0.405 |
6000 |
31.40±11.56 |
-0.134 |
0.035* |
8000 |
25.52±11.15 |
-0.049 |
0.438 |
NIHL |
31.55±4.49 |
-0.025 |
0.694 |
Total |
NIHL |
28.62±2.29 |
0.137 |
0.031* |
*Statistically significant less than <0.05
The results of this study, which aimed to investigate the relationship between annoyance and hearing loss in the workers exposed to chronic noise, showed a significant positive relationship between the degree of annoyance and the workers' hearing loss. In other words, being exposed to noise in the work environment increased the chance of hearing impairment, such as hearing loss and its consequences including the development of a negative attitude toward noise in the workers exposed to chronic noise, fear of sound, and reluctance to attend the environments with loud noise and noise pollution. That is to say, hearing loss increased noise annoyance, and this is consistent with the results of other related studies [16-18]
Various studies have investigated the negative outcomes of hearing loss in the work environment and social life, and the noise annoyance caused by it. In this regard, the results indicated a relationship between the feeling of annoyance and the sound levels, and the role of other contributing factors such as frequency in the workers’ feeling of annoyance caused by hearing loss was important. The results of other studies also indicated a dose-response relationship between the sound levels and the annoyance induced by hearing loss [13,19]. Besides, low-frequency noise (LFN) that has high penetration and is very hard to control may cause more distress and annoyance than high-frequency noise (HFN). In addition, personal differences affect the individuals’ responses to sound. Some people have a special hearing sensitivity and are not tolerant to common sounds [20,21]. The results of the present study showed that in sound pressure levels lower and higher than 85 dB, hearing loss had a significant difference at various frequencies. In low frequencies, the incidence rate of hearing loss was higher than in high frequencies, which was consistent with the results of other studies [22,23].
In the study by Holly Reed on the psychological effects of hearing loss in adults, it was well documented that hearing loss caused psychosocial changes such as mental and cognitive ones as well as the changes in the individuals’ quality of life and daily life. In other words, hearing loss decreased social roles and activities, and caused stress, unpleasant feelings towards noise, and reluctance to attend noisy environments. This confirms the results of our study on the effect of hearing loss caused by chronic exposure to noise on the individuals’ annoyance [24].
Ray Moon et al. also found that hearing loss had an impact on the incidence of noise annoyance. They concluded that the co-occurrence of hearing loss and occupational anxiety could be accompanied by noise annoyance which is followed by reduced accuracy and concentration at work and increased human errors [25]. This is consistent with the results of our study. In their research, Wagner-Hartl et al. clearly stated that age was interrelated with hearing loss as well as quality and duration of work. It was also related to concentration and accuracy at work [23]. Peterson et al. provided evidence of the relationship between the workers' annoyance and the hearing loss caused by exposure to traffic noise. They identified that the men with hearing loss were suffering from a higher degree of annoyance than those without hearing loss. Although the present research was not carried out on two groups with and without hearing loss, the results were generally consistent with those of the study by Peterson et al. [26]. Another study by Moghadam et al. clearly showed that hearing-impaired people had lower general health status and lower social function than those without hearing impairment, and the subjects with hearing loss were suffering from limitations in playing their roles, as a result of emotional-psychological problems and psychiatric disorders [27]. Even Gharashi et al. made it clear that psychological treatments to reduce noise annoyance caused by hearing loss in children could well reduce depression and anxiety resulted from hearing loss [18]. According to the study by Nachtegaal, hearing loss had psychosocial impacts such as decreased communication, daily disorders, loneliness, depression, reduced social functions, and anxiety [28]. Another study by Danmark found that people with hearing impairment had lower physical health than normal individuals, due to the stress caused by hearing impairment that increased the amount of stress hormones and also increased the risk of diseases. Finally, it caused negative psychoogical effects, including fear of being in noisy environments, and ultimately, hearing impairment. This is consistent with the findings of the present study [29].
The lack of examining the annoyance caused by noise-induced hearing loss in different sexes is one of the limitations of this study. Also, given that this is a cross-sectional study on the impact of hearing loss on the incidence of annoyance in people exposed to chronic noise in the workplace, generalization of the results to normal populations should be done with caution. Besides, longitudinal studies in this area can help to further clarify the impact of hearing loss on the annoyance caused by it. In general, the researchers concluded that there was a significant relationship between annoyance and hearing loss in the individuals exposed to chronic noise.
The researchers are grateful to the Vice Chancellor for Research of Iran University of Medical Sciences and the car manufacturing factory of Tehran for their help to carry out this study.
All authors have no potential conflict of interest pertaining to this journal submission.
- Shepherd D, Welch D, Dirks KN, Mathews R (2010) Exploring the relationship between noise sensitivity, annoyance and health-related quality of life in a sample of adults exposed to environmental noise. Int J Environ Res Public Health 7: 3579-3594.
- Zare M, Abedi K, Rahiminejad M, Halvani A, Barkhordari B, et al. (2009) Influence of aircraft noise on hypertension in airport staff. J Babol Univ Med Sci 10: 54-61.
- Alimohammadi I, Kanrash FA, Abolaghasemi J, Afrazandeh H, Rahmani K (2018) Effect of chronic noise exposure on aggressive behavior of automotive industry workers. Int J Occup Environ Med 9: 170-175.
- Ghajar MA (1996) Study of noise and effects on hearing of zamzam Coworkers. J Maz Univ Med Sci 6: 21-25.
- Bohnker BK, Page JC, Rovig G, Betts LS, Muller JG, et al. (2002) US navy and marine corps hearing conservation program, 1995-1999: Mean hearing thresholds for enlisted personnel by gender and age groups. Mil Med 167: 132-135.
- Picard M, Girard SA, Simard M, Larocque R, Leroux T, et al. (2008) Association of work-related accidents with noise exposure in the workplace and noise-induced hearing loss based on the experience of some 240,000 person-years of observation. Accid Anal Prev 40: 1644-1652.
- McReynolds MC (2005) Noise-induced hearing loss. Air Med J 24: 73-78. [Crossref]
- Lee KJ (2012) Essential otolaryngology: Head & Neck Surgery. 10th EditiMcGraw-Hill Medical.
- Sewell RK, Song C, Bauman NM, Smith RJ, Blanck P (2004) Hearing loss in union army veterans from 1862 to 1920. Laryngoscope 114: 2147-2153. [Crossref]
- Baguley DM, Andersson G (2000) Hyperacusis: Mechanisms, diagnosis, and therapies. Plural Pub.
- Noise exposure and public health. 2000.
- Taylor W, Pearson J, Mair A, Burns W (1965) Study of noise and hearing in jute weaving. J Acoust Soc Am 38: 113-120. [Crossref]
- Babisch W, Houthuijs D, Pershagen G, Cadum E, Katsouyanni K, et al. (2009) Annoyance due to aircraft noise has increased over the years—results of the HYENA study. Environ Int 35: 1169-1176.
- Dobie RA, Bailey BJ, Calhoon KH, Deskin RW, Johnson JT, et al. (1998) Head and neck surgery-otolaryngology, Lippincott-Raven Publ, Philadelphia.
- Alimohammadi I, Nassiri P (2010) Factors affecting road traffic noise annoyance among white-collar employees working in Tehran, Iran. Assoc Environ Heal 7: 25-34.
- Aniansson G, Pettersson K, Peterson Y (1993) Traffic noise annoyance and noise sensitivity in persons with normal and impaired hearing. J Sound Vib 88: 85-97.
- Jayakody DMP, Almeida OP, Speelman CP, Bennett RJ, Moyle TC, et al. (2018) Association between speech and high-frequency hearing loss and depression, anxiety and stress in older adults. Maturitas 110: 86-91.
- Gharashi K, Moheb N (2018) The effect of cognitive-behavioral therapy on reducing the anxiety and depression of children with hearing loss. Audit Vestib Res 27: 31-37.
- Waye KP, Öhrström E (2002) Psycho-acoustic characters of relevance for annoyance of wind turbine noise. J Sound Vib 250: 65-73.
- Kaczmarska A, Luczak A (2007) A study of annoyance caused by low-frequency noise during mental work. Int J Occup Saf Ergon 13: 117-125.
- Saremi M, Rezapour T (2013) Non-auditory effects caused by environmental noise pollution. J Kerman Univ Med Sci 20: 312-325.
- Monzani D, Galeazzi GM, Genovese E, Marrara A, Martini A (2008) Psychological profile and social behaviour of working adults with mild or moderate hearing loss. Acta Otorhinolaryngol.
- Wagner-Hartl V, Grossi NR, Kallus KW (2018) Impact of age and hearing impairment on work performance during long working hours. Int J Environ Res Public Health 15: 98.
- Reed H (2018) The psychosocial effects of hearing loss on adults. Honor Res Proj.
- Moon KR, Park S, Jung Y, Lee A, Lee JH (2018) Effects of anxiety sensitivity and hearing loss on tinnitus symptom severity. Psychiatry Investig 15: 34-40.
- Peterson Y, Aniansson G (1988) Noise sensitivity and annoyance caused by traffic noise in persons with impaired hearing. J Sound Vib 127: 543-548.
- Mobaraki H, Kamali M, Esmaeili A (2015) Effect of community-based rehabilitation program on quality of life for people of 15-65 years old with severe and profound hearing loss in the city of Sabzevar. J Mod Rehabil 9: 16-24.
- Nachtegaal J, Smit JH, Smits CAS, Bezemer PD, Van Beek JHM, et al. (2009) The association between hearing status and psychosocial health before the age of 70 years: results from an internet-based national survey on hearing. Ear Hear 30: 302-312.
- Danermark B, Gellerstedt LC (2004) Psychosocial work environment, hearing impairment and health. Int J Audiol 43: 383-389.
Editorial Information
Editor-in-Chief
Ying-Fu Chen
Kaohsiung Medical University, Taiwan
Article Type
Research Article
Publication history
Received date: August 05, 2019
Accepted date: August 27, 2019
Published date: August 30, 2019
Copyright
©2019 Alimohammadi I. This is an open-access article distributed under the terms of the Creative Commons Attribution License, which permits unrestricted use, distribution, and reproduction in any medium, provided the original author and source are credited.
Citation
Alimohammadi I, Kanrash FA, Abolghasemi J, Vosoughi S, Rahmani K, et al. (2019) Association between noise annoyance and hearing loss caused by chronic exposure to noise among the workers of an automotive industry. Trends Med 19: DOI: 10.15761/TiM.1000203