Abstract
Atorvastatin, a cholesterol-lowering drug blocks cholesterol production through inhibition of 3-hydroxy-3-methylglutaryl coenzyme A reductase. The therapeutic dose of the drug is regarded as safe, but does same apply if misused? This study therefore investigated the histology and structural protein expressions in hippocampal CA3 region in rat models. Thirty male albino Wistar rats weighing 170-210 g were selected into five groups (n=6), and divided into control, 10, 20, 40 and 80mg Atorvastatin (ATVS)/kg body weight of the animal by oral gavages and daily for 28 days. The animals were sacrificed 24 hours after the last drug administration by intracardial perfusion using 10% buffered formalin under ketamine hydocholride anaesthesia, and processed for histology using haematoxylin and eosin, and Cresyl fast violet methods. Representative sections were immunolabelled for neuron specific enolase (NSE) and glial fibrillary acidic protein (GFAP). Results showed significantly (p < 0.05) less body weight increase in the test groups, with pyknosis, hypertrophy, dark nuclei, less Nissl staining and significantly (p < 0.05) lower cellular population observed in the CA3 of the 20, 40 and 80 mg/kg ATVS groups. There was also decreased NSE and increased GFAP expressions in CA3 of the 20, 40 and 80mg/kg ATVS groups compared with the control group. In conclusions, the misuse of ATVS influenced body weight increase and caused hippocampal CA3 histological modifications, as well as altering the balance of some structural protein expression. These effects were dose-dependent and may lead to loss of the hippocampal CA3 functional activity with resultant neurodegeneration.
Keywords
Atorvastatin; Hippocampal CA3; Histology; Neuron specific enolase; Glial fibrillary acidic protein
Introduction
Atorvastatin, one of the statins groups of drugs, is cholesterol-lowering medication, which acts by blocking cholesterol production through the inhibition of 3-hydroxy-3-methylglutaryl coenzyme A (HMG-COA) reductase. The reductase then converts the HMG-COA to mevalonate, the rate-limiting step in cholesterol biosynthesis [1]. Atorvastatin is primarily used to treat dyslipidemia and the prevention of cardiovascular diseases [2,3]. The dose and potency of the statins used and individual responsiveness determines the magnitude of low density lipoprotein cholesterol (LDL-C) reduction and cardiovascular diseases benefit [4]. Thus, statins are the first choice agents for lowering LDL-C and non-high density lipoprotein cholesterol (HDL-C), which are important targets for pharmacotherapy, hence, are generally effective and remain the first choice treatment for high blood cholesterol levels [5,6]. Cholesterol is highly synthesized in the central nervous system during the time of active myelination which occurs in early neural development and is however decreases in mature adult brains [7,8]. In adulthood, the level of cholesterol in the central nervous system (CNS) determines its normal functions, and this is independent of the systemic cholesterol level [9,10]. At this stage of life the CNS does not rely entirely on systemic cholesterol production, but on the brain’s inherent capacity to synthesise its own cholesterol because of the limited metabolic turnover during this stage of life [7]. The brain cholesterol is mostly synthesized de novo by astrocytes, as well as the reutilisation of free cholesterol arising from neuronal death [11,12]. As such, reductions in plasma cholesterol concentration following statin treatment are unlikely to cause acute disruption in CNS cholesterol homeostasis [13,14]. Nevertheless, cholesterol level is affected by statins if the neurons and glia functions are disrupted [9,15]. It is reported that loss of astrocytes cholesterol causes neurite impairment [15].
Atorvastatin is reported to have neuroprotective ability, including reduction of glial cell activation and cerebral oedema, and restoration of blood-brain barrier [16-21]. It also protects against traumatic brain injury models, and increases neurogenesis in the dentate gyrus, reduce delayed neuronal death in the hippocampal CA3 region, improve spatial learning in rat after traumatic brain injury, and is also reported to improve memory [16,22,23].
Negative impact of statins especially on the central nervous system has also been reported. Statins are reported to have negative effects on cognition, induction of neurite inhibition and proliferation, with morbidity and mortality effects in high-risk conditions also reported [24-26].
The therapeutic dose of ATVS has shown neuroprotective effects on the hippocampal function, but could same be obtained if misused? Brain cholesterol has been associated with a half-life of from 6 months to 5 years, requiring chronic statin therapy before significant effects on the CNS cholesterol is observable [27-29]. However, can there be histological changes due to overdose? The present study examines the hippocampal protective ability in situations of abuse as underscored in the expression of neuron specific enolase and glial fibrillary acidic protein.
Materials and methods
Thirty (30) male albino Wistar rats weighing between (170 - 210 g) were obtained from the Animal House facility of the College of Health Science, University of Uyo, Nigeria for this study. Prior to the experiment, ethical permission was obtained from the Faculty of Basic Medical Sciences Ethical Committee, and the animals were handled according to the guidelines of the National Institute of Health of the United States of America.
The animals were housed in wooden cages designed with wire guage on top for ventilation and with provision for feed and water bottle and were acclimatized for 3 days before the start of the experiment and maintained under controlled environmental conditions (temperature: 25 ± 5oC and 12 hour dark/ light cycle). All animals were given feed twice daily and were allowed access to water ad libitum. The cages were cleaned and beddings changed twice a week.
The animals were randomly selected on the basis of average weight into five study groups of six rats each. 10 mg of Atorvastatin (ATVS) was solubilized in 40 ml of distilled water and made into a concentration of 0.25 mg/ml. After acclimatization period, the rats were subjected to different dosages of the drug with group 1 (control) receiving an equivalent volume of water as placebo. The test groups: 2-4 received oral doses of 10, 20, 40 and 80 mg ATVS/ kg body weight for 28 days respectively. The body weights were measured prior and after the experiment to determine body weight changes (if any).
At the end of drug treatment period (on the 28th day), the animals were fasted overnight (12hrs) and each animal was anaesthetized with 60 mg/kg ketamine hydrochloride (Rotex Medical, Germany) intraperitoneally. Incision was made through the thoraco-abdominal wall to the thoracic cavity and perfusion-fixed with 10% neutral buffered formalin intracardially. The fixed brain was removed and post-fixed in 10% neutral buffered formalin for 24 hours. Thereafter, the hippocampal region of all the brains were excised and routinely processed for paraffin wax embedding. Serial sections were obtained at 10 µm, and representatives sections were processed for histological studies with haematoxylin and eosin, as well as Cresyl fast violet. The other sections were immunolabelled with neuron specific enolase (NSE) and glial fibrillary acidic protein (GFAP).
Briefly, serial paraffin sections on slides were brought to water and antigen retrieval was performed using citrate buffer (pH 6.0) in a microwave oven for 5 minutes, followed by protein block using 3% hydrogen peroxide for 10 minutes. Sections were thereafter pre-incubated in 2% normal goat serum for 30 minutes and incubated in monoclonal mouse anti-enolase-2 (Novocastra, Leica Biosystems, 22C9, 1:100) for neuron specific enolase and mouse monoclonal anti GFAP (Novocastra, Leica Biosystems, NCL-L-GFAP-GA5, 1:100) for GFAP, followed by 1-hour incubation in goat anti-mouse secondary antibody (1:100) for an hour. Detection of reaction was by means of the avidin-biotin complex with diaminobenzidine as the chromagen. Sections were then counterstained with Harris haematoxylin, dehydrated, cleared and cover slipped with DPX (distyrene, plasticizer and xylene). Processed slides were viewed under the light microscope and photomicrographs obtained using a computer assisted digital microscope’s camera.
Cellular density was determined manually by means of ImageJ® software. Briefly, images of the whole hippocamapal CA3 region were obtained for each section and randomly mapped with the ImageJ® gridlines. Counting of cell nuclei was done manually taking into consideration the nuclei on the upper and right borders of the mapped areas.
Statistical analysis
One-way analysis of variance using Graphpad Prism was carried out, followed by post hoc Tukey’s test. Data obtained were expressed as mean ± standard deviation. Probability level of p < 0.05 was considered significant.
Results
Body weight change
There were increased body weights of animals in all the groups. However, there were significantly (p < 0.05) lower body weight increases in the test groups compared with the control group. No difference was observed among the test groups (Table 1, Figure 1).
Table 1. The Body Weight Change of the Experimental Groups
Groups
(n = 6) |
Initial Body Weight (g)
P < 0.0001
F = 71.18 |
Final Body Weight (g)
P = 0.0052
F = 4.805 |
Body Weight Gain (g)
P < 0.0001
F = 11.71 |
Control |
174.33 ± 6.33 |
224.33 ± 19.87 |
50.00 ± 13.45 |
10 mg ATVS |
179.83 ± 5.03 c,d,e |
192.50 ± 20.75*,b |
12.67 ± 15.72 *** |
20 mg ATVS |
192.5 ± 2.09 ***,d |
205.33 ± 17.67 NS |
12.83 ± 15.58 *** |
40 mg ATVS |
205.33 ± 1.75 *** |
209.50 ± 8.41 NS |
4.19 ± 6.66 *** |
80 mg ATVS |
210.67 ± 5.57 ***,c |
230.33 ± 15.00 NS |
19.66 ± 9.43 ** |
Data presented as Mean ± Standard Deviation
* Significantly different from the control group at p < 0.05
**Significantly different from the control group at p < 0.01
*** Significantly different from the control group at p < 0.001
b Significantly different from the control group at p < 0.001
c Significantly different from the control group at p < 0.001
d Significantly different from the control group at p < 0.001
NSNor significantly different from the control group at p < 0.05
ATVS Atorvastatin
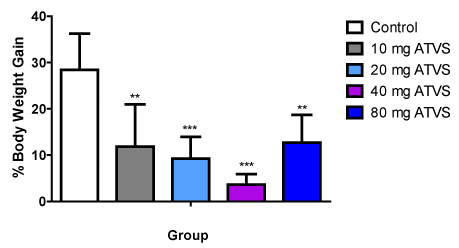
Figure 1. The Percentage Body Weight Change of the Experimental Groups
Data presented as Mean ± Standard Deviation
** - Significantly different from the control group at p < 0.01
*** - Significantly different from the control group at p < 0.001
ATVS - Atorvastatin
Histomorphology of the Hippocampal CA3
The hippocampal CA3 region had normal three cortical layers; molecular, pyramidal and polymorphic. In the control group the molecular layer consisted mostly of nerve processes with sparse cellular population. The pyramidal layer was made up of dense pyramidal cells, while the polymorphic layer was mostly nerve processes with sparse cellular population (Figure 2A). The hippocampal CA3 region of the 10 mg/kg ATVS group showed amorphous pyramidal cell nuclei compared with the control group (Figure 2B). The hippocampal CA3 region of the 20 mg/kg ATVS group showed the pyramidal cells having pyknotic nuclei compared with the control group (Figure 2C).
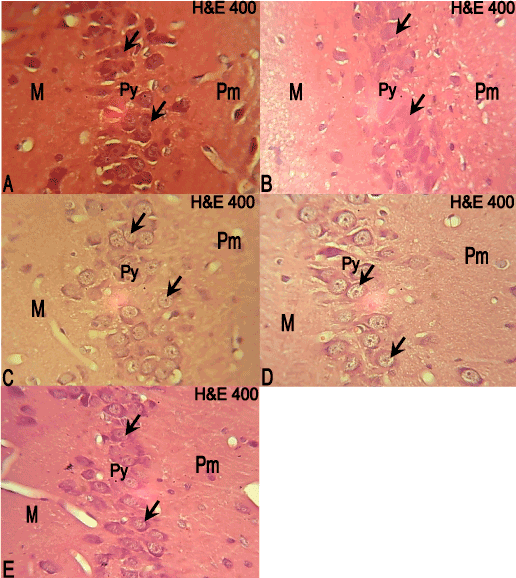
Figure 2. Photomicrographs of the hippocampus of the experimental animals. Molecular (M); Pyramidal (Py); Polymorphic (Pm) layers. H & E, × 400
A: The hippocampus if the control group showing the molecular layer with sparse cellular population. The pyramidal layer consists of dense pyramidal cells (arrows), and the polymorphic layer also has sparse cellular population.
B: The hippocampus of 10mg/kg ATVS group showing amorphous pyramidal cells (arrows).
C: The hippocampus of 20mg/kg ATVS group showing pyknotic pyramidal cells (arrows).
D: The hippocampus of 40mg/kg ATVS group showing hypertrophied and pyknotic pyramidal cells (arrows).
E: The hippocampus of 80mg/kg ATVS group showing pyknotic pyramidal cells (arrows).
The hippocampal CA3 region of 40 mg/kg ATVS group showed hypertrophied and pyknotic pyramidal cells, as well as cells of the polymorphic layer compared with the control group (Figure 2D), while the hippocampal CA3 region of the 80 mg/kg ATVS group also showed pyknotic pyramidal cells, as well as cells of the polymorphic layer compared with the control group (Figure 2E).
There was no difference in cell population between the 10 mg/kg ATVS group, but significantly (p < 0.05) lower number of cells in the 20, 40 and 80 mg/kg ATVS groups compared with the control group. The 20, 40 and 80 mg/kg ATVS groups were significantly (p < 0.05) lower than the 10 mg/kg ATVS group, while the 20 mg/kg ATVS was significantly (p < 0.05) higher than the 40 mg/kg ATVS group. However, there was no difference between the cell population of the 20 mg/kg ATVS and 80 mg/kg ATVS groups as well as between the 40 mg/kg ATVS and 80 mg/kg ATVS groups (Figure 3).
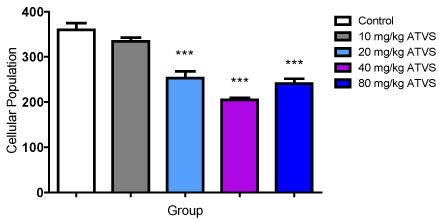
Figure 3. Cellular population of the Experimental Groups
Data presented as Mean ± Standard Deviation
*** - Significantly different from the control group at p < 0.001
ATVS - Atorvastatin
Nissl staining of the hippocampal CA3
The hippocampal CA3 region of the control group showed prominent Nissl stained cells, which was same with that of the 10 mg/kg ATVS of group (Figure 4A,4B). The hippocampal CA3 region of the 20 mg/kg ATVS group showed hypertrophied cells with less Nissl staining (Figure 4C), while the hippocampal CA3 region of the 40 and 80 mg/kg ATVS groups showed some dark cells with some having less Nissl staining compared with the control group (Figure 4D,4E).
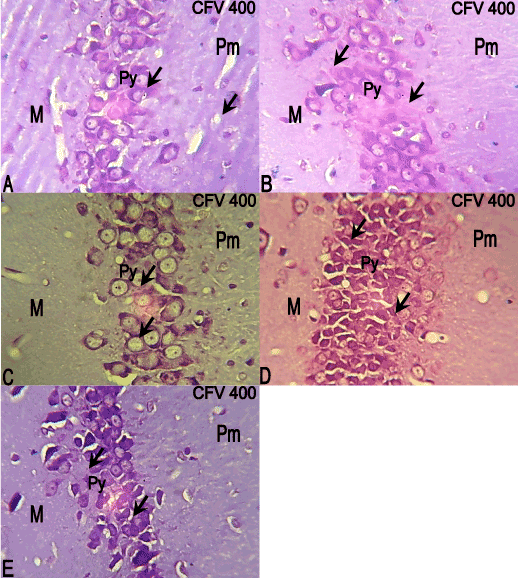
Figure 4. Sections of the CA3 of the experimental animals. Molecular (M); Pyramidal (Py); Polymorphic (Pm) layers. CFV, × 400
A: The CA3 of the control group showing prominent Nissl stained cells (arrows).
B: The CA3 of 10mg/kg ATVS group showing prominent Nissl stained cells (arrows).
C: The CA3 of 20mg/kg ATVS group showing hypertrophied cells (arrows).
D: The CA3 of 40mg/kg ATVS group showing some dark cells (arrows).
E: The CA3 of 80mg/kg ATVS group showing some dark cells (arrows).
There was no difference in cell population between the 10 and 40 mg/kg ATVS groups, but significantly (p < 0.05) lower number of cells in the 20 and 80 mg/kg ATVS groups compared with the control group. The 20 and 80 mg/kg ATVS groups were significantly (p < 0.05) lower than the 10 mg/kg ATVS group. However, there was no difference between the cell population of the 20 mg/kg ATVS and the 40 and 80 mg/kg ATVS groups, as well as between the 40 mg/kg ATVS and 80 mg/kg ATVS groups (Figure 5).
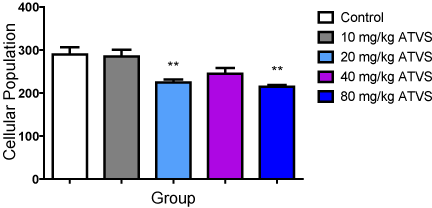
Figure 5. Cellular population of Cresyl stained Cells of the Experimental Groups
Data presented as Mean ± Standard Deviation
** - Significantly different from the control group at p < 0.01
ATVS - Atorvastatin
Neuron Specific Enolase (NSE) Immunolabelling
The hippocampal CA3 region of the control group showed cytosolic NSE expression throughout the pyramidal cells, with the soma clearly revealed, while the hippocampal CA3 region of the 10 mg/kg ATVS group showed reduced NSE expression in the pyramidal cells compared with the control group (Figure 6A,6B). In the 20, 40 and 80 mg/kg ATVS groups, NSE expression was also reduced in the pyramidal cells of the hippocampal CA3 region compared with the control group (Figure 6C-6E).
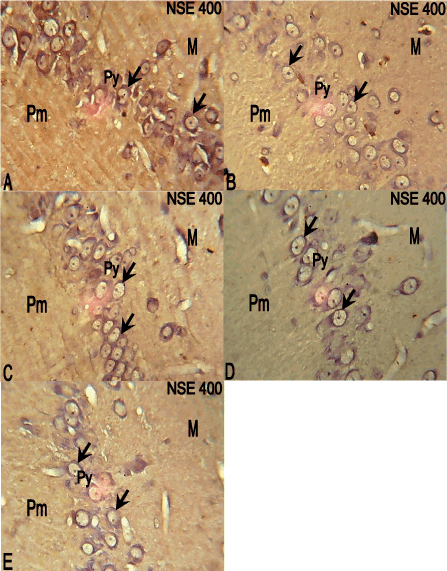
Figure 6. Photomicrographs of the hippocampus of the experimental animals. molecular (M), pyramidal (Py) and polymorphic (Pm) layers. NSE, ×400
A: The hippocampus of the control group showing NSE expression (arrows) throughout the pyramidal cells of the hippocampus with the cell bodies clearly revealed.
B: The hippocampus of the 10mg/kg ATVS group showing reduced NSE expression (arrows) in the pyramidal cells of the hippocampus.
C: The hippocampus of 20mg/kg ATVS group showing reduced NSE expression (arrows) in the pyramidal cells of the hippocampus.
D: The hippocampus of 40mg/kg ATVS group showing reduced NSE expression (arrows) in the pyramidal cells of the hippocampus.
E: The hippocampus of 80mg/kg ATVS group showing reduced NSE expression (arrows) in the pyramidal cells of the hippocampus.
There was no difference in NSE-labelled cell population between the 10 mg/kg ATVS group, but significantly (p < 0.05) lower number of cells in the 20, 40 and 80 mg/kg ATVS groups compared with the control group. The 40 and 80 mg/kg ATVS groups were significantly (p < 0.05) lower than the 10 mg/kg ATVS group, while the 20 mg/ kg ATVS group was significantly (P < 0.05) higher than the 80 mg/kg ATVS group. However, there was no difference between the NSE-labelled cell population of the 20 mg/kg ATVS and the 10 and 40 mg/kg ATVS groups, as well as between the 40 mg/kg ATVS and 80 mg/kg ATVS groups (Figure 7).
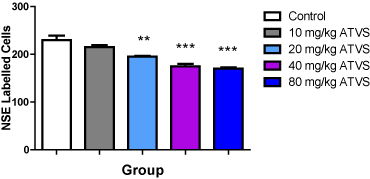
Figure 7. NSE-labelled Cell Population of the Experimental Groups
Data presented as Mean ± Standard Deviation
** Significantly different from the control group at p < 0.01
*** Significantly different from the control group at p < 0.001
ATVS - Atorvastatin
Glial Fibrillary Acidic Protein (GFAP)
The control group showed GFAP expression throughout the hippocampal CA3 region layers with the soma and processes of the astrocytes clearly revealed (Figure 8A). In the 10 mg/kg ATVS group, GFAP was expressed throughout the hippocampal CA3 region layers, but mostly in the processes of the astrocytes compared with the control group (Figure 8B). In the 20, 40 and 80 mg/kg ATVS groups, GFAP was much expressed throughout the hippocampal CA3 region layers in the soma and processes of the astrocytes compared with the control group (Figure 8C-8E).
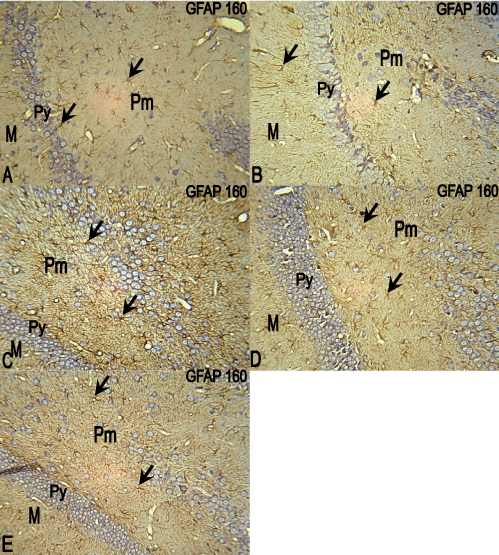
Figure 8. Photomicrographs of the hippocampus of the experimental animals. molecular (M), pyramidal (Py) and polymorphic (Pm) layers. GFAP, ×160
A: The hippocampus of the control group showing GFAP expression throughout the hippocampus layers, with. the cell bodies and processes of the astrocytes clearly revealed.
B: The hippocampus of 10mg/kg ATVS group showing GFAP expression throughout the hippocampus layers especially in the processes of the astrocytes.
C: The hippocampus of 20mg/kg ATVS group showing marked GFAP expression throughout the hippocampus layers, with the cell bodies and processes of the astrocytes clearly expressed.
D: The hippocampus of 40mg/kg ATVS group showing marked GFAP expression throughout the hippocampus layers, with the cell bodies and processes of the astrocytes clearly expressed.
E: The hippocampus of 80mg/kg ATVS group showing marked GFAP expression throughout the hippocampus layers, with the cell bodies and processes of the astrocytes clearly expressed.
There was no difference in GFAP-labelled astrocyte population between the 10 mg/kg ATVS group, but significantly (p < 0.05) higher number of GFAP-labelled astrocytes in the 20, 40 and 80 mg/kg ATVS groups compared with the control group. The 20, 40 and 80 mg/kg ATVS groups were significantly (p < 0.05) higher than the 10 mg/kg ATVS group, while the 20 mg/kg ATVS group was significantly (P < 0.05) higher than the 80 mg/kg ATVS group. However, there was no difference between the NSE-labelled cell population of the 20 mg/kg ATVS and the 40 mg/kg ATVS groups, as well as between the 40 mg/kg ATVS and 80 mg/kg ATVS groups (Figure 9).
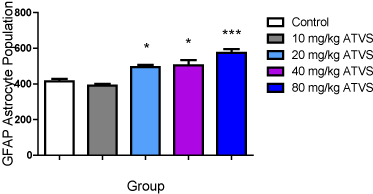
Figure 9. GFAP-labelled Astrocyte Population of the Experimental Groups
Data presented as Mean ± Standard Deviation
* - Significantly different from the control group at p < 0.05
** - Significantly different from the control group at p < 0.01
*** - Significantly different from the control group at p < 0.001
ATVS - Atorvastatin
Discussion
This study assessed the effects of the abuse of one of the statins, ATVS on body weight, and the histology and some protein expression of the hippocampal CA3 region of adult Wistar rats. The results showed less body weight increase in the test groups compared with the control group, with no difference among the test groups. This result indicates that the given dose of ATVS significantly alter body weights increase. Body weight is measured by the amount of fat deposits, which reflect in part the rate of caloric intake [30]. It is reported that statins lower body cholesterol levels, which may have been the results observed in the present experiment [5]. Cholesterol deposition may be a means by which body weight increase occur together with other lipid components [30,31]. Thus, this protective activity will ensure protection of the cardiovascular system, as increased adiposity usually result in damage to endothelial cells of arteries and capillary vessels, decrease in blood flow, impairment of metabolism, and the decrease in nutritive and oxygen levels in the brain [32]. As the CNS lipid deposits are not directly proportional to the systemic deposits, this may not have applied to the brain area under study [33].
As the interest of the present study was on memory consolidation, the hippocampal CA3 was paramount in this research. The histology of the hippocampal CA3 of the 10 mg/kg ATVS group showed amorphous pyramidal cells, with that of the 20 mg/kg ATVS group showing pyknosis and less Nissl staining. In the 40 mg/kg and 80 mg/kg ATVS groups, the polymorphic layer and the pyramidal cells appeared hypertrophied with pyknotic nuclei and some dark nuclei with less Nissl staining in others. There was significantly (p < 0.05) lower number of cells in the 20, 40 and 80 mg/kg ATVS groups compared with the control and the 10 mg/kg ATVS groups, while there was no difference in cell population between the 10 mg/kg ATVS and control groups. Pyknosis indicates cell death process and is the most characteristic feature of apoptosis [34]. In adults, apoptosis occurs as a homeostatic mechanism to maintain cell populations in tissues, and also as a defence mechanism against damage [35]. This may have been the case in the hippocampal CA3 of the present study.
There was no difference in cell population in the hippocampal CA3 between the 10 mg/kg ATVS group compared with the control group, an indication that at therapeutic doses adverse effects may not be established. Therapeutic level of most statins is regarded as safe [36]. However, lower cellular population were observed in the 20, 40 and 80 mg/kg ATVS groups compared with the control group, an indication that higher dosages of this statin can cause cell death processes resulting in cellular loss. This corroborates the cell death process already observed. Ekong et al. [37] reported that rat brain tissues loss of cells is indicative of neurodegenerative process, which may be the case in the present study.
Brain tissue biomarkers are mainly derived from neurons or astrocytes [38,39]. Hence, NSE and GFAP were used in the present study. NSE is an isoenzyme in the cytoplasm of neurons which marks the integrity and activity of neurons [40-42]. In the present study, there was decreased NSE expression in the pyramidal cells of the hippocampal CA3 region of the 10, 20, 40 and 80 mg/kg ATVS groups, with lower population of cells in the 20, 40 and 80 mg/kg ATVS groups compared with the control group. These are indications of the decreased neuronal glycolysis or neuronal degeneration. Decreased neuronal glycolysis leads to a concomitant reduction in neurotransmitter production and axonal transport and this is usually associated with degenerative processes [42].
In the 10 mg/kg ATVS group, GFAP was expressed throughout the hippocampal CA3 region layers, but mostly in the processes of the astrocytes, while in the 20, 40 and 80 mg/kg ATVS groups, GFAP was much expressed throughout the hippocampal CA3 region layers in the soma and processes of the astrocytes, with higher population of GFAP-labelled astrocytes in the 20, 40 and 80 mg/kg ATVS groups compared with the control group. GFAP is the hallmark intermediate filament protein in astrocytes, with increased expression indicating the up-regulation of the GFAP protein in the astrocytes, an astroglial activation or astrogliosis process, which is known to occur following CNS trauma and also in the process of neurodegeneration [43,44]. Astrocytes have a range of control and homeostatic functions in health and disease [45]. It has also been reported as a blood biomarker, released during neurodegenerating process into the surrounding interstitial fluid where it appears in the peripheral blood likely via disruptions in the blood-brain barrier [46].
The hippocampal CA3 region is an integral portion of the hippocampal formation and its pyramidal cells serve to connect the dentate gyrus and CA1 [47]. It plays an important role in the encoding of new spatial information within short-term memory and also important for encoding of spatial information requiring multiple trials including the acquisition of arbitrary and relational associations [48]. These processes may be altered with statin administration due to neuronal and glia injuries that may initiate cellular death processes.
Conclusion
The abuse of ATVS influences body weight increase and caused hippocampal CA3 histological modifications, as well as altering the balance of some structural protein expression. These effects were dose-dependent and may lead to loss of the hippocampal CA3 functional activity with resultant neurodegeneration.
References
- Buhaescu I, Izzedine H (2007) Mevalonate pathway: a review of clinical and therapeutical implications. Clin Biochem 40: 575-584. [Crossref]
- Mora S, Ridker PM (2006) Justification for the Use of Statins in Primary Prevention: an Intervention Trial Evaluating Rosuvastatin (JUPITER)--can C-reactive protein be used to target statin therapy in primary prevention? Am J Cardiol 97: 33A-41A. [Crossref]
- Kohno H, Sakai T, Saito S, Okano K, Kitahara K (2007) Treatment of experimental autoimmune uveoretinitis with atorvastatin and lovastatin. Exp Eye Res 84: 569-576. [Crossref]
- Cholesterol Treatment Trialists (CTT) Collaboration, Baigent C, Blackwell L, Emberson J, Holland LE, et al. (2010) Efficacy and safety of more intensive lowering of LDL cholesterol: a meta-analysis of data from 170,000 participants in 26 randomised trials. Lancet 376: 1670-1681. [Crossref]
- Taylor F, Huffman MD, Macedo AF, Moore TH, Burk M (2013) Statins for primary prevention of cardiovascular disease. Cochrane Database Sys Rev 16:141-50.
- Mohammad BI, Hadi NR, Jawad HM, Jamil DA, Al-Aubaidy HA (2014) Anti-atherosclerotic effects of atorvastatin: a randomised control trial. World J Pharmaceut Res 3: 1637-1647.
- Dietschy JM, Turley SD (2001) Cholesterol metabolism in the brain. Curr Opin Lipidol 12: 105-112. [Crossref]
- McFaland AJ, Anoopkumar-Durkie S, Arora SD, Grant GD, McDermott CM, et al. (2014) Molecular mechanisms underlying the effects of statins in the central nervous system. Int J Mol Sci 15:2 0607-20637.
- Pfrieger FW (2003) Cholesterol homeostasis and function in neurons of the central nervous system. Cell Mol Life Sci 60: 1158-1171. [Crossref]
- Dietschy JM, Turley SD (2004) Thematic review series: brain Lipids. Cholesterol metabolism in the central nervous system during early development and in the mature animal. J Lipid Res 45: 1375-1397. [Crossref]
- Nieweg K, Schaller H, Pfrieger FW (2009) Marked differences in cholesterol synthesis between neurons and glial cells from postnatal rats. J Neurochem 109: 125-134. [Crossref]
2021 Copyright OAT. All rights reserv
- Orth M, Bellosta S (2012) Cholesterol: its regulation and role in central nervous system disorders. Cholesterol 2012: 292598. [Crossref]
- Lütjohann D, Stroick M, Bertsch T, Kühl S, Lindenthal B, et al. (2004) High doses of simvastatin, pravastatin, and cholesterol reduce brain cholesterol synthesis in guinea pigs. Steroids 69: 431-438. [Crossref]
- Thelen KM, Rentsch KM, Gutteck U, Heverin M, Olin M, et al. (2006) Brain cholesterol synthesis in mice is affected by high dose of simvastatin but not of pravastatin. J Pharmacol Exp Ther 316: 1146-1152. [Crossref]
- Ferris HA, Perry RJ, Moreira GV, Shulman GI, Horton JD, et al. (2017) Loss of astrocyte cholesterol synthesis disrupts neuronal function and alters whole-body metabolism. PNAS 114:1189-1194. [Crossref]
- Lu D, Qu C, Goussev A, Jiang H, Lu C, et al. (2007) Statins increase neurogenesis in the dentate gyrus, reduce delayed neuronal death in the hippocampal CA3 region, and improve spatial learning in rat after traumatic brain injury. J Neurotrauma 24: 1132-1146. [Crossref]
- Pan HC, Yang DY, Ou YC, Ho Sp, Cheng FC, et al. (2010) Neuroprotective effect of atorstatin in an experimental model of nerve crush injury. Neurosurgery 67: 376-388. [Crossref]
- Sierra S, Ramos MC, Molina P, Esteo C, Vasquez JA, et al. (2011) Statins as neuroprotectants: a comparative in vivo study of lipophilicity, blood-brain-barrier penetration, lowering of brain cholesterol, and decrease of neuron cell death. J Alzheimers Dis 23: 307-318. [Crossref]
- Yang J-W, Hu Z-P (2015) Neuroprotective effects of atorvastin against cerebral ischemia/reperfusion injury through the inhibition of endoplasmic reticulum stress. Neural Regen Res 10: 1239-1244. [Crossref]
- Chen G, Zhang S, Shi J, Ai J, Qi M, et al. (2009) Simvastatin reduces secondary brain injury caused by cortical confusion in rats: possible involvement of TLR4/NF-Kappa B pathway. J Exp Neurol 216: 398-406. [Crossref]
- Chen SF, Hung TH, Chen CC, Lin KH, Huang YN, et al. (2007) Lovastatin improves histological and functional outcomes and reduces inflammation after experimental traumatic brain injury. Life Sci 81: 288-298. [Crossref]
- Kabadi SV, Faden AI (2014) Neuroprotective strategies for traumatic brain injury: improving clinical translation. Int J Mol Sci 15: 1216-1236. [Crossref]
- Bettermann K, Arnold AM, Williamson J, Rapp S, Sink K, et al. (2012) Statins, risk of dementia and cognitive function: Secondary analysis of the ginkgo evaluation of memory study. J Stroke Cerebrovasc Dis 21: 436-444. [Crossref]
- Swiger KJ, Manalac RJ, Blumenthal RS, Blaha MJ, Martin SS (2013) Statins and cognition: a systematic review and meta-analysis of short- and long-term cognitive effects. Mayo Clin Proc 88: 1213-1221. [Crossref]
- Vural K, TuÄŸlu MI (2011) Neurotoxic effect of statins on mouse neuroblastoma NB2a cell line. Eur Rev Med Pharmacol Sci 15: 985-991. [Crossref]
- Lardizabal JA, Deedwania PC (2010) Benefits of statin therapy and compliance in high risk cardiovascular patients. Vasc Health Risk Manag 6: 843-853. [Crossref]
- Andersson M, Elmberger PO, Edlund C, Kristensson K, Dallner G (1990) Rates of cholesterol, ubiquinone, dolichol and dolichyl-P biosynthesis in rat brain slices. FEBS Lett 269: 15-18. [Crossref]
- Björkhem I, Heverin M, Leoni V, Meaney S, Diczfalusy U (2006) Oxysterols and Alzheimer's disease. Acta Neurol Scand Suppl 185: 43-49. [Crossref]
- Cibicková L (2011) Statins and their influence on brain cholesterol. J Clin Lipidol 5: 373-379. [Crossref]
- Cinti S (1999) The Adipose Organ. Milano: Editrice Kurtis.
- Nestel PJ, Schreibman PH, Ahrens EH Jr (1973) Cholesterol metabolism in human obesity. J Clin Invest 52: 2389-2397. [Crossref]
- Huang PCS, Feng YL, Du TP (1998) The effect of hypercholesterolemia on brain artery in mature rhesus monkey. J Xinxiang Med College 15:131-132.
- Robert J, Cheng WH, Hayat A, Ward-Able T, Wellington CL (2015) High-density lipoproteins at the interface between central nervous system and plasma lipoprotein metabolism. Clin Lipidol 10: 69-81.
- Häcker G (2000) The morphology of apoptosis. Cell Tissue Res 301: 5-17. [Crossref]
- Norbury CJ, Hickson ID (2001) Cellular responses to DNA damage. Annu Rev Pharmacol Toxicol 41: 367-401. [Crossref]
- Maji D, Shaikh S, Solanki D, Gaurav K (2013) Safety of statins. Indian J Endocrinol Metab 17: 636-646. [Crossref]
- Ekong MB, Peter AI, Edagha IA, Ekpene UU, Friday DA (2016) Rauwolfia vomitoria inhibits olfaction and modifies olfactory bulb cells. Brain Res Bull 124: 206-213. [Crossref]
- Griesbach GS, Sutton RL, Hovda DA, Ying Z, Gomez-Pinilla F (2009) Controlled contusion injury alters molecular systems associated with cognitive performance. J Neurosci Res 87: 795-805. [Crossref]
- Kandratavicius L, Monteiro MMR, Silva RAV, Leite JP (2010) Neutrophins in temporal lobe epilepsy. J Epilepsy Clin Neurophysiol 16: 7-12.
- Pelinka LE, Herzt H, Mauritz W, Harada N, Jafarmadar M, et al. (2005) Nonspecific increase of systemic neuron-specific enolase after trauma: clinical and experimental findings. Shock J 24: 119-123. [Crossref]
- Macedo RC, Tomasi CD, Giombelli VR, Alves SC, Bristot Mde L, et al. (2013) Lack of association of S100B and neuron specific enolase with mortality in critically ill patients. Rev Bras Psiquiatr 35: 267-270. [Crossref]
- Butterfield DA, Lange ML (2009) Multifunctional roles of enolase in Alzheimer's disease brain: beyond altered glucose metabolism. J Neurochem 111: 915-933. [Crossref]
- Nagele RG, Wegiel J, Venkataraman V, Imaki H, Wang KC, et al. (2004) Contribution of glial cells to the development of amyloid plaques in Alzheimer's disease. Neurobiol Aging 25: 663-674. [Crossref]
- Brahmachari S, Fung YK, Pahan K (2006) Induction of glial fibrillary acidic protein expression in astrocytes by nitric oxide. J Neurosci 26: 4930-4939. [Crossref]
- Hol EM, Perky M (2015) Glial fibrillary acidic protein (gfap) and the astrocyte intermediate filament system in diseases of the central nervous system. J Curr Opin Cell Biol 32: 121-130. [Crossref]
- Missler U, Wiesmann M, Whitmann G, Magerkurth O, Hagenström H (1999) Measurement of glial fibrillary acidic protein in human blood: analytical method and preliminary clinical results. Clin Chem 45: 138-141. [Crossref]
- Amaral DG, Lavenex P (2007) Hippocampal neuroanatomy. In: Andersen P, Morris R, Amaral D, Bliss T, O'Keefe J, eds. The Hippocampus Book. New York: Oxford University Press 872.
- Kesner RP (2007) Behavioral functions of the CA3 subregion of the hippocampus. Learn Mem 14: 771-781. [Crossref]


