Background: Chemerin, an adipokine, may regulate metabolism during pregnancy.
The objective of this study was to measure the maternal serum chemerin levels in obese & normal weight cases during normal pregnancy as well as in preeclampsia.
Study design: This was a cross sectional study at Mansoura University Hospital, Egypt, including the following groups:
- 60 cases with non-severe preeclampsia (group 1: obese & group 2: normal weight).
- 60 cases with severe preeclampsia (group 3: obese & group 4: normal weight).
- 30 normal pregnant women (group 5: normal weight).
Serum chemerin concentrations were assayed with an enzyme-linked immunosorbent assay (ELISA). Statistical analysis was performed by using Statistical Package for Social scientists (SPSS).
Results: In cases with preeclampsia, the serum chemerin levels were found to be significantly higher as compared with the normotensive pregnant women. In cases with severe preeclampsia, the serum chemerin levels were significantly higher as compared with the levels in cases with non-severe preeclampsia (p <0.0001). The serum cholesterol, triglycerides & LDL levels were significantly increased in cases with preeclampsia as compared with control group women (p=0.0002), but HDL was significantly decreased (p <0.0001).
Conclusion: It is concluded that serum maternal chemerin levels were significantly increased in cases with preeclampsia as compared with the normotensive pregnant women.
Chemerin may play an unclear etio-pathological role in the disease either due to direct vasoconstriction of blood vessels or due to limitation of trophoblastic invasion of spiral arteries.
preeclampsia, chemerin, obesity, insulin resistance
Preeclampsia is a pregnancy multisystem specific disorder with serious maternal and fetal effects [1]. In women with a history of preeclampsia, metabolic syndrome findings are more prevalent than in women with prior normal pregnancies [2]. Obesity was found to be associated with a three-fold increase in the risk of preeclampsia. Obesity leads to hypertension through reduced availability of nitrous oxide secondary to oxidative stress and increased expression of angiotensinogen by adipose tissue [3].
Adipokines secreted by white adipose tissue were found to have endocrine/systemic actions in regulating maternal lipid and glucose metabolism and gestational insulin resistance (IR) [4]. Chemerin, an adipokine, is secreted as an inactive pro-protein and converted by extracellular serine protease cleavage to an active form which is present in plasma and serum [4]. Chemerin is highly expressed in white adipocytes and has been demonstrated to be associated with obesity, high blood pressure, metabolic syndrome [5], and type 2 diabetes mellitus [6]. An elevated serum chemerin level during the first trimester of pregnancy is associated with the risk of gestational diabetes mellitus [7]. Chemerin is highly expressed in white fat tissues, liver, lungs, pituitary, placenta, and ovaries, and participates in different physiological functions [8].
Chemerin peptides were considered as new members of the vaso-active peri-vascular adipose tissue (PVAT) factors that may change the arterial tone resulting in hypertension. Chemerin secreted by peri-adventitial fat can promote arterial vasoconstriction through CMKLR1 receptor [9]. The intensities of chemerin expression in peri-adventitial fat were positively correlated with the severity of atherosclerosis [10].
The aim of this study was to determine the serum levels of chemerin in obese & normal weight cases with preeclampsia as compared with women during normal pregnancy, and to correlate the chemerin levels with Homeostatic Model of Assessment-Insulin Resistance (HOMA-IR), lipid profile and high blood pressure.
This work was a cross sectional case-control study carried out on 150 cases (120 cases with preeclampsia and 30 cases with normal pregnancy as a control group) at the Department of Obstetrics and Gynecology, Mansoura University Hospital, Mansoura, Egypt, during the period between September 2015 and November 2019. The normal weight cases with non-severe preeclampsia (PET) and with severe preeclampsia (PET) as well as the control cases of normal pregnancy were followed two months after delivery to estimate chemerin levels.
Inclusion criteria
The cases included in this study had no history of hypertension before pregnancy and had documented normal blood pressure in the first trimester. All pregnant cases were with gestational ages of 34-36 weeks.
Preeclampsia is defined as de novo hypertension (>140/90 mm Hg) and proteinuria (> 0.3 g per 24 hours) during the second half of pregnancy [1].
The classification of cases with severe and non-severe preeclampsia (PET) was done according to ACOG Task Force on Hypertension [1]. The term mild preeclampsia is replaced by non-severe preeclampsia (or, preeclampsia without severe features).
Severe preeclampsia (or, preeclampsia with severe features)
Severe preeclampsia was considered if systolic or diastolic blood pressures values were ≥160 or 110 mm Hg, respectively, occurring twice, 4 hours apart at bed rest [1]. Obesity was considered if the Body Mass Index (BMI) of the cases before getting pregnancy was > 30 Kg/m2, according to WHO definition [11].
Exclusion criteria
The following cases were excluded from the study: cases with heart disease, renal disease, chronic hypertension, collagen vascular disease, thyroid disorders, diabetes mellitus, hepatitis, anemia, and multi-fetal gestation. The study was approved by the IRB committee of Mansoura Faculty of Medicine [code number R/15.08.82, date: 17/9/2015]. Informed written consents were taken from the participants.
The cases of this study included the following groups:
Group 1: consisted of 30 obese pregnant cases with non-severe preeclampsia [preeclampsia without severe features] of gestational age 34-36 weeks
Group 2: consisted of 30 normal weight pregnant cases with non-severe preeclampsia [preeclampsia without severe features] of gestational age 34-36 weeks.
Group 3: consisted of 30 obese pregnant cases (BMI>30 kg/m2) with severe preeclampsia [with severe features] of gestational age 34-36 weeks.
Group 4: consisted of 30 normal weight pregnant cases with severe preeclampsia [with severe features] of gestational age 34-36 weeks.
Group 5: formed of 30 normal weight normal pregnant women of gestational age 34-36 weeks.
Group 1 after delivery consisted of 24 obese cases with non severe preeclampsia.
Group 2 after delivery: consisted of 22 normal weight cases with non severe preeclampsia.
Group 3 after delivery consisted of 23 obese cases with severe preeclampsia.
Group 4 after delivery: consisted of 26 normal weight cases with severe preeclampsia.
Group 5 after delivery: formed of 21 normal weight normal pregnant women.
Sample size calculation and the power of the study were determined by using creative research systems, the survey software-system. The sample size is calculated by using the confidence level of 95% & confidence interval of 14.78: it was found to be 30 cases in each group.
The power of the study was found to be 90%.
Sampling
Five ml of maternal venous blood was withdrawn from anti-cubital vein under complete aseptic conditions after an overnight fast (10-12 hours). The samples were collected and the serum was separated by centrifugation. The serum was divided in three parts: one was used for assessment of fasting blood glucose, the second was used to perform total lipid profile, and the third part was stored at -80°C until the time of assay of chemerin.
Methods of assay of the parameters studied included:
• Enzymatic chromatometry method was used to measure the levels of total cholesterol, triglycerides, and high-density lipoprotein.
• Low-density lipoprotein (LDL) was determined by using Friedewald et al. [12] equation: LDL (mg/dl) = total cholesterol - [HDL + (triglycerides/5)].
• Serum levels of glucose were measured by Glu-enzymatic U.V. method, Insulin was measured by electro-chemiluminescence immunoassay.
• Homeostasis Model Assessment Insulin Resistance (HOMA-IR) index for the assessment of insulin resistance was calculated by using the Matthews et al. [13] equation. HOMA-IR = [glucose (mg/dl) X insulin (mIU/ml)] ÷ 405.
• Serum chemerin concentrations were measured with the enzyme-linked immune-sorbent assay (ELISA) by using kits supplied by BioVendor Research Company. This assay recognizes recombinant and natural human chemerin.
Mean and standard deviation were used to describe data. Two tailed unpaired t-test was used to test for significant change in quantitative data. Two tailed paired t-test was used to test for significant change in chemerin levels two months after delivery as compared with the levels of the same cases during pregnancy. Pearson product moment correlation was used to test for the linear relationship between quantitative variables. P value was considered significant if less than 0.05. Statistical analysis was performed by using Statistical Package for Social scientists (SPSS) for Windows 7 (SPSS Inc., Chicago, IL, USA) run on IBM personal computer.
Table 1 represents the chemerin levels in the studied groups during pregnancy. The serum chemerin levels were significantly increased in obese cases with severe preeclampsia (group 3) as compared with obese cases with non severe preeclampsia (group 1) (p<0.0001). The serum chemerin levels were significantly increased in normal weight cases with preeclampsia (group 2 & group 4 cases) as compared with control group 5 women (p=<0.0004, p<0.0001). Group 4 cases had a significantly higher chemerin levels than group 2 cases (p <0.0001).
Table 1. Serum chemerin levels (ng/ml) in the studied groups during pregnancy
|
|
Group
1
during preg.
|
Group
2
during preg.
|
Group
3
during preg
|
Group
4
during preg.
|
Group
5
during preg.
|
|
Mean
|
250.267
|
210.33
|
310.24
|
272.12
|
165.27
|
|
± SD
|
± 40.957
|
± 53.423
|
± 36.885
|
± 36.174
|
± 37.423
|
|
P1
|
Group 1 during pregnancy versus group 2 during pregnancy
|
=0.002
|
|
P2
|
Group 3 during pregnancy versus group 4 during pregnancy
|
=0.0006
|
|
P 3
|
Group 2 during pregnancy versus group 4 during pregnancy.
|
<0.0001
|
|
P 4
|
Group 2 during pregnancy versus group 5 during pregnancy.
|
= 0.0004
|
|
P 5
|
Group 4 during pregnancy versus group 5 during pregnancy.
|
<0.0001
|
Unpaired t test: was used for p1 to p5
Group 1 and group 3 cases had a significantly higher levels of chemerin as compared with the levels of group 2 cases and group 4 cases (p=0.002 & p=0.0006, respectively).
Table 2 represents the serum chemerin levels two months after delivery as compared with the levels of these cases during pregnancy. The chemerin levels two months after delivery were significantly decreased in group 1 cases (p=0.0036), in group 2 cases (p=0.0028), in groups 3 & 4 cases (p<0.0001) and in group 5 cases (p=0.0003) as compared with the levels during pregnancy.
Table 2. Serum chemerin levels (ng/ml) in the studied groups during pregnancy versus 2 months after delivery
|
|
Mean ± SD
|
P value
|
|
Group 1 during pregnancy (24 cases)
|
241.371 ± 43.817
|
0.0036
|
|
Group 1 two months after delivery (24 cases)
|
203.872 ± 42.125
|
|
Group 2 during pregnancy (22 cases)
|
201.33 ± 57.647
|
= 0.0028
|
|
Group 2 two months after delivery (22 cases)
|
153.63 ± 39.65
|
|
Group 3 during pregnancy (23 cases)
|
284.24 ± 38.562
|
<0.0001
|
|
Group 3 two months after delivery (23 cases)
|
230.93 ± 36.362
|
|
Group 4 during pregnancy (26 cases)
|
267.12 ± 36.362
|
<0.0001
|
|
Group 4 two months after delivery (26 cases)
|
203.76 ± 33.49
|
|
Group 5 during pregnancy (21 cases)
|
151.36 ± 39.33
|
=0.003
|
|
Group 5 two months after delivery (21 cases)
|
117.84 ± 27.75
|
Table 3 represents anthropometric data and metabolic values in normal weight cases with non-severe preeclampsia (group 2), normal weight cases with severe preeclampsia (group 4) and normal weight normal pregnant women (group 5). The BMI values were significantly higher group 2 cases and group 4 cases as compared with control group 5 women (p=0.022 & p=0.045, respectively).
Table 3. Anthropometric data, and metabolic values in normal weight cases with non-severe PET (group 2), normal weight cases with severe PET (group 4) and normal weight pregnant cases (group 6)
|
|
Group 2
(30 cases)
|
Group 4
(30 cases)
|
Group 5
(30 cases)
|
P1
(Gr 2
Vs Gr 5)
|
P2
(Gr 4
Vs Gr 5)
|
P3
(Gr 2
Vs Gr 4)
|
|
Age
(years)
|
27.367 ± 1.829
|
27.12 ± 1.764
|
27.8 ± 1.789
|
= 0.358*
|
= 0.166*
|
=0.614*
|
|
BMI
(Kg/m2)
|
24.687 ± 0.267
|
24.792 ± 0.734
|
24.46 ± 0.455
|
= 0.022
|
=0.045
|
= 0.469*
|
|
Systolic BP
|
147.7 ± 2.891
|
161.84 ± 2.173
|
123.733 ± 8.021
|
<0.0001
|
<0.0001
|
<0.001
|
|
Diastolic BP
|
86.4 ± 1.163
|
91.64 ± 1.350
|
72.6 ± 2.191
|
<0.0001
|
<0.0001
|
<0.0001
|
|
FBGL (mg/dl)
|
96.333 ± 5.047
|
99.08 ± 5.016
|
84.0 ± 6.27
|
<0.0001
|
<0.0001
|
=0.049
|
|
Insulin (mIU/ml)
|
8.267 ± 0.639
|
9.88 ± 2.128
|
8.533 ± 0.973
|
= 0.216*
|
<0.0001
|
=0.0002
|
|
HOMA-IR
|
1.973 ± 0.234
|
2.408 ± 0.508
|
1.78 ± 0.321
|
= 0.010
|
<0.0001
|
=0.0002
|
|
Cholesterol
(mg/dl)
|
184.867 ± 22.331
|
199.2 ± 23.617
|
165.20 ± 24.585
|
<0.0001
|
<0.0001
|
= 0.0248
|
|
Triglycerides.
(mg/dl)
|
178.745 ± 76.758
|
227.64 ± 28.412
|
99.133 ± 20.8339
|
= 0.011
|
<0.0001
|
<0.0001
|
|
HDL
(mg/dl)
|
42.467 ± 5.970
|
37.88 ± 5.570
|
58.276 ± 8.302
|
<0.0001
|
<0.0001
|
= 0.005
|
|
LDL
(mg/dl)
|
116.493 ± 24.779
|
117.096 ± 22.466
|
86.77 ± 19.994
|
<0.0001
|
<0.0001
|
= 0.926*
|
*p value >0.05 & is not significant.
PET: preeclampsia, FBGL: fasting blood glucose level, HDL: high density lipoproteins, LDL: low density lipoproteins
In group 4 cases, the Systolic Blood Pressure (SBP) & Diastolic Blood Pressure (DBP) were significantly higher than the values of group 2 cases & control group 5 women (p<0.0001). The SBP & DBP were significantly higher in group 2 cases as compared with control group 5 women (p<0.0001).
The fasting insulin levels & HOMA-IR values were significantly increased in group 4 cases as compared with group 2 cases (p= 0.0002) and with control group 5 women (p<0.0001). In group 2 cases the fasting glucose levels & HOMA-IR were significantly increased as compared with control group 5 women (p<0.0001 & p=0.010, respectively).
The serum cholesterol, triglycerides & LDL levels were significantly increased in group 4 cases as compared with control group 5 women (p<0.0001), but the HDL levels were significantly decreased in group 4 cases as compared with control group 5 women (p<0.0001). Group 4 cases had significantly increased levels of cholesterol & triglycerides as compared with group 2 cases (p=0.0248 & p<0.0001, respectively).
The serum cholesterol, triglycerides & LDL levels were significantly increased in group 2 cases as compared with control group 5 women (p<0.0001, p=0.011, & p<0.0001, respectively), but HDL was significantly decreased in group 2 cases as compared with control group 5 women (p<0.0001).
Table 4 represents the anthropometric data and metabolic values in obese versus normal weight cases with non-severe preeclampsia (group 1 & group 2), and in obese versus normal weight cases with severe preeclampsia (group 3 & group 4).
Table 4. Anthropometric data and metabolic values in obese versus normal weight cases with non-severe PET (group 1 & group 2) & obese versus normal weight cases with severe PET (group 3 & group 4)
|
|
Group 1
(30 cases)
|
Group 2
(30 cases)
|
P1
(Gr. 1
Vs gr. 2)
|
Gr 3
(30 cases)
|
Gr 4
(30 cases)
|
P2
(Gr. 3
Vs Gr. 4)
|
|
Age (years)
|
27.067 ± 1.0483
|
27.367 ± 1.829
|
=0.439*
|
27.12 ± 1.236
|
27.12 ± 1.764
|
=0.879*
|
|
BMI (Kg/m2)
|
31.203 ± 0.7228
|
24.687 ± 0.267
|
<0.0001
|
31.984 ± 1.238
|
24.792 ± 0.734
|
<0.0001
|
|
Systolic BP
|
147.733 ± 2.81
|
147.7 ± 2.891
|
=0.965*
|
162.8 ± 2.901
|
161.84 ± 2.173
|
=0.192*
|
|
Diastolic BP
|
86.3 ± 1.418
|
86.4 ± 1.163
|
=0.766*
|
92.88 ± 3.270
|
91.64 ± 1.350
|
=0.086*
|
|
FBGL (mg/dl)
|
97.067 ± 6.074
|
96.333 ± 5.047
|
=0.613*
|
101.48 ± 6.104
|
99.08 ± 5.016
|
=0.135*
|
|
Insulin (mIU/ml)
|
8.767 ± 1.851
|
8.267 ± 0.639
|
=0.167*
|
10.08 ± 1.977
|
9.88 ± 2.128
|
=0.732*
|
|
HOMA-IR
|
2.11 ± 0.590
|
1.973 ± 0.234
|
=0.242*
|
2.547 ± 0.628
|
2.408 ± 0.508
|
0.394*
|
|
Cholesterol
(mg/dl)
|
209.833 ± 22.6778
|
184.867 ± 22.331
|
<0.0001
|
235.48 ± 29.978
|
199.2 ± 23.617
|
<0.0001
|
|
Triglycerides
(mg/dl)
|
187.633 ± 25.668
|
178.745 ± 76.758
|
=0.541*
|
257.8 ± 29.273
|
227.64 ± 28.412
|
<0.0001
|
|
HDL
(mg/dl)
|
34.967 ± 10.5911
|
42.467 ± 5.970
|
<0.00014
|
36.08 ± 10.472
|
37.88 ± 5.570
|
=0.452*
|
|
LDL
(mg/dl)
|
137.313 ± 23.029
|
116.493 ± 24.779
|
=0.0014
|
147.84 ± 33.052
|
117.096 ± 22.466
|
=0.0004
|
* p value >0.05 & is not significant.
PET: preeclampsia, FBGL: Fasting Blood Glucose Level, HDL: High Density Lipoproteins, LDL: Low Density Lipoproteins.
Group 1 cases had a significantly higher values of BMI (p=0.0001), total cholesterol (p<0.0001), and LDL (p=0.0014) as compared with the values in group 2 cases. The HDL levels were significantly decreased in group 1 cases as compared with group 2 cases (p=0.00014).
A significantly higher values of BMI (p< 0.0001), total cholesterol (p< 0.0001), triglycerides (p<0.0001), and LDL (p=0.0004) were found in group 3 cases as compared with the values in group 4 cases.
Table 5 represents the anthropometric data and metabolic values in obese cases with non-severe preeclampsia (group 1) as compared with obese cases with severe preeclampsia (group 3).
Table 5. Anthropometric data and metabolic values in obese cases with non-severe PET (group 1) & obese cases with severe PET (group 3)
|
|
Group 1
(30 cases)
|
Group 3
(30 cases)
|
P
(Group 1 Versus group 3)
|
|
Age (years)
|
27.067 ± 1.048
|
27.12 ± 1.236
|
= 0.864*
|
|
BMI (Kg/m2)
|
31.203 ± 0.723
|
31.984 ± 1.238
|
= 0.005
|
|
Systolic BP
|
147.733 ± 2.899
|
162.8 ± 2.901
|
<0.0001
|
|
Diastolic BP
|
86.3 ± 1.418
|
92.88 ± 3.270
|
<0.0001
|
|
FBGL (mg/dl)
|
97.067 ± 6.074
|
101.48 ± 6.104
|
= 0.009
|
|
Insulin (mIU/ml)
|
8.767 ± 1.851
|
10.08 ± 1.977
|
= 0.014
|
|
HOMA-IR
|
2.11 ± 0.590
|
2.547 ± 0.628
|
= 0.0104
|
|
Cholesterol mg/dl)
|
209.833 ± 2.678
|
235.48 ± 29.978
|
<0.0001
|
|
Triglycerides (mg/dl)
|
187.633 ± 25.668
|
257.8 ± 29.273
|
<0.0001
|
|
HDL (mg/dl)
|
34.967 ± 10.591
|
36.08 ± 10.472
|
= 0.698*
|
|
LDL (mg/dl)
|
137.313 ± 23.029
|
147.84 ± 33.052
|
= 0.171*
|
*p value >0.05 & is not significant.
PET: preeclampsia, FBGL: Fasting Blood Glucose Level, HDL: High Density Lipoproteins, LDL: Low Density Lipoproteins
The BMI values were significantly higher (p=0.005) in group 3 cases as compared with group 1 cases. In group 3 cases, the SBP & DBP were significantly higher than in group 1 cases (p<0.0001). The fasting glucose levels, insulin & HOMA-IR were significantly increased in group 3 cases as compared with group 1 cases (p= 0.009, p= 0.014 & 0.0104, respectively).
Group 3 cases had significantly increased levels of cholesterol & triglycerides as compared with group 1 cases (p<0.0001).
Table 6 shows correlation values between chemerin and other parameters in the studied groups. Serum chemerin shows a significant positive correlation with BMI in the obese group1 & 3 (p=0.05 & p=0.001, respectively). Also, the serum chemerin levels were positively correlated with the diastolic blood pressure in groups 1, 3 & 4 (p=0.018, p=0.005, & p=0.036, respectively).
Table 6. Correlation between chemerin and other parameters in the studied groups
|
|
|
Group 1
|
Group 2
|
Group 3
|
Group 4
|
Group 5
|
|
BMI
(kg/m2)
|
r
|
0.595
|
0.45
|
0.761
|
0.541
|
0.033
|
|
P
|
0.05 (S)
|
0.07
|
0.001 (S)
|
0.038 (S)
|
0.907
|
|
SBP (mm.Hg)
|
r
|
0.251
|
0.312
|
0.663
|
0.666
|
0.745
|
|
P
|
0.349
|
0.222
|
0.011 (S)
|
0.007 (S)
|
0.001 (S)
|
|
DBP
(mm.Hg)
|
r
|
0.582
|
0.176
|
0.685
|
0.55
|
0.142
|
|
P
|
0.018 (S)
|
0.499
|
0.005 (S)
|
0.034 (S)
|
0.617
|
|
Glucose
(mg/dl)
|
r
|
0.543
|
0.068
|
0.098
|
0.088
|
0.344
|
|
P
|
0.03 (S)
|
0.796
|
0.729
|
0.775
|
0.209
|
|
Insulin
(mIU/ml)
|
r
|
0.614
|
0.026
|
0.574
|
0.371
|
0.001
|
|
P
|
0.05 (S)
|
0.921
|
0.025(S)
|
0.168
|
0.997
|
|
HOMA-IR
|
r
|
0.623
|
0.054
|
0.586
|
0.386
|
0.144
|
|
P
|
0.05 (S)
|
0.838
|
0.03 (S)
|
0.156
|
0.608
|
|
Cholesterol (mg/dl)
|
r
|
0.672
|
0.456
|
0.558
|
0.443
|
0.154
|
|
P
|
0.034 (S)
|
0.066
|
0.04 (S)
|
0.107
|
0.514
|
|
Triglycerides (mg/dl)
|
r
|
0.605
|
0.541
|
0.634
|
0.543
|
0.329
|
|
P
|
0.01 (S)
|
0.04 (S)
|
0.011 (S)
|
0.036 (S)
|
0.232
|
|
HDL
(mg/dl)
|
r
|
- 0.179
|
- 0.196
|
-- 0.458
|
- 0.649
|
- 0.192
|
|
P
|
0.508
|
0.451
|
0.086
|
0.0001 (S)
|
0.492
|
|
LDL
(mg/dl)
|
r
|
0.648
|
0.353
|
0.147
|
0.486
|
0.199
|
|
P
|
0.007 (S)
|
0.165
|
0.601
|
0.066
|
0.475
|
(S): P value is significant (p<0.05). HDL: High Density Lipoproteins, LDL: Low Density Lipoproteins
In the obese groups (1 & 3), serum chemerin showed a significant positive correlation with insulin & HOMA-IR (p<0.05). Serum chemerin showed a significant positive correlation with cholesterol in groups 1 & 3 (p<0.034). A positive significant correlation was found between serum chemerin and triglycerides in groups 1, 2, 3, 4 (p<0.036). Serum chemerin was negatively correlated with HDL in all groups that was significant only in group 4 (p=0.0001).
Two months after delivery, the serum chemerin was positively significantly correlated with insulin levels in group 3 (r: 0.546, p=0.04), with HOMA-IR in group 1 (r: 0.594, p=0.041), and with cholesterol in group 1 (r: 0.583, p=0.03) (Graphs 1-9).
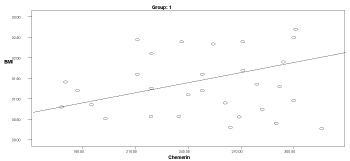
Graph 1. Correlation between chemerin and BMI in group 1
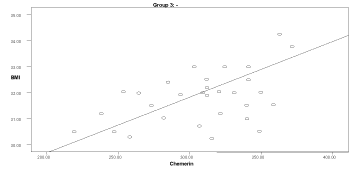
Graph 2. Correlation between chemerin and BMI in group 3
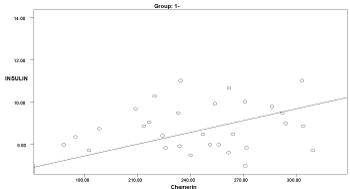
Graph 3. Correlation between chemerin and insulin in group 1
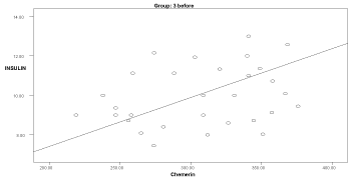
Graph 4. Correlation between chemerin and insulin in group 3 before delivery
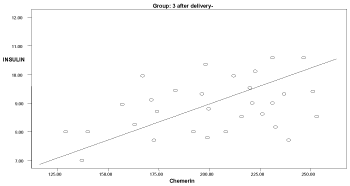
Graph 5. Correlation between chemerin and insulin in group 3 after delivery
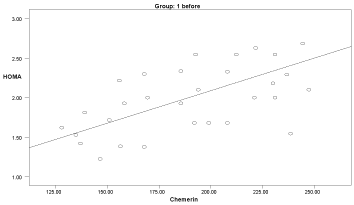
Graph 6. Correlation between chemerin and HOMA-IR in group 1 before delivery
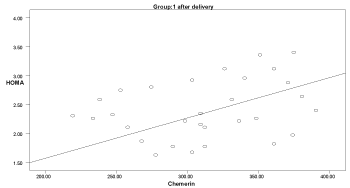
Graph 7. Correlation between chemerin and HOMA-IR in group 1 after delivery
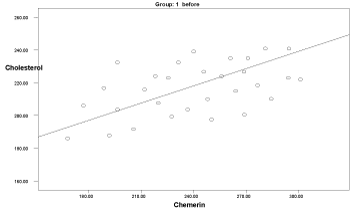
Graph 8. Correlation between chemerin and cholesterol in group 1 before delivery
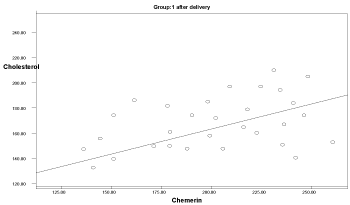
Graph 9. Correlation between chemerin and cholesterol in group 1 after delivery
Plasma levels of chemerin showed a strong and independent association marker of metabolic syndrome; suggesting that chemerin may play a role in the development of different phenotypes of the metabolic syndrome and it may be of value as a biomarker for this disorder [4].
In the present study, the serum chemerin levels were significantly higher (p<0.028) in obese preeclamptic cases than in non-obese cases. The high levels of chemerin in obese preeclamptic cases can be explained by proteolytic cleavage of chemerin in adipose tissue to the bioactive form [14].
Also in the present study, the serum chemerin levels in obese cases with preeclampsia showed a significant positive correlation with HOMA-IR values, insulin, cholesterol, and triglycerides (p<0.05). The results of the present study are in agreement with findings of Li et al. [5] and Barker et al. [15] reporting that chemerin concentration was correlated to insulin sensitivity and obesity of pregnant women.
It was found that chemerin has an antitumor role due to chemo-attraction of natural killer (NK) cells and dendritic cells [16]. It was found that tumor invasion in small cell lung cancer cells occurred if chemerin was highly expressed in the tumor cells [16]. Also, chemerin expression levels were found to be significantly higher in the healthy liver cells as compared with the liver cancer cells, restricting tumor invasion [17]. These results suggest that chemerin may play an important role in the development and progression of carcinoma.
Preeclampsia was found to be accompanied with superficial trophoblast cells invasion and incomplete spiral artery remodeling. Trophoblast cells have invasion features similar to the tumor cells, and can invade into the decidua tissue and uterine spiral arteries in a restrictive manner. Chemerin and its receptors are all expressed by placental trophoblast cells. The levels of chemerin in preeclampsia were found to be increased as compared to those of normal pregnancy. This suggests that chemerin may participate in the development of preeclampsia by regulating the trophoblast cell invasion [18].
In the present study, the serum chemerin levels in preeclamptic cases were significantly higher than in the corresponding controls. The chemerin levels were significantly increased in severe preeclampsia as compared with non-severe preeclampsia. Also, the serum chemerin levels showed a positive correlation with the high blood pressure levels in pregnant cases with preeclampsia. These findings are in agreement with the findings of Stepan et al. [19] and Cetin et al. [20].
In the present study, serum chemerin levels were positively correlated with systolic and diastolic blood pressure. This is in agreement with previous report that there was a positive correlation of chemerin with systolic/diastolic blood pressure in white population [21].
It was found that the serum chemerin level was significantly higher in postpartum patients with preeclampsia than postpartum women with normal pregnancy, and high levels of chemerin were associated with abnormal glucose and lipid metabolism and high incidence rate of hypertension [19].
Dyslipidemia may be involved in the pathogenesis of preeclampsia. Abnormal lipid profiles may have a role in the promotion of oxidative stress and vascular dysfunction in preeclampsia [22]. Abnormal lipid profile may play an important role in the modifications of the endothelial structure and function in preeclampsia [22]. Normally, HDL-cholesterol facilitates transport of the potentially harmful cholesterol from peripheral tissues to the liver, where it can be excreted. Low levels of HDL-cholesterol may compromise the function of all these processes.
In the present study, the concentrations of triglycerides, total cholesterol and LDL were found to be significantly increased in the preeclamptic cases. This finding is in agreement with the finding that LDL (especially oxidized LDL) increases artery sensitivity to pressor agents and inhibits endothelial-dependant vasodilatation resulting in preeclampsia [23].
Also in the present study, cases with preeclampsia had significantly decreased levels of HDL-cholesterol than the normal pregnant controls (p< 0.0001). This finding is in agreement with the previous report that HDL-cholesterol was decreased significantly in preeclampsia [24].
It was found by Xu et al. [25] that chemerin could promote the proliferation, migration, and tube formation of human placental micro-vascular endothelial cells (HPMECs), promoting the formation of blood vessels in human placenta and it activates receptors pathways, which may be involved in the occurrence and progression of preeclampsia. They concluded that chemerin could be a therapeutic target for the treatment of preeclampsia [25].
It is concluded that serum maternal chemerin levels were increased in cases with preeclampsia, more in cases with severe PET, as compared with the normotensive women. Chemerin levels were correlated with HOMA-IR and dyslipidemia.
Also, chemerin may play an unclear etio-pathological role in preeclampsia by the one of the following mechanisms: (1) High levels of chemerin can induce high blood pressure through CMKLR1 receptor in the vessels walls. (2) Chemerin may be involved in regulation of trophoblastic invasion of spiral arteries.
So, researches on chemerin as a therapeutic target to treat cases with preeclampsia may be suggested in the future.
The limitation is the small number of cases.
We acknowledge all our patients for their cooperation, and all the laboratory technicians for their help and effort.
None.
- ACOG Task Force on Hypertension (2013) Obstetrics and Gynecology November 122: 1122-1131.
- Bodnar LM, Ness RB, Markovic N, Roberts JM (2005) The risk of preeclampsia rises with increasing pre-pregnancy body mass index. Ann Epidemiol 15: 475–82.
- Forest JC, Girouard J, Masse J, Moutguin JM, Kharfi A, et al. (2005) Early occurrence of metabolic syndrome after hypertension in pregnancy. Obstet Gynecol 105: 1373-1380. [Crossref]
- Bozaoglu K, Bolton K, McMillan J, Zimmet P, Jowett J, et al. (2007) Chemerin is a novel adipokine associated with obesity and metabolic syndrome. Endocrinology 148: 4687-4694.
- Li Y, Shi B, Li S (2014) Association between serum chemerin concentrations and clinical indices in obesity or metabolic syndrome: a meta-analysis. PloS One 9: e113915. [Crossref]
- Yang M, Yang G, Dong J, Liu Y, Zong H, et al. (2010) Elevated plasma levels of chemerin in newly diagnosed type 2 diabetes mellitus with hypertension. J Investig Med 58: 883-886
- Yang X, Quan X, Lan Y, Ye J, Wei Q, et al. (2017) Serum chemerin level during the first trimester of pregnancy and the risk of gestational diabetes mellitus. Gynecol Endocrinol 33: 770-773.
- Wittamer V, Franssen JD, Vulcano M, Mirjolet JF, Le Poul E, et al. (2003) Specific recruitment of antigen-presenting cells by chemerin, a novel processed ligand from human inflammatory fluids. J Exp Med 198: 977-985. [Crossref]
- Watts SW, Dorrance AM, Penfold ME, Rourke JL, Sinal CJ, et al. (2013) Chemerin connects fat to arterial contraction. Arterioscler Thromb Vasc Biol 33: 1320-1328. [Crossref]
- Kostopoulos CG, Spiroglou SG, Varakis JN, Apstolakis E, Papadaki HH (2014) Chemerin and CMKLR1 expression in human arteries and periadventitial fat: a possible role for local chemerin in atherosclerosis? BMC Cardiovasc Disord 14: 56. [Crossref]
- WHO: International Obesity Task Force. Managing the Global Epidemic of Obesity. Report of the WHO Consultation on Obesity, Geneva 5-7 June, 1998. WHO: Geneva. [http://www.who.int/whr/1998/en/whr98 _ en.pdf] (05 June 2011).
- Friedewald WT, Levy RI, Friedrickson D (1972) Estimation of the concentration of low-density lipoprotein cholesterol in plasma, without use of the preparative ultracentrifuge. Clin Chem 18: 499-502. [Crossref]
- Matthews DR, Hosker JP, Rodenski AS, Naylor BA, Treacher DF, et al. (1985) Homeostasis model assessment: insulin resistance and B-cell function from fasting plasma and insulin concentration in man. Diabetologia 28: 412-419.
- Du XY, Leung LL (2009) Proteolytic regulatory mechanism of chemerin bioactivity. Acta Biochem Biophys Sin (Shanghai) 41: 973-979. [Crossref]
- Barker G, Lim R, Rice GE, Lappas M (2012) Increased chemerin concentrations in fetuses of obese mothers and correlation with maternal insulin sensitivity. J Matern Fetal Neonatal Med 25: 2274-2280.
- Mariani F, Roncucci L (2015) Chemerin/chemR23 axis in inflammation, onset and resolution. Inflamm Res 64: 85-95. [Crossref]
- Lin W, Chen YL, Jiang L, Chen JK (2011) Reduced expression of chemerin is associated with a poor prognosis and a lowed infiltration of both dendritic cells and natural killer cells in human hepatocellular carcinoma. Clinical Laboratory 57: 879-885.
- Qing-Qing Z, Xiu-Jun F, Jian Z (2015) The Role of Adipokine Chemerin in Pregnancy Complications. Prog Biochem Biophys 42: 962-968.
- Stepan H, Philipp A, Roth I, Krahsch S, Jank A, et al. (2011) Serum levels of the adipokine chemerin are increased in preeclampsia during and 6 months after pregnancy. Regul Pept 168: 69-72. [Crossref]
- Cetin O, Kurdoglu Z, Kurdoglu M, Sahin HG (2017) Chemerin level in pregnancies complicated by preeclampsia and its relation with disease severity and neonatal outcomes. J Obstet Gynaecol 37: 195-199. [Crossref]
- Gao X, Mi S, Zhang F, Gong F, Lai Y, et al. (2011) Association of chemerin mRNA expression in human epicardial tissue with coronary atherosclerosis. Cardiovasc Diabet 10: 87. [Crossref]
- Adiga U, D’Souza V, Kamath A, Mangalore N (2007) Antioxidant activity, lipid peroxidation in preeclampsia. J Chin Med 70: 435-438.
- Qiu C, Phung TT, Vadachkoria T, Muy-Rivera M, Sanchez SE, et al. (2006) Oxidised low density lipoprotein and the risk of Preeclampsia. Physiol Re 55: 491-500.
- Belo L, Caslake M, Gaffney D, Santos-Silva A, Pereira-Leite L, et al. (2002) Changes in LDL size and HDL concentration in normal and preeclamptic pregnancies. Atherosclerosis 162: 425-432. [Crossref]
- Xu H, Duan D, Niu J, Lei Q, Zhou Y, et al. (2018) Chemerin promotes the viability and migration of human placental micro-vascular endothelial cells and activates MAPK/AKT signaling. Int J Clin Exp Med 11: 721-727. [Crossref]


