Background
Tympanoplasty is the procedure of choice for surgical correction of tympanic membrane perforation triggered by either chronic suppurative otitis media or trauma. Various types of autologous grafts have been used. We evaluated refractive disorders in Albino children of Brazzaville and assessed their impact on the visual acuity of these children.
Aim
Was to evaluate different prognostic factors affecting Tympanoplasty as well as comparing Temporalis Fascia versus cartilage graft tissues used in Tympanoplasty and their impact on patient hearing improvement at Al Hada Hospital through objective assessment of hearing by audiogram and closure of air bone gap.
Methods
This is a retrospective cohort study conducted during a period of 6 month enrolling 80 patients admitted to at Al Hada Hospital. Data was collected from operation room’s logbook. Data sheet contained age, gender, size and site of perforation, graft type, duration, approach, technique of graft replacement, preoperative and postoperative audiogram. Preoperative and postoperative audiometric assessments were conducted using average pre- and post-operative pure tone audiometry (PTA) as well as average air-bone gap (ABG).
Results
Showed a preoperative PTA of 37.99 for cartilage graft vs. 36.04 for TF, a Preoperative ABG of 38.62 for cartilage graft vs 32.56 for TF. While, Postoperative PTA was 40 for cartilage graft vs 32.84 for TF and postoperative ABG was 40.82 for cartilage graft vs 28.18 for TF.
Conclusion
No significant difference was evident in the results of Tympanoplasty, neither in the health of the tympanic membrane after surgery nor in hearing development influenced by age, gender, size and site of perforation. Both temporalis fascia and tragal cartilage-perichondrium are suitable graft materials for Tympanoplasty. However, temporalis fascia was superior to cartilage graft in hearing improvement. Although the results were not statistically significant. Nevertheless, large prospective trials are necessary to collect high-quality data.
tympanoplasty, temporalis Fascia, cartilage graft, hearing improvement
The intact tympanic membrane serves an important role in transferring and amplifying sounds from the outer perimeter into the middle ear. It also works to protect the middle ear from entering the water. Bacteria, microbes, and exotic objects, where the middle ear is considered a clean, non-pollutant place, and if a hole in the tympanic membrane migration of bacteria back into middle ear occur and causing infections [1].
A tympanic membrane perforation (ruptured eardrum or a perforated eardrum) is a tear or hole in the thin tissue separating eardrum from the ear canal. Usually, a tympanic membrane perforation will heal itself without treatment within a few weeks. However, in some cases, it requires surgical repair for it to heal properly. Perforation of your TM may cause Tinnitus, Vertigo, bleeding, pain and in severe cases hearing loss [2].
In the present study, we aim to compare the outcomes between using temporalis fascia and cartilage at Al Hada Hospital.in hearing improve and protection of middle ear from particles and water.
This is a retrospective cohort study conducted during a period of 6 month enrolling 80 patients at Al Hada Hospital. Data was collected from operation room’s logbook.
- Data sheets contained Study group characteristics such as age, gender, size and side of perforation, graft type, Tympanoplasty Approach and technique of graft replacement and preoperative and postoperative audiogram.
- Pre- and post-operative Pure-tone audiometry (PTA) was used as a behavioural test to measure hearing sensitivity.
- Results of air-bone gap (ABG) on audiometry has also been recorded which plays a crucial role in the interpretation of pure-tone audiograms.
The air-bone gap (ABG) can be 0 dB, positive, or negative and is used to classify audiograms as conductive, sensorineural, or mixed hearing losses. In cases of normal hearing for pure tones and sensorineural hearing loss, the mean ABG is expected to be 0 dB. In cases of conductive and mixed hearing losses, the ABG is expected to be positive (greater than 10 dB). Negative ABGs are usually interpreted as resulting from measurement error or from the variability inherent in air-conduction (AC) and bone-conduction (BC) thresholds [3].
In order to assess baseline hearing and compare hearing outcomes of the two groups, preoperative and post-operative PTA were done to all patients, pure tone and air bone gap averages of three frequencies were calculated.
- Kruskal-Wallis H ;which is a rank-based nonparametric test was used to determine if there are statistically significant differences between Age and Size of perforation on the results of Pre-and Post-operative PTA and ABG while Mann-Whitney U test was also used to compare differences between AB with variability in gender, side and type of the graft ( temporalis fascia versus cartilage graft) [4,5].
Participants’ Characteristics
Age: The table below shows the distribution of the study sample according to age. Study Population can be divided into age groups:15% between 12 and 20 years, 42.5% between 21 and 40 years and 40% between 41 and 60 years, as also shown in (Figure 1) and (Table 1).
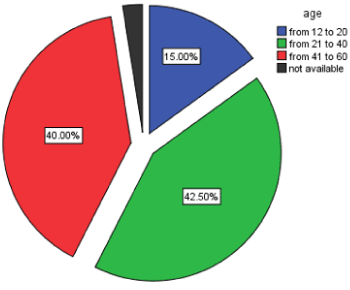
Figure 1. Perceived quality of postnatal care 1-30 days after birth: satisfaction of mothers after live birth (N=1055) and stillbirth (Meier Magistretti et al, 2014, p.37)
Table 1. Distribution of study sample according to age
Age |
Frequency |
Percent |
From 12 to 20 years |
12 |
15% |
From 21 to 40 years |
34 |
42.5% |
From 41 to 60 years |
32 |
40% |
Not available |
2 |
2.5% |
Total |
80 |
100% |
Gender: Table 2 shows the distribution of the study sample according to gender. 37.5% were males while 62.5% were females.
Table 2.Distribution of study sample according to Gender
Gender |
Frequency |
Percent |
Male |
30 |
37.5% |
Female |
50 |
62.5% |
Total |
80 |
100% |
Size of Perforation: Table 3 shows the distribution of the study sample according to the size of perforation, we noticed that 36.3% of the study sample had a moderate perforation size, 43.8% were subtotal, while 12.5% of the study sample had a marginal size of perforation while only 6.3% of the study sample has a total perforation as also shown in Figure 2.
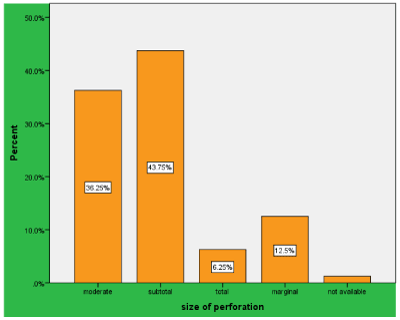
Figure 2. Size of perforation among the study population
Table 3. Distribution of study sample according to Size of perforation
Size of perforation |
Frequency |
Percent |
Moderate |
29 |
36.3% |
Subtotal |
35 |
43.8% |
Total |
5 |
6.3% |
Marginal |
10 |
12.5% |
Not available |
1 |
1% |
Total |
80 |
100% |
Side of the Perforation: 45% of the study sample had perforation on the right side while 53.8% had a left perforation as shown in Table 4 and Figure 3.
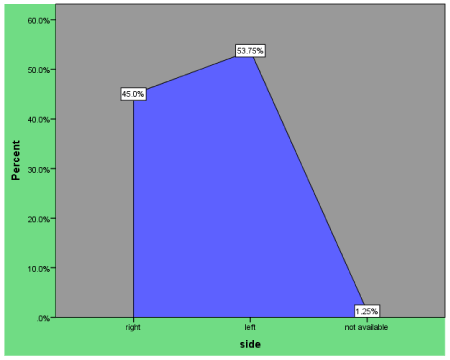
Figure 3. Side of the Perforation for the included study sample
Table 4.Distribution of study sample according to Side
Side |
Frequency |
Percent |
Right |
36 |
45% |
Left |
43 |
53.75% |
Not available |
1 |
1.25% |
Total |
80 |
100% |
Type of Graft:
The Table 5 below shows the distribution of the study sample according to type of graft, we noticed that 48.75% of the study sample had undergone Cartilage graft while 50% had undergone temporalis fascia as also shown in Figure 4.
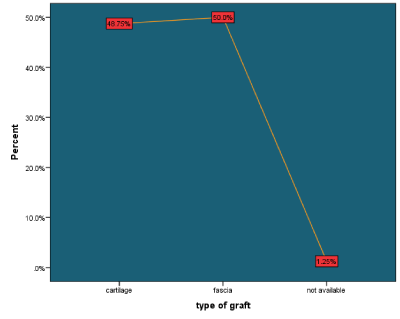
Figure 4. Type of graft among the study sample
Table 5.Distribution of study sample according to type of graft
type of graft |
Frequency |
Percent |
Cartilage |
39 |
48.75% |
Temporalis fascia |
40 |
50% |
Not available |
1 |
1.25% |
Total |
80 |
100% |
Tympanoplasty Approach: The Table 6 below shows the distribution of the study sample according to the approach used. Majority; 86.25% was Retro auricular followed by Trans-canal (11.25%) then Endural (1.25%) (Figure 5).
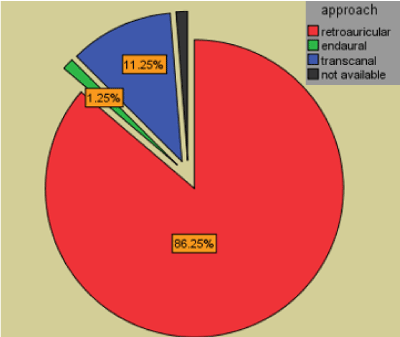
Figure 5. Tympanoplasty Approach among study sample
Table 6. Distribution of study sample according to Approach
Approach |
Frequency |
Percent |
Retro auricular |
69 |
86.25% |
Endaural |
1 |
1.25% |
trans canal |
9 |
11.25% |
Not available |
1 |
1.25% |
Total |
80 |
100% |
Technique of Graft Placement: The Table 7 below shows the distribution of the study sample according to technique of graft placement, 77.5%underlay while 7.5% overlay as also shown in Figure 6.
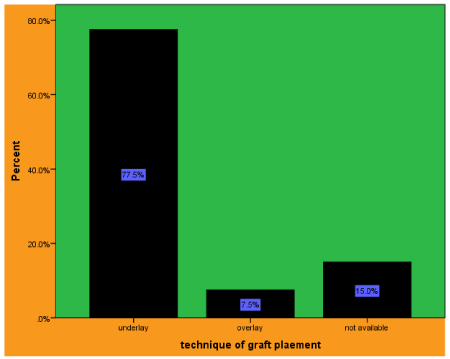
Figure 6. Technique of graft placement
Table 7.Distribution of study sample according to technique of graft placement
technique of graft placement |
Frequency |
Percent |
Underlay |
62 |
77.5% |
Overlay |
6 |
7.5% |
Not available |
12 |
15% |
Total |
80 |
100% |
Main Outcome and Measures
Multivariate analysis comparing preoperative and postoperative hearing results of the included patients with respect to preidentified variables such as:
Age: Data for 78 patients was available and given in Table 8.
Table 8. Kruskal-Wallis Test results outcome for pre- and to determine the direction of variation in the study sample according to the age variable
Statement |
Age |
N. |
Mean Rank |
Statement |
Age |
N. |
Mean Rank |
pre pure tone average |
From 12 to 20 years |
12 |
34.65 |
post pure tone average |
From 12 to 20 years |
12 |
28.95 |
From 21 to 40 years |
34 |
34.53 |
From 21 to 40 years |
34 |
32.63 |
From 41 to 60 years |
32 |
39.22 |
From 41 to 60 years |
32 |
42.16 |
Total |
78 |
Total |
78 |
pre air bone gap average |
From 12 to 20 years |
12 |
37.06 |
post air bone gap average |
From 12 to 20 years |
12 |
38.11 |
From 21 to 40 years |
34 |
36.94 |
From 21 to 40 years |
34 |
34.18 |
From 41 to 60 years |
32 |
32.29 |
From 41 to 60 years |
32 |
32.48 |
Total |
78 |
Total |
78 |
- There are differences in the pre pure tone average according to the age variable in favour of 41 to 60 years with an average grade of (39.22).
- There are differences in the pre air bone gap average according to the age variable in favour of 12 to 20 years with an average grade of (37.06).
- There are differences in the post pure tone average according to the age variable in favour of 41 to 60 years with an average grade of (42.16).
- There are differences in the post air bone gap average according to the age variable in favour of 12 to 20 years with an average grade of (38.11).
Gender: See Table 9
Table 9. Mann-Whitney Test Results To determine the direction of variation in the study sample according to the gender variable
Statement |
Gender |
N. |
Mean Rank |
Statement |
Gender |
N. |
Mean Rank |
pre pure tone average |
Male |
30 |
41.29 |
post pure tone average |
Male |
30 |
41.91 |
Female |
50 |
35.2 |
Female |
50 |
33.94 |
Total |
80 |
|
Total |
80 |
|
pre air bone gap average |
Male |
30 |
36.96 |
post air bone gap average |
Male |
30 |
38.35 |
Female |
50 |
35.44 |
Female |
50 |
32.85 |
Total |
80 |
|
Total |
80 |
|
- There are differences in the pre pure tone average according to the gender variable in favour of male with an average grade of (41.29).
- There are differences in the pre air bone gap average according to the gender variable in favour of male with an average grade of (36.96).
- There are differences in the post pure tone average according to the gender variable in favour male with an average grade of (41.91).
- There are differences in the post air bone gap average according to the gender variable in favour of male with an average grade of (38.35).
Size of perforation: See Table 10
Table 10.Kruskal-Wallis Test Results To determine the direction of variation in the study sample according to the Size of perforation variable
Statement |
Size of Perforation |
N. |
Mean Rank |
Statement |
Size of Perforation |
N. |
Mean Rank |
pre pure tone average |
Moderate |
29 |
41.5 |
post pure tone average |
Moderate |
29 |
39.17 |
Subtotal |
35 |
36.69 |
Subtotal |
35 |
35.04 |
Total |
5 |
50.63 |
Total |
5 |
49.75 |
Marginal |
10 |
21.85 |
Marginal |
10 |
29.75 |
Total |
79 |
78.19 |
Total |
79 |
74.21 |
pre air bone gap average |
Moderate |
29 |
58.52 |
post air bone gap average |
Moderate |
29 |
35.37 |
Subtotal |
35 |
38.8 |
Subtotal |
35 |
37.06 |
Total |
5 |
19 |
Total |
5 |
17.13 |
Marginal |
10 |
24.3 |
Marginal |
10 |
30.89 |
Total |
79 |
|
Total |
79 |
|
- There are differences in the pre pure tone average according to the variable in favour of Total with an average grade of (50.63).
- There are differences in the pre air bone gap average according to the Size of perforation variable in favour of Total with an average grade of (58.52).
- There are differences in the post pure tone average according to the Size of perforation variable in favour Total with an average grade of (49.75).
- There are differences in the post air bone gap average according to the Size of perforation variable in favour of Subtotal with an average grade of (37.06).
Side of Perforation: See Table 11
Table 11. Mann-Whitney Test Results To determine the direction of variation in the study sample according to the side variable
Statement |
Side |
N. |
Mean Rank |
Statement |
Side |
N. |
Mean Rank |
pre pure tone average |
Right |
36 |
36.3 |
post pure tone average |
Moderate |
36 |
36.9 |
Left |
43 |
37.64 |
Subtotal |
43 |
36.14 |
Total |
79 |
|
Total |
79 |
|
pre air bone gap average |
Moderate |
36 |
35.29 |
post air bone gap average |
Moderate |
36 |
33.66 |
Subtotal |
43 |
35.69 |
Subtotal |
43 |
35.25 |
Total |
79 |
|
Total |
79 |
|
- There are differences in the pre pure tone average according to the Side variable in favour of Left with an average grade of (37.64).
- There are differences in the pre air bone gap average according to the Side variable in favour of Left with an average grade of (35.69).
- There are differences in the post pure tone average according to the Side variable in favour of Right with an average grade of (36.90).
- There are differences in the post air bone gap average according to the Side variable in favour of Left with an average grade of (35.25)
Type of graft: See Table 12
Table 12. Mann-Whitney Test Results to determine the direction of variation in the study sample according to the type of graft variable
Statement |
type of graft |
N. |
Mean Rank |
Statement |
type of graft |
N. |
Mean Rank |
pre pure tone average |
Cartilage |
39 |
37.99 |
post pure tone average |
Cartilage |
35 |
40.37 |
Fascia |
40 |
36.04 |
Fascia |
45 |
32.84 |
Total |
79 |
|
Total |
80 |
|
pre air bone gap average |
Cartilage |
39 |
38.62 |
post air bone gap average |
Cartilage |
35 |
40.82 |
Fascia |
40 |
32.56 |
Fascia |
45 |
28.18 |
Total |
79 |
|
Total |
80 |
|
- There are differences in the pre pure tone average according to the type of graft variable in favour of Cartilage with an average grade of (37.99)
- There are differences in the pre air bone gap average according to the type of graft variable in favour of Cartilage with an average grade of (38.62)
- There are differences in the post pure tone average according to the type of graft variable in favour of Cartilage with an average grade of (40.37)
- There are differences in the post air bone gap average according to the type of graft variable in favour of Cartilage with an average grade of (40.82).
The present study is a retrospective study enrolling 80 patients between the age of 12 to 60 years, who were admitted in the Department of E.N.T and Head and Neck Surgery at Al Hada Hospital, Taif, Saudi Arabia between January 2008 to December 2016.
This entire study group of patients suffered from Chronic Suppurative Otits Media. Patients in this study were from all socioeconomic groups, including patients referred from other practitioners also. Tympanoplasty is a term used to describe reconstruction of the tympanic membrane and sound conducting mechanism of the ear. Since its first description in 1952 by Wullstein and Zollner various materials have been used for Tympanoplasty [6].
Tympanoplasty is the final step in the surgical conquest of conductive hearing loss and is the culmination of over 100 years of development of surgical procedures on the middle ear to improve hearing [7].
Effect of Age and Gender on Tympanoplasty outcome (hearing improvement): Some studies suggested that the success of the graft integration in children is slightly lower than in adults and that this is due to the fact that children have persistent dysfunction of the Eustachian tube, recurrent infections of the respiratory tract with otorrhea, and lack of development of the immune system [8].
In our study, the age varied from 12 to 60 years old and the tympanic membrane hearing improvement was slightly improved for the age group 12-20 years old with no significance for older groups like other studies which also indicated that age is not a prognostic factor. In our study, females were predominant over males (63% vs 38%). However, there was no statistically significant correlation between sex and success rate, which was similar in other studies [9].
Effect of Side and Size of Perforation on Tympanoplasty outcome: In our study, only moderate perforation encountered a noticeable improvement when comparing pre- and post-operative in the PTA results (58.52 to 35.37) while no significance was observed for the total, subtotal and marginal sizes
On the other hand, in a study done by Wu et al. comparing the short- and long-term hearing outcomes of patients with small and large eardrum perforations who underwent successful inlay cartilage Tympanoplasty, no differences were apparent between the short- and long term air bone gap closure (p=0.689) of small perforations [10]. However, a significant difference between short- and long-term closure (p=0.029) was evident in patients with large perforations.
Effect of type of Graft on Tympanoplasty outcome
Many studies have been conducted to compare the hearing results of patients with cartilage tympanoplasty, using perichondrium and it was concluded that hearing results after cartilage tympanoplasty are comparable to temporalis fascia and perichondrium [11]. Furthermore, Dornhoffer J suggested that Cartilage graft is preferred by some surgeons due to its easy technique, minimal scarring and no significant postoperative morbidity. However, it is preferred especially in cases of large or anteriorly placed perforations or those with associated Eustachian tube dysfunction [12].
Conversely, Cavaliere M et al. suggested that temporalis fascia is considered superior with respect to the rate of graft uptake driven by its low basal metabolic rate. In addition to its availability and firm thickness comparable to normal tympanic membrane which is in line with the results of our study where an improvement was observed for the average preoperative vs. postoperative PTA (36.04 vs 32.84) and ABG (32.56 vs 28.18) compared to outcome of the cartilage graft where average preoperative vs. postoperative PTA (37.99 vs 40.37) and ABG (38.62 vs 40.82).
Is it statistically significant?
Thus, we can conclude that Temporalis Fascia has better hearing improvement outcome than cartilage graft.
No significant differences were evident in the results of Tympanoplasty, neither in the health of the tympanic membrane after surgery nor in hearing development influenced by age, gender, size and site of perforation. Both temporalis fascia and tragal cartilage–perichondrium are suitable graft materials for Tympanoplasty. However, temporalis fascia was superior to cartilage graft in hearing improvement, although the results were not statistically significant. Nevertheless, large prospective trials are necessary to collect high-quality data. Our result based on Post op audio-logic assessment from 2-6 months (short term), on the long term.
Outcomes may be similar or even in favour of cartilage. Any studies available?
- Leider C (2018) Tympanic Membrane Perforation: Symptoms, Causes, And Treatment Options. Houston ENT & Allergy.
- Margolis RH, Wilson RH, Popelka GR, Eikelboom RH, Swanepoel DW, et al. (2016) Distribution Characteristics of Air-Bone Gaps-Evidence of Bias in Manual Audiometry. Ear Hear 37: 177. [Crossref]
- McKight PE, Najab J (2010) Kruskal‐Wallis Test. The corsini encyclopedia of psychology, (4th edn) John Wiley, Hoboken, NJ, USA pp: 30-31.
- Crichton N (2000) Mann-Whitney Test. J Clin Nurs 9: 583.
- Wullstein HL (1952) Functional operations in the middle ear with split-thickness skin graft. Arch Otorhinolaryngol 161: 422-435.
- Sismanis A (2003) Tympanoplasty Glassock-Shambough Surgery of the ear. 5th edn, Elsevier India 24: 462-483.
- Lee P, Kelly G, Mills RP (2002) Myringoplasty: does the size of the perforation matter? Clin Otolaryngology 27: 331-334.
- Karela M, Berry S, Watkins A, Phillipps JJ (2008) Myringoplasty: surgical outcomes and hearing improvement: is it worth performing to improve hearing? Eur Arch Oto-Rhino-Laryngol 265: 1039-1042. [Crossref]
- Wu PW, Wang WH, Huang CC, Lee TJ, Huang CC (2015) Comparison of short- and long-term hearing outcomes of successful inlay cartilage tympanoplasty between small and large eardrum perforations. Clin Exp Otorhinolaryngol 8: 359-363. [Crossref]
- Wielgosz R, Mroczkowski E (2006) Assessment of the hearing results in tympanoplasties with the use of palisade-technique. Otolaryngol Pol 60: 901-905. [Crossref]
- Cavaliere M, Mottola G, Rondinelli M, Iemma M (2009) Tragal cartilage in tympanoplasty: anatomic and functional results in 306 cases. Acta Otorhinolaryngol Ital 29: 27-32. [Crossref]
- Dornhoffer J (1997) Hearing results with cartilage tympanoplasty. Laryngoscope 107: 1094-1099. [Crossref]


