Many clinical trials that are based on the efficacy demonstrated in preclinical models fail to achieve the expected outcome. The preclinical models used include mainly cell cultures and animal models. Also, in the last few years, 3-dimensional (3D)-like formations, such as spheroids and organoids, are being used. A unique ex vivo organ culture to elucidate the mechanism of action and efficacy of new drugs was recently reported. However, its usage is not yet widespread. In previous work, we reported the selectivity of oncolytic viruses in a model of cancerous colorectal tissue. In this study, we evaluated the relevance of this model in comparison to conventional cell cultures. To this end, we conducted a bioinformatics analysis of gene expression in various colorectal cancer cell lines and compared them to the gene expression of colorectal cancer tissues obtained from 32 patients. The results showed that the expression of genes, including those directly related to colorectal cancer progression, varied significantly between the different cell lines. In contrast, in tissues that originated from patients, gene expression was more consistent.
The results from this analysis highlight the need to carefully choose a cell line that reflects the transcript of the human tissue to be studied. Furthermore, we conclude that bioinformatics analysis might be a useful tool for determining the most appropriate experimental model. The use of organ cultures directly derived from patients might be a more accurate model to evaluate the efficacy of a given therapy.
ex vivo, organ culture, cell culture, cancer model, bioinformatics, virus-host interactions
Most studies exploring virus-host interactions, screening, designing, and evaluating antiviral drugs [1], and studying the effect of viruses on cancer (oncolytic therapy), are performed in cell cultures or in vivo in animal models [2-4]. Neither of these approaches reflects the human situation. Cell cultures, which are being used since the fifties of the past century, lack the three-dimensional structure containing the extracellular matrix (ECM), miss the various cell types present in the organ, and lack innate immunity factors. Furthermore, in cell culture, the cells usually replicate and evolve much faster than in the solid tissue. This characteristic is translated to heterogeneity both for normal and tumor cell lines [5]. On the other hand, cell lines do not retain tumor heterogeneity, and this may cause misleading interpretations of experimental results and explain the discrepancy between successful drug validation in preclinical models and the failure in phase 3 clinical trials that will follow [5,6]. These limitations must be considered when attempting to use these models for practical application. There is a need to determine which is the most suitable model for evaluating a given treatment. Among the experimental models including various cell types, are spheroid 3D cultures [7,8], a system that allows cells in culture to grow and differentiate in several directions. Matrigel, natural ECM-based hydrogel, is yet another useful model for 2D and 3D cell cultures, enabling better attachment of cells and allowing the cells to be organ-like structured. Also, by this method, different cell types can be combined to study the relations between them (https://www.sciencemag.org/features/2017/04/adding-depth-cell-culture). Animal models also have limitations [9,10] and are often based on the use of immune-deficient animals. These models are usually inadequate for drawing conclusions regarding the final treatment stage in humans [11].
Recently, a new model was introduced, which harbors the 3D structure of intact tissue [12,13]. These human ex vivo organ cultures preserve more faithfully the in vivo tissue architecture and can better represent disease-associated changes, and may be more appropriate for analyzing the interaction of viruses with normal and cancer tissues [14-18]. Using this methodology, we have previously demonstrated the selective oncolytic effect of Newcastle Disease Virus (NDV) in fresh human colon cancer as compared to the adjacent normal tissue [18].
The main focus of the current analysis was to determine if cells in cultures originated from the same type of cancer tissue express coherent gene levels similar to those found in the same type of solid cancerous tissue removed from patients, and in comparison to their adjacent normal tissue.
To this end, since bioinformatics data describes the transcriptomic response to different treatments [15], in this study, we used a bioinformatics-based analysis to find the best experimental model that mimics the in vivo human response.
To study gene expression variability in different cell lines and tissues from the same cancer type, we used data available for colorectal cancer. For cell lines, we used the gene expression from 20 cell lines available from Array Express (E-MTAV-37 [19]): COLO201, COLO320HSR, HCT15, HCT8, LS1034, LS174T, NCIH508, NCIH716, NCIH747, RKOE6, SW1116, SW1417, SW403, SW48, SW480, SW620, SW837, SW948, T84, WIDR.
For the level of gene expression in colorectal cancerous and adjacent normal tissues, we used data obtained from tissues removed by surgery from 32 human patients provided by NCBI-GEO datasets GSE8671 [20].
Statistical analysis was performed using the Partek Genomic Suite program version 7.18.0402.
Using the Gene expression path for RMA normalization, t-test, ANOVA, volcano plot, PCA analysis, and Venn diagram calculation and display were used. Histograms were created using Matlab program version 7. In the Venn diagram, we selected two views. One, counting genes with standard deviation (SD) <1 as coherent gene expression in both groups (cell lines and tissue) and the second, counting SD>1.2 representing non-coherent gene expression in both groups.
To demonstrate consistency, we selected two gene groups from the KEGG colorectal cancer pathway (https://www.genome.jp/kegg-bin/show_pathway?hsa05210) and an additional key protein in colorectal cancer [20].
To choose a reliable research model, we first performed a bioinformatics analysis on two datasets from 32 patients to see if there is a significant difference between cancerous colon tissue and adjacent normal colon tissue.
Figure 1 shows a complete separation of the gene expression levels in cancerous and normal tissue. The Principal Component Analysis (PCA) plot shows that the level of gene expression is significantly different between the two tissue types. Figure 2, which presents a volcano diagram of the gene expression levels in cancerous and normal tissues, shows a clear difference in the expression levels of the genes in both types of tissue.
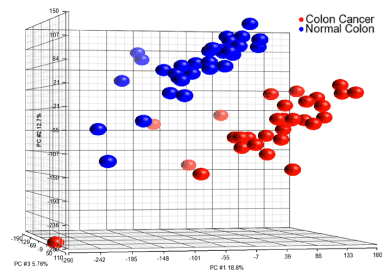
Figure 1. Principal Component Analysis (PCA) plot for the comparison of the transcriptomes of 32 prospectively collected colorectal adenomas with those of normal mucosa obtained from the same individuals. A clear segmentation between the gene expression of cancer (red) and normal (blue) tissues is shown
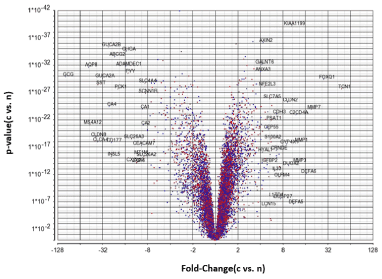
Figure 2. Volcano analysis (X-fold change cancerous tissue gene expression / normal tissue gene expression , Y-p value) for the comparison of the transcriptomes of 32 prospectively collected colorectal adenomas (c) with those of their counterpart normal mucosa (n) obtained from the same individuals
Further analysis was done on specific genes from the datasets. We inspected the expression of two key factors of colorectal cancer, as indicated by the Kegg pathway, TP53 and CCND1 [20] (https://www.genome.jp/kegg-bin/show_pathway?hsa05210). As indicated, the expression levels of the genes from the colorectal cancer tissues and the normal tissues were consistent. In contrast, in the colorectal cancer cell lines, the expression of the same genes was highly variable (Figures 3A and 3B).
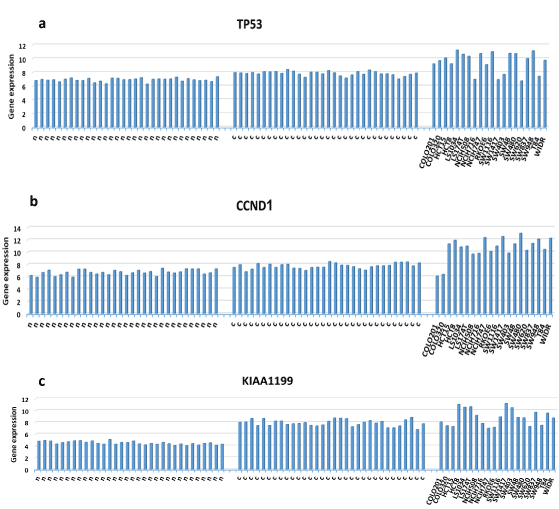
Figure 3. Expression variability of three key genes in colorectal cancer progression: TP53 (a), CCDN1 (b), and KIAA1199 (c). Note the low variability of the expression in the colon tissues (left and middle) compared to the high expression variability in several colorectal cancer cell lines (right). n - normal colon tissues, c- matched cancerous colon tissues, named – cell lines
We further evaluated the expression of the KIAA199 gene, which was previously shown to be upregulated in colorectal cancer tissues [20], in the cell lines and colorectal cancer tissue. This gene was shown to influence the proliferation, adhesion, and invasiveness of cancer cells [21]. The results show that the expression of KIAA199 is consistent in the cancer tissues, while its expression differs between the various cell lines (Figure 3C).
The information obtained from these two datasets was inspected for the standard deviation of the gene expression profile to determine the coherence of gene expression in samples of the cell lines and the samples of the patients' cancerous tissues. It was defined that a standard deviation higher than 1.2 reflects a lack of coherency of a particular gene. The results (Figure 4) show that gene expression in the cell lines is much more scattered, with many genes above the established threshold. Comparison of the standard deviations between the cancerous cell lines and the cancerous tissues originated from the patients shows consistent (Figure 5A) and inconsistent (Figure 5B) gene expression and the overlapping genes in both groups. Among the colorectal cancer cell lines, 1,005 genes were inconsistent with a standard deviation greater than 1.2, while between the cancerous colorectal tissues originated from different patients, only 101 genes had inconsistent gene expression. Only 40 genes overlapped for gene expression inconsistency in the two groups. Interestingly, inconsistent gene expression in the tissues was not related to colon cancer progression, while several inconsistently expressed genes in cell lines were related to colorectal cancer progression.
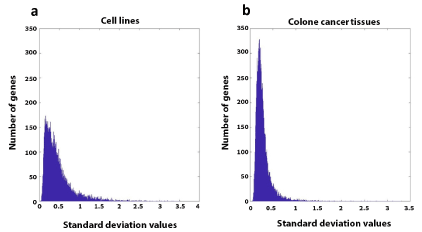
Figure 4. Histograms demonstrating the scattered spread of standard deviation values of the gene expression of various colorectal cancer cell lines (a) and colorectal cancer tissues (b)
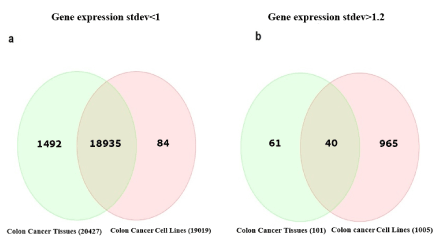
Figure 5. Venn diagram of standard deviation low and high levels in cell lines vs tissues. a-Venn of standard deviation low levels (<1) in both. b- Venn of standard deviation high levels (>1.2) in both. Stdev-standard deviation
When comparing the consistency of gene expression between the groups, 19,019 genes were consistent between the different cancerous cell lines, while 20,427 were consistent between the cancerous tissues originated from all the patients.
Two classical methods have been used for decades to evaluate new drugs and treatments: cell lines and animal models. Cell lines are mainly grown in 2-dimensional (2D) layers and bear many limitations that might be the cause of the high rate of failure in clinical trials [22,23]. 2D monolayers cannot reproduce conformation, organization, or native architecture of intact tissues as they appear in vivo, and animal models often do not mimic human disease [10]. Thus, other models, such as 3D spheroids and organoids, are being evaluated [6,8,10,24]. For example, Zanoni et al. [8] used 3D spheroids to enhance the biological relevance of anticancer drug evaluation.
In previous work, an oncolytic NDV was evaluated in colorectal cancer tissue and was found to be highly selective for cancerous tissues obtained from patients, while in the normal tissues, minor to no signs of infection or cell death were observed [18]. In this study, we asked if cell lines can be used to study virus-host interactions, or whether organ cultures are necessary to obtain reliable results.
To establish a better model for screening and evaluation of drugs and to better understand virus-host interactions, in the present study, we compared gene expression levels from cancerous colon cell line cultures to cancerous colon tissue and its adjacent normal tissue obtained from patients. A computational analysis of gene expression of the normal and the cancerous tissue showed a different gene expression pattern. Besides, in another analysis, we compared tumor tissue and cultured colorectal cancer cells to examine possible differences between the two models and to determine which model is better suited for further use. From the results, it appears that organ cultures are more predictive than classical cell lines. In tissues, there are several barriers (such as the ECM) that might limit the viral infection, while monolayer cultures from the same indication may get infected more easily and with different outcomes [14-18]. Thus, the use of organ cultures in research can help in making better decisions regarding the means of treatment and efficiency of drugs.
A high level of gene expression variation in cell cultures compared to tissues was found in this study. When we examined these variations, we found that, while between the 32 different patient-derived tumors, there were only 101 genes differentially expressed, more than 1,000 genes differed in colorectal cancer cell lines. Narrowing the examination, we found that even genes related to colorectal cancer transformation and tumor progression (CCND1, TP53, and KIAA1199) varied between the different cell lines but where much more coherent in the cancer tissues [20], (https://www.genome.jp/kegg-bin/show_pathway?hsa05210). Thus, using a variety of cancer cell lines might significantly change the results and lead to wrong predictions regarding the effect on patients.
Using the appropriate in vitro culture may pave the way for improved therapy and drug discovery [12,13,17]. Using similar methods might provide a basis for understanding the differences in the interaction of the oncolytic viruses with different tissues and help to understand their mechanism of action [16,18]. Also, ex vivo organ culture models were found to be highly informative for studying virus-host interactions and for the assessment of drug efficacy, as was previously mentioned regarding Zika, Herpes, Influenza, and Coronaviruses [14,15,25,26]. The ex vivo organ cultures originated from fresh tissue obtained from the surgery and thus were very close to the natural state.
Ex vivo organ culture allows us to identify proteins that are related to a given therapy. Using this approach, a more specific and adequate treatment can be adapted to a particular component within the tissue. As we showed in this study, in cell lines, there is an incoherent expression of genes, including some of those that are directly related to colorectal cancer progression. The 3D fresh tissue culture might predict a better outcome of the different therapies for the type of indication, and using an organ culture that originated from specific patients might help to predict better what treatment will work best in that particular person [18].
In summary, this report highlights the significance of ex vivo organ cultures for the assessment of drugs and virus-host interactions. This model can fill the gap between the in vitro, in vivo, and clinical trials and expedite the path to personalized precision medicine.
- Franco EJ, Rodriquez JL, Pomeroy JJ, Hanrahan KC, Brown AN (2018) The effectiveness of antiviral agents with broad-spectrum activity against chikungunya virus varies between host cell lines. Antivir Chem Chemother 26: 2040206618807580. [Crossref]
- Kasloff SB, Pizzuto MS, Benussi SM, Pavone S, Ciminale V, et al. (2014) Oncolytic activity of avian influenza virus in human pancreatic ductal adenocarcinoma cell lines. J Virol 88: 9321-9334. [Crossref]
- Song KY, Wong J, Gonzalez L, Sheng G, Zamarin D, Fong Y (2010) Antitumor efficacy of viral therapy using genetically engineered Newcastle disease virus [NDV(F3aa)-GFP] for peritoneally disseminated gastric cancer. J Mol Med (Berl) 88: 589-596. [Crossref]
- Felt SA, Droby GN, Grdzelishvili VZ (2017) Ruxolitinib and polycation combination treatment overcomes multiple mechanisms of resistance of pancreatic cancer cells to oncolytic vesicular stomatitis virus. J Virol 91: e00461-17. [Crossref]
- David BU, Siranosian B, Ha G, Tang H, Oren Y (2018) Genetic and transcriptional evolution alters cancer cell line drug response. Nature 560: 325-330.
- Siolas D, Hannon GJ (2013) Patient-derived tumor xenografts: transforming clinical samples into mouse models. Cancer Res 73: 5315-5319.
- Bresciani G, Hofland LJ, Dogan F, Giamas G, Gagliano T, et al. (2019) Evaluation of spheroid 3D culture methods to study a pancreatic neuroendocrine neoplasm cell line. Front Endocrinol (Lausanne) 10: 682. [Crossref]
- Zanoni M, Piccinini F, Arienti C, Zamagni A, Santi S, et al. (2016) 3D tumor spheroid models for in vitro therapeutic screening: a systematic approach to enhance the biological relevance of data obtained. Sci Rep 6: 19103.
- Gopinathan A, Morton JP, Jodrell DI, Sansom OJ (2015) GEMMs as preclinical models for testing pancreatic cancer therapies. Dis Model Mech 8: 1185-200. [Crossref]
- Wilding JL, Bodmer WF (2014) Cancer cell lines for drug discovery and development. Cancer Res 74: 2377-2384. [Crossref]
- Deruiter JR, Wessels LFA, Jonkers J (2018) Mouse models in the era of large human tumour sequencing studies. Open Biol 8:180080. [Crossref]
- Nicholas B, Staples KJ, Moese S, Meldrum E, Ward J, et al. (2015) A novel lung explant model for the ex vivo study of efficacy and mechanisms of anti-influenza drugs. J Immunol 194: 6144-6154. [Crossref]
- Namekawa T, Ikeda K, Inoue HK, Inoue S (2019) Application of prostate cancer models for preclinical study: advantages and limitations of cell lines, patient-derived xenografts, and three-dimensional culture of patient-derived cells. Cells 8: 74. [Crossref]
- Weisblum Y, Panet A, Rones ZZ, Kochman HR, Wohl GD, et al. (2011) Modeling of human cytomegalovirus maternal-fetal transmission in a novel decidual organ culture. J Virol 85: 13204-13213.
- Weisblum Y, Djian OE, Vorontsov OM, Kochman HR, Rones ZZ, et al. (2017) Zika virus infects early- and midgestation human maternal decidual tissues, inducing distinct innate tissue responses in the maternal-fetal interface. J Virol 91: 1-10.
- Gal KD, Zamir G, Edden Y, Pikarsky E, Pikarsky A, et al. (2008) Herpes simplex virus type 1 preferentially targets human colon carcinoma: role of extracellular matrix. J Virol 82: 999-1010.
- Braun E, Zimmerman T, Hur TB, Reinhartz E, Fellig Y, et al. (2006) Neurotropism of herpes simplex virus type 1 in brain organ cultures. J Gen Virol 87: 2827-2837. [Crossref]
- Tayeb S, Rones ZZ, Panet A (2015) Therapeutic potential of oncolytic newcastle disease virus: A critical review. Oncolytic Virother 4: 49-62.
- Krupp M, Itzel T, Maass T, Hildebrandt A, Galle PR, et al. (2013) CellLineNavigator: a workbench for cancer cell line analysis. Nucleic Acids Res 41: D942-8. [Crossref]
- Bellver SJ, Flier LG, Palo M, Cattaneo E, Maake C, et al. (2007) Transcriptome profile of human colorectal adenomas. Mol Cancer Res 5: 1263-1275.
- Zhang Y, Jia S, Jiang WG (2014) KIAA1199 and its biological role in human cancer and cancer cells (review). Oncol Rep 31: 1503-1508. [Crossref]
- Moffat JG, Vincent F, Lee JA, Eder, J, Prunotto M (2017) Opportunities and challenges in phenotypic drug discovery: an industry perspective. Nat Rev Drug Discov 16: 531-543.
- Dodd SF (2005) Target-based drug discovery: is something wrong? Drug Discov Today 10: 139-147.
- Chua ACY, Ananthanarayanan A, Ong JJY, Wong JY, YIP A, et al. (2019) Hepatic spheroids used as an in vitro model to study malaria relapse. Biomaterials 216: 119221.
- Hui KP, Chan LL, Kuok DI, Mok CK, Yang ZF, et al. (2017) Tropism and innate host responses of influenza A/H5N6 virus: an analysis of ex vivo and in vitro cultures of the human respiratory tract. Eur Respir J 49: 1601710. [Crossref]
- Hui KPY, Cheung MC, Perera R, NG KC, Bui CHT, et al. (2020) Tropism, replication competence, and innate immune responses of the coronavirus SARS-CoV-2 in human respiratory tract and conjunctiva: an analysis in ex-vivo and in-vitro cultures. Lancet Respir Med 8: 687-695.


