Objective: We wanted to compare the outcome and cost of open and thoracoscopic (VATS) pneumonectomy.
Introduction: The primary objective of this study was to compare the in-hospital mortality and morbidity of patients who underwent pneumonectomy either by thoracoscopy or thoracotomy approaches. We also wanted to determine risk factors for in-hospital mortality (death during hospital admission) and/or morbidity after pneumonectomy.
Methodology: The Healthcare Cost and Utilization Project (HCUP), sponsored by The Agency for Healthcare Research and Quality's (AHRQ), includes the largest collection of longitudinal hospital care data in the United States. The data in the HCUP databases primarily include data from non-federal community hospitals. HCUP creates the National In-patient Sample (NIS) to help conduct national and regional analysis of in-patient care. NIS was the primary database used for this research purpose. The NIS is derived from the State In-patient Databases (SID) and approximates a 20% sample of discharges from all HCUP community hospitals in the U.S. Unweighted, it contains data from more than 7 million hospital stays each year. Weighted, it estimates more than 35 million hospitalizations nationally.
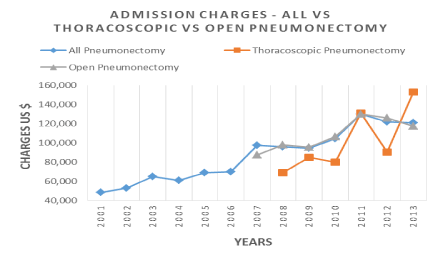
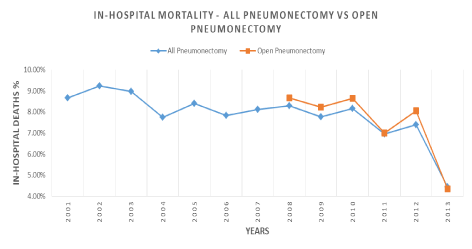
Results: We enrolled a total of 37,037 patients. Since 2001, the number of pneumonectomies have decreased from 3,518 to 1920 in 2013.The in-hospital mortality was 8.67 % in 2001 which is down to 4.43% in 2013. Mean charge increased from 48,412 $ in 2001 to 121069 $ in 2013. Also, there is no change in routine discharges, use of nursing home, rehabilitation institutions, home health care over the years 2008 to 2012. Mean length of hospital stay was 9.2 days. Total deaths in our study were 2959 patients.
Conclusions: Thoracoscopic pneumonectomies decrease cost and are discharged to home more frequently as compared to open pneumonectomies.
thoracic surgery, vats pneumonectomies, surgical mortality and morbidity
Abbreviations
AHRQ: The Agency for Healthcare Research and Quality's; HCUP: The Healthcare Cost and Utilization Project; SID: State Inpatient Databases; NIS: National Inpatient Sample (NIS); ICD-9-CM : International Classification of Diseases, Clinical Modification (ICD-9-CM); VATS: Video associated thoracoscopic surgery.
Pneumonectomy is a procedure which has a significant morbidity and mortality. It is a complex procedure which requires specialized teams for perioperative care. VATS procedure is being advocated to decrease some of the morbidity but at the cost of learning a new and different surgical skill set application. We examined the Nationwide In-patient Sample (NIS) database to compare short-term post-operative outcomes following open and Thoracoscopic Pneumonectomy. Thoracoscopic (video-assisted thoracic surgery) lobectomy has been demonstrated to be associated with fewer postoperative complications compared with open thoracotomy lobectomy in several large case series. However, as no randomized trial has been performed, there are many who question this. We wanted to assess the current state of Thoracoscopic Pneumonectomies and its economic impact across the country. To investigate that, we decided to look at the multiyear data provided by the Agency for Healthcare Research and Quality's (AHRQ). The applicability of thoracoscopic pneumonectomy is also debated, with many arguing that the technique is limited to specialized centers and not the general community.
The primary objective of this study was to compare the in-hospital mortality and morbidity of patients who underwent Pneumonectomy either by Thoracoscopy or Thoracotomy approaches. We also wanted to determine risk factors for in-hospital mortality (death during hospital admission) and/or morbidity after pneumonectomy.
AHRQ’s mission is to produce evidence to make health care safer, more accessible, of a higher quality, equitable, and affordable [1]. The Healthcare Cost and Utilization Project (HCUP) is a family of databases and related software tools and products developed through a Federal-State-Industry partnership and sponsored by AHRQ. HCUP includes the largest collection of longitudinal hospital care data in the United States [2].
The Agency for Healthcare Research and Quality (AHRQ) has maintained the NIS database since 1988. The NIS is the largest publicly available all-payer in-patient health care database in the United States, yielding national estimates of hospital inpatient stays. The data in the HCUP databases primarily include data from non-federal community hospitals. HCUP creates the National Inpatient Sample (NIS) to make it possible for researchers to conduct national and regional analyses of hospital use and the hospital charges and costs associated with in-patient care. The NIS is derived from the State In-patient Databases (SID) and approximates a 20% sample of discharges from all HCUP community hospitals in the U.S. Unweighted, it contains data from more than 7 million hospital stays each year. Weighted, it estimates more than 36 million hospitalizations nationally taken from more than 4,000 HCUP participating hospitals. Data contained within the NIS include patient and hospital demographics, admission and treating diagnosis, in-patient procedures, in-hospital mortality, length of hospital stay, hospital charges, as well as discharge status. The NIS data set has numerous internal quality measures and is validated by the Health Care Cost and Utilization Project (HCUP) by comparison with other similar databases (http://www.hcup-us.ahrq.gov/nisoverview.jsp). This study was approved by the Institutional Review Board and conforms to the data-use agreement for the NIS from HCUP.
We wanted primarily to assess the current state of Thoracoscopic Pneumonectomy surgery across the country and compare it to the non-VATS Pneumonectomies. With this in mind, using the National Inpatient Sample database, we performed a retrospective cohort study that involved patients who underwent pneumonectomies. To identify these patients, we used three ICD 9 CM procedure codes: A. 32.5 pneumonectomy (excision of lung NOS and pneumonectomy (with mediastinal dissection)), B. 32.50 thoracoscopic pneumonectomy, C. 32.59 Other and unspecified pneumonectomy (excludes: thoracoscopic pneumonectomy (32.50))
In October 2007, ICD-9-CM and CPT code updates were done. The National Center for Health Statistics (NCHS) and the Centers for Medicare & Medicaid Services (CMS) released the 2008 ICD-9-CM (International Classification of Diseases, ninth revision, Clinical Modification) updates. Two new codes: 32.50 and 32.59 were added to ICD-9-CM Procedures-all codes list which were effective on Oct 1, 2007. So, the data before 2007 has all pneumonectomies listed together under 32.5, while the data after 2007 is divided between 32.50 and 32.59 [3].
Then, using national estimates, we identified associations of patient demographics and hospital characteristics with in-patient postoperative outcomes. We queried our desired ICD 9 code using HCUPnet, which is an on-line query system based on NIS data.
The definitions of all the patient and hospital demographics and outcome measures are available on HCUPnet. We first analyzed the national trends of this ICD code from year 2001 to 2013. We reviewed all patients who had pneumonectomy from 2001 to 2013 in USA (from NIS database).
All patients who underwent thoracoscopic and open pneumonectomies were assessed separately after 2007. Then we restricted the discharges to operating room procedures only, which are defined as "valid O.R. procedures" based on Diagnosis Related Groups coding principles. Since the ICD coding changed after 2007, we did our further analysis on cases from 2008 to 2013. Then we did a detailed analysis of 2012 data, so that we could have outcomes representing the most recent advances in medical care provided in the latest academic environment. We analyzed 2012 variables’ teaching status, payer and insurance status, and the effect of hospital volume and geographical location on in-patient outcomes. Then we did a comparison between thoracoscopic and non-thoracoscopic pneumonectomies [4–10].
We used Excel and HCUP Z-score calculator for our statistical analysis. We considered a p-value of less than 0.05 for significance. For continuous data, we analyzed the actual numbers and for dichotomous data we used percentage comparisons to get a more meaningful result. Statistics based on 10 or fewer weighted cases in the nationwide statistics (NIS) are not reliable. These statistics are suppressed and are designated with an asterisk (*)
We analyzed a total of 37,037 Pneumonectomy patients. Since 2001, the number of Pneumonectomies have decreased from 3,518 then to 1,920 in 2013.The in-hospital mortality was 8.67% in 2001 which is down to 4.43% in 2013. Total deaths in our study population were 2,959 patients. Mean charge for the hospital stay was $48,412/- in 2001, rising to $121,069/- in 2013. 7% of these patients were admitted through emergency room and 1% from other hospitals (data from 2001-2006). Nursing home utilization after discharge was 9.70% in 2001 which remained stable at 9.64 in 2013 but on the other hand home health services utilization was 15.72% in 2001 and increased to 23.44% in 2013. Routine discharge averaged at 61% for the whole patient population. Average length of stay was 9 days.
For 2008 to 2013, we analyzed data separately for thoracoscopic and open pneumonectomy. A total of 1,246 thoracoscopic cases and 14,528 open pneumonectomies were reviewed. Open pneumonectomy admission had a higher admission charge (Figure 1). Factors responsible for higher charges include age 18-44, male gender, medicare patients, teaching hospital and west region of USA.

Figure 1. Admission charges of Thoracoscopic vs Open pneumonectomies from 2001 to 2013 in US$
Average mortality from 2008 to 2013 is 7.16%. Factors associated with highest mortality are age 1-17yr (18.62%), male gender, un-insured patients, low income patients, private hospitals, small size hospitals and the western region of U.S.A (Table 1).
Table 1: Mortality risk factors all pneumonectomies
|
YEAR
|
2008
|
2009
|
2010
|
2011
|
2012
|
2013
|
|
In-hospital Deaths
|
8.28%
|
7.76%
|
8.15%
|
6.96%
|
7.38%
|
4.43%
|
|
Age group
(years)
|
1-17
|
*
|
*
|
18.62%
|
*
|
*
|
*
|
|
18-44
|
13.23%
|
13.52%
|
17.68%
|
5.52%
|
16.13%
|
*
|
|
45-64
|
5.80%
|
4.52%
|
6.62%
|
6.97%
|
5.50%
|
3.09%
|
|
65-84
|
10.37%
|
10.76%
|
6.11%
|
6.96%
|
7.77%
|
5.52%
|
|
Sex
|
Male
|
8.89%
|
7.73%
|
9.27%
|
7.43%
|
8.86%
|
6.48%
|
|
Female
|
7.07%
|
7.82%
|
5.85%
|
6.17%
|
5.11%
|
*
|
|
Payer
|
Medicare
|
9.27%
|
9.75%
|
8.20%
|
7.25%
|
9.64%
|
5.48%
|
|
Medicaid
|
11.07%
|
12.51%
|
14.92%
|
10.63%
|
8.89%
|
4.88%
|
|
Private insurance
|
7.16%
|
4.21%
|
5.84%
|
4.87%
|
4.49%
|
3.75%
|
|
Median income for zip code
|
Low
|
10.75%
|
10.53%
|
7.63%
|
6.97%
|
5.00%
|
4.08%
|
|
Not low
|
7.34%
|
6.38%
|
8.25%
|
6.90%
|
7.96%
|
4.74%
|
|
Owner
|
Government
|
8.68%
|
11.05%
|
9.53%
|
11.15%
|
6.85%
|
8.77%
|
|
Private, not-for-profit
|
8.16%
|
5.98%
|
6.91%
|
6.74%
|
7.76%
|
3.08%
|
|
Private, for-profit
|
8.25%
|
20.13%
|
20.13%
|
7.41%
|
*
|
8.57%
|
|
Teaching status
|
Nonteaching
|
10.64%
|
11.69%
|
8.60%
|
10.73%
|
9.00%
|
5.38%
|
|
Teaching
|
6.97%
|
5.53%
|
7.83%
|
5.29%
|
6.77%
|
4.00%
|
|
Bed size
|
Small
|
9.55%
|
*
|
6.33%
|
*
|
18.18%
|
15.63%
|
|
Medium
|
9.54%
|
12.28%
|
12.86%
|
9.06%
|
11.63%
|
4.23%
|
|
Large
|
7.93%
|
7.10%
|
7.48%
|
6.59%
|
4.73%
|
3.20%
|
|
Region
|
Northeast
|
9.35%
|
5.51%
|
1.94%
|
6.19%
|
9.71%
|
3.39%
|
|
Midwest
|
4.58%
|
5.78%
|
7.66%
|
6.98%
|
5.77%
|
2.44%
|
|
South
|
10.04%
|
7.78%
|
11.93%
|
9.37%
|
7.54%
|
6.88%
|
|
West
|
7.59%
|
13.60%
|
6.36%
|
*
|
*
|
*
|
|
Weighted national estimates from HCUP Nationwide Inpatient Sample (NIS) (AHRQ), based on data collected by individual States and provided to AHRQ by the States. Statistics based on 10 or fewer weighted cases in the nationwide statistics (NIS and KID) are not reliable. These statistics are suppressed and are designated with an asterisk (*).
|
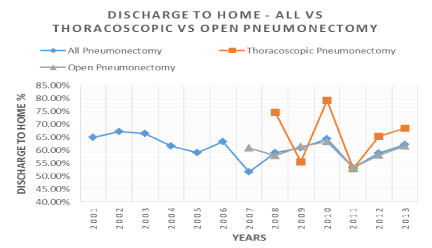
Open Pneumonectomies had a higher mortality per year (Figure 2). For majority of the years, Thoracoscopic discharges to home were more as compared to Open Pneumonectomies.

Figure 2. Inhospital mortality of All pneumonectomies compared to open pneumonectomies. 2001-2013

Figure 3. . Discharge (%) to home of thoracoscopic vs. open pneumonectomies
Minimally invasive surgery is progressing rapidly in thoracic surgery. However, it is felt that its utilization is not optimal for the treatment of thoracic diseases. A literature review yielded both a systemic review [9] and a meta-analysis that proved that thoracoscopic surgeries in general had an earlier discharge time along with fewer mortalities than open thoracotomies. However, there is currently no data that can say the same when specifically speaking about pneumonectomies done either through VATS or open thoracotomies [10].
VATS is a relatively newer technique that boasts better outcomes as compared to open thoracotomies albeit with the requirement of a particular skill set, a steeper learning curve and higher setting-up costs. Our results show that mortality is higher in the patients who underwent open pneumonectomy. Also, this is associated with a higher admission charge. In addition, the discharge rate of VATS pneumonectomy is higher than open pneumonectomy and this is partly the reason behind the lower costs associated with the VATS procedure. With shorter stays, VATS pneumonectomy patients do not frequently require prolonged hospital stays. This is similar to the findings of Farhood Farjah et al. [15] who showed that VATS lobectomies had lower 90-day costs primarily due to a shorter stay. Our article confirmed the findings of Scott J Swanson et al. who published data showing a reduced mortality and morbidity in patients who underwent VATS lobectomy as compared to open lobectomy [11–16].
Pneumonectomy patients have a decreased mortality trend over the years. But the cost of treatment has tripled over the years and utilization of home health care has also increased. Thoracoscopic pneumonectomies have a decreased cost and are discharged to home more frequently as compared to open pneumonectomies. Open pneumonectomy is a risk factor for higher mortality.
The authors acknowledge all of the HCUP data partners that contribute to HCUP. List of these State organizations can be accessed at (www.hcup-us.ahrq.gov/hcupdatapartners.jsp).
- Kohn LT, Corrigan JM, Donaldson MS (1999) Shaping the Future for Health TO ERR IS HUMAN: BUILDING A SAFER HEALTH SYSTEM. Committee on Quality of Health Care in America, INSTITUTE OF MEDICINE.NATIONAL ACADEMY PRESS. Washington, D.C.
- The Agency for Healthcare Research and Quality's (AHRQ), The Healthcare Cost and Utilization Project (HCUP), State Inpatient Databases (SID) and National Inpatient Sample (NIS). Available from: http://www.ahrq.gov.
- The Centers for Medicare & Medicaid Services ICD 9 CM: International Classification of Diseases, Clinical Modification.
- Wang BY, Huang JY, Ko JL, Lin CH, Zhou YH, et al. (2016) A Population-Based Cost Analysis of Thoracoscopic Versus Open Lobectomy in Primary Lung Cancer. Ann Surg Oncol 23: 2094-2098. [Crossref]
- Long H, Tan Q, Luo Q, Wang Z, Jiang G, et al. (2018) Thoracoscopic Surgery Versus Thoracotomy for Lung Cancer: Short-Term Outcomes of a Randomized Trial. Ann Thorac Surg 105: 386-392. [Crossref]
- Rodgers-Fischl PM, Martin JT, Saha SP (2017) Video-Assisted Thoracoscopic versus Open Lobectomy: Costs and Outcomes. South Med J 110: 229-233. [Crossref]
- Van Schil P (2003) Cost analysis of video-assisted thoracic surgery versus thoracotomy: critical review. Eur Respir J 22: 735-738. [Crossref]
- Port JL, Mirza FM, Lee PC, Paul S, Stiles BM, et al. (2011) Lobectomy in octogenarians with non-small cell lung cancer: ramifications of increasing life expectancy and the benefits of minimally invasive surgery. Ann Thorac Surg 92: 1951-1957. [Crossref]
- Berry MF, D'Amico TA, Onaitis MW, Kelsey CR (2014) Thoracoscopic approach to lobectomy for lung cancer does not compromise oncologic efficacy. Ann Thorac Surg 98: 197-202. [Crossref]
- Whitson BA, Groth SS, Duval SJ, Swanson SJ, Maddaus MA (2008) Surgery for early-stage non-small cell lung cancer: a systematic review of the video-assisted thoracoscopic surgery versus thoracotomy approaches to lobectomy. Ann Thorac Surg 86: 2008–2018. [Crossref]
- Cao C, Manganas C, Ang SC, Peeceeyen S, Yan TD (2013) Video-assisted thoracic surgery versus open thoracotomy for non-small cell lung cancer: a meta-analysis of propensity score-matched patients. Interact Cardiovasc Thorac Surg 16: 244–249. [Crossref]
- Swanson SJ, Meyers BF, Gunnarsson CL, Moore M, Howington JA, Maddaus MA, et al. (2012) Video-assisted thoracoscopic lobectomy is less costly and morbid than open lobectomy: a retrospective multi-institutional database analysis. Ann Thorac Surg 93:1027–1032. [Crossref]
- Port JL, Mirza FM, Lee PC, Paul S, Stiles BM, et al. (2011) Lobectomy in octogenarians with non-small cell lung cancer: ramifications of increasing life expectancy and the benefits of minimally invasive surgery. Ann Thorac Surg 92:1951–1957. [Crossref]
- Mun M, Kohno T (2008) Video-assisted thoracic surgery for clinical stage I lung cancer in octogenarians. Ann Thorac Surg 85: 406–411. [Crossref]
- Farjah F, Backhus LM, Varghese TK, Mulligan MS, Cheng AM, et al. (2014) Ninety-day costs of video-assisted thoracic surgery versus open lobectomy for lung cancer. Ann Thorac Surg 98: 191–196. [Crossref]
- Burt BM, Kosinski AS, Shrager JB, Onaitis MW, Weigel T (2014) Thoracoscopic lobectomy is associated with acceptable morbidity and mortality in patients with predicted postoperative forced expiratory volume in 1 second or diffusing capacity for carbon monoxide less than 40% of normal. J Thorac Cardiovasc Surg 148: 19-28, dicussion 28-29. [Crossref]


