Background: Dynamic postural control is the key aspect for all day to day activities. Star excursion balance test is effective in measuring dynamic postural control. This study was aimed to evaluate the correlation between body mass index and dynamic balance.
Objective: To evaluate the correlation between body mass index and dynamic postural control among young healthy adults.
Methodology: Non-experimental, observational, convenient, sample size was 200 subjects. Subjects of 18 to 24 years (both men and women) were included in the study. The exclusion criteria were any recent lower limb fracture or soft tissue injury, any neurological disorders like ataxia, Parkinson and vertigo. Procedure: Subjects were selected based on the inclusion and exclusion criteria and the anthropometric characteristics of body mass index (height/weight) measures were noted and the subjects performed the technique of star excursion balance test and the reach distances of the test were documented.
Results: Out of 8 directions of star excursion balance test, there was a positive correlation between Body Mass Index and dynamic postural control in three directions and a negative correlation in five directions.
Conclusion: The study concluded that there is an influence of Body Mass Index over dynamic postural control on anterolateral, lateral and posterolateral directions and on anterior, posterior, posteromedial, anteromedial, and medial directions, Body Mass Index has no influence over dynamic balance control.
dynamic postural control, body mass index, star excursion balance test
A good postural balance emerges from a complex interaction of an individual’s sensorial detection of movement and position of body, the role of motor control for execution of organized motor synergies and last being the process of higher center involvement for integration and action plan. The body position in relation to the ground is determined by the sensory system made up of vestibular, visual and proprioceptive function. The controlled and coordinated muscular kinetic chain is the key aspect for the maintenance of dynamic balance [1]. Human locomotion is maintained by a stable posture and a good balanced body. Postural control of our body is so vital for all our activities of daily living. To make up the normal postural control system the involvement of the sensory, the musculoskeletal and the central nervous system plays a major role [2]. Postural control and balance can be categorized into two types as static and dynamic. In static postural control tasks, the individual should maintain a stable base of support while the body movements are minimized. Whereas, the dynamic postural control tasks involve a maintained base of support with some level of expected movement without compromising the established base of support [3,4]. One of the social and psychological issues among human being is their body fatness. The body fat not only influences an individual’s psychological issue, but it also influences one’s functional activities. The Body Mass Index (BMI), calculated as weight (in kilograms)/height (in meters, squared), is the commonly used metric to define the anthropometric height/weight characteristics which represents an index of an individual’s fatness and it is used for categorizing them into groups [3]. An expert consultation group was assembled in 1993 by world health organization to develop the uniform categories of the body mass index [3]. Body Mass Index was classified as four major categories such as underweight, normal, overweight and obese.
With the range of 15 to 19.9, one’s Body Mass Index is considered as underweight. With the range of 20 to 24.9, it is considered as normal weight, with the range of 25 to 29.9, it is considered as overweight and with the range more than 30, it is considered as obese [5].
Since the dynamic postural control tasks involves some level of expected movements without compromising the established base of support, the assessment technique of a person’s dynamic postural control is not as easy as assessing their static postural control. The star excursion balance test is one such task which can provide a reliable, sensible and one of the cost-effective methods to assess the dynamic movement [6]. In star excursion balance test, dynamic postural control is concluded by measuring multi planar excursion and postural control. With their maintained base of support, the participant’s possible reach distance will be measured [7]. In star excursion balance test, a single leg stance is maintained in the center of a star pattern on the floor by the individual [8].
The star excursion balance test can also be described as a rehabilitative tool as it consists of a series of lower limb movements occurring in all the planes using the non-stance limb while the other leg placed in center on the 1 of 8 designed lines on the ground [9]. The lines on the grid consist of 8 lines, extending from a common center point and the lines are at 45 degree from one another. Each direction on the grid challenges one’s dynamic control. The main goal of this test is that the performer maintains a stable base of support on their stance leg in the center of the testing grid and should maintain through the maximal reach distance in one of the respective directions [6]. Since this test composed of closed kinetic chain movements and ability to balance on one leg, this is used not only to assess the dynamic balance and with that it can also be used as a rehabilitative training as it improves the proprioception and balance control [10].
The star excursion balance test assesses not only the dynamic balance but also it is also used as an important functional screening tool to assess the lower extremity injuries. It is used to identify the risk for lower limb injuries. The performer’s neuromuscular characteristics such as lower extremity coordination, balance, flexibility and strength are required to perform this test. As a result of this test, it may be useful in the efficacy of rehabilitation programs designed in order to reduce the risk of injury [11].
Plisky et al. [12] conducted a study that the reach distance of the star excursion balance test is associated with the lower extremity injury risks among high school basketball players. Another study by C. Olmsted et al concluded that the star excursion balance test is an effective measure to determine the reaching deficits in subjects with unilateral chronic ankle instability [13]. Kejonen et al. [14] conducted a study and concluded that body anthropometric characteristics have slight effect on the variation of body balancing movements in a person standing on two legs with eyes open.
With all these above statements the objective of this study is to check whether the body anthropometric height/weight characteristics of an individual will have an impact over dynamic postural control using star excursion balance test, the one test which is reliable and cost effective to assess the dynamic balance control.
Aim of the study
To evaluate the correlation between body mass index and dynamic postural control of a young healthy adults on performance of star excursion balance test.
Need for the study
Proper dynamic balance control is a key aspect of locomotion of an individual and activities of daily living. A person’s body weight has a prediction over his postural stability. The star excursion balance test is one the best method of assessing dynamic balance as it challenges his ability to maintain an established stable base of support while performing simultaneously the reach movement. And this test is also found to be a predictive measure of lower extremity injury. Since there is no study correlating the body mass index and dynamic postural control on performance of star excursion balance test, there is a need for this study to evaluate the correlation between Body Mass Index and dynamic postural control.
Study design : Non-experimental design
Study type : Observational
Sampling method : Convenient sampling
Sample size : 200 subjects
Study setting : SRM College of Physiotherapy
Inclusion criteria
- Age between 18 to 24 years
- Both men and women
- Volunteer participants
Exclusion criteria
- Any neurological disorders like Ataxia, parkinson
- Recent lower limb fractures
- Recent soft tissue injuries of lower limb
- Vertigo
Materials used
- Stadiometer
- Pencil and eraser
- Inch tape
- Weighing machine
Procedure
The subjects for the study were selected randomly based on the inclusion and exclusion criteria and an informed consent was taken from the participants who were interested in participating the study voluntarily. The participant’s anthropometric height/weight characteristics were collected, and their body mass index was calculated by dividing the weight in kilograms by height in meters, squared. Prior to the commencement of the test, the procedure of star excursion balance test was clearly explained to the participants. This procedure was followed by all the subjects.
Technique of star excursion balance test
The procedure of star excursion balance test includes the assessment of dynamic balance and leg length. The testing grid of Star excursion balance test consists of 8 lines each of 120 cm in length extending from a common point at 45 degree and a 3-inch wide adhesive tape placed on firm floor. The 8 lines positioned on grid are labelled according to the direction of excursion relative to the stance leg: Anterolateral (AL), anterior (A), anteromedial (AM), medial (M), posteromedial (PM), posterior (P), posterolateral (PL) and Lateral. Limb length was measured to normalize excursion distance and was measured by measuring tape. The distance between anterior superior iliac spine to medial malleolus was used and is taken for both the lower limbs.
The subjects were instructed to maintain a stable single leg stance with the test leg while shoes off and to reach for maximal distance with the other leg in each of the 8 directions. Marks at regular intervals (1 cm) were set on the tape; a pencil was used to point and read the distance to which each subject’s foot reached. Subjects practiced each direction 3 times before the main test in order to minimize learning effect. This was followed by the recording of 3 successful trials in each direction for both legs, always with a 10 second rest between each test. Outcome value of the test were the mean normalized reach distance of the 3 trials. For normalization, the mean reach distance of the 3 trials was divided by limb length (cm) and multiplied by 100 for a percentage score.
After the collection of the outcome scores of dynamic postural controls on performance of Star excursion balance test, the scores were correlated with the Body mass index.
Data analysis
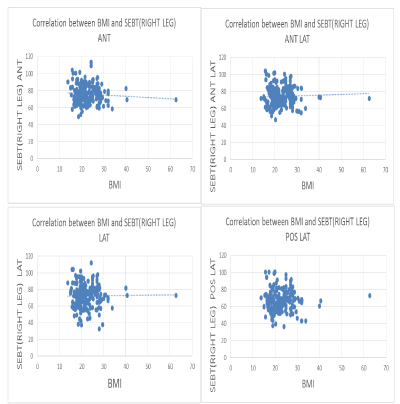
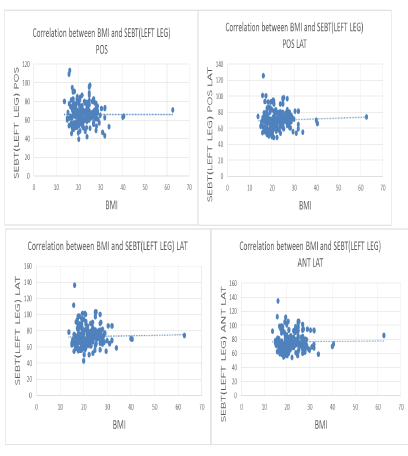
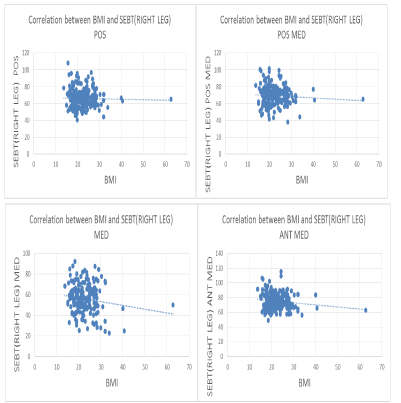
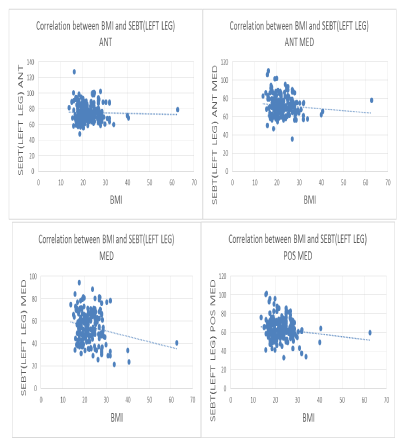
Table 1 gives the and from this, it has been shown that the Body Mass index is positively correlated with the anterolateral, lateral, posterolateral directions and negatively correlated with the anterior, posterior, posteromedial, medial and anteromedial directions of star excursion balance test.
Table 1 shows that Body Mass Index is positively correlated with the anterolateral, lateral and posterolateral directions and negatively correlated with the anterior, posterior, posteromedial, medial and anteromedial directions of star excursion balance test (Figures 1–4).

Figure 1. Correlation between body mass index and dynamic postural control performed on the right leg in the respective eight directions of star excursion balance test.

Figure 4. Correlation between body mass index and dynamic postural control performed on the left leg in the respective eight directions of star excursion balance test.
Table 1. Correlation values of body mass index and all eight directions (anterior, anterolateral, lateral, posterolateral, posterior, posteromedial, anteromedial, medial) of star excursion balance test performed on right leg in young healthy adults.
Body mass index |
Mean |
N |
SD |
Correlation value |
Sig. (2-tailed) |
Anterior direction> |
76.13 |
200 |
10.971 |
-0.072 |
0.311 |
Anterolateral direction |
74.39 |
200 |
11.211 |
0.039 |
0.586 |
Lateral direction |
72.26 |
200 |
14.384 |
0.013 |
0.855 |
Posterolateral direction |
66.68 |
200 |
12.128 |
0.026 |
0.717 |
Posterior direction |
65.95 |
200 |
11.333 |
-0.027 |
0.708 |
Posteromedial direction |
69.32 |
200 |
11.435 |
-0.066 |
0.350 |
Medial direction |
50.05 |
200 |
13.906 |
-0.140 |
0.048 |
Anteromedial direction |
75.22 |
200 |
11.105 |
-0.136 |
0.054 |
From table 2, it is shown that, on performance of the star excursion balance test performed on right leg,
There was a positive correlation between BMI and dynamic postural control on the anterolateral, lateral and posterolateral directions. There was a negative correlation between BMI and dynamic postural control on the anterior, posterior, posteromedial, medial and anteromedial directions. From Table 1, it is shown that, on performance of star excursion balance test performed on left leg,
There was a positive correlation between BMI and dynamic postural control on the anterolateral, lateral and posterolateral directions. There was a negative correlation between BMI and dynamic postural control on the anterior, posterior, posteromedial, medial and anteromedial directions.
Table 1. Correlation values of body mass index and all eight directions (anterior, anterolateral, lateral, posterolateral, posterior, posteromedial, anteromedial, medial) of star excursion balance test performed on right leg in young healthy adults.
Body mass index |
Mean |
N |
SD |
Correlation value |
Sig. (2-tailed) |
Anterior direction> |
76.13 |
200 |
10.971 |
-0.072 |
0.311 |
Anterolateral direction |
74.39 |
200 |
11.211 |
0.039 |
0.586 |
Lateral direction |
72.26 |
200 |
14.384 |
0.013 |
0.855 |
Posterolateral direction |
66.68 |
200 |
12.128 |
0.026 |
0.717 |
Posterior direction |
65.95 |
200 |
11.333 |
-0.027 |
0.708 |
Posteromedial direction |
69.32 |
200 |
11.435 |
-0.066 |
0.350 |
Medial direction |
50.05 |
200 |
13.906 |
-0.140 |
0.048 |
Anteromedial direction |
75.22 |
200 |
11.105 |
-0.136 |
0.054 |
Table 2. Correlation values of body mass index and all eight directions (anterior, anterolateral, lateral, posterolateral, posterior, posteromedial, anteromedial, medial) of sebt performed on left leg in young healthy adults.
Body mass index |
Mean |
N |
SD |
Correlation value |
Sig. (2-tailed) |
Anterior direction |
75.31 |
200 |
11.460 |
-0.032 |
0.650 |
Anterolateral direction |
76.78 |
200 |
12.693 |
0.010 |
0.894 |
Lateral direction |
72.71 |
200 |
12.550 |
0.024 |
0.738 |
Posterolateral direction |
69.81 |
200 |
11.714 |
0.048 |
0.502 |
Posterior direction |
66.04 |
200 |
11.690 |
-0.002 |
0.982 |
Posteromedial direction |
63.56 |
200 |
11.552 |
-0.135 |
0.056 |
Medial direction |
54.86 |
200 |
14.184 |
-0.185 |
0.009 |
Anteromedial direction |
72.09 |
200 |
11.163 |
-0.098 |
0.169 |
The aim of this study was to determine, if dynamic postural control, as measured by normalized star excursion balance test reach distances, correlated with the participant’s Body Mass Index. Studies have demonstrated that fat tissue accumulation in the body can reduce the balance stability and this factor is more concerned for falls among extremely obese subjects. Greve et al. [1] concluded that higher body mass index demands more displacement to maintain postural control. Olivier et al. [4], in their study, suggested that body weight predicts variation in balance stability. Although further studies are required to evaluate the correlation between body mass index and dynamic postural control in the healthy adult population. By considering in these aspects, the purpose of this study is to focus only on the dynamic postural control of an individual. The result proved that there is a significant correlation between body mass index and dynamic postural control on the anterolateral, lateral and posterolateral directions of star excursion balance test with correlation R value of 0.039, 0.013 and 0.026 respectively on performance of the right leg and with R value of 0.010, 0.024 and 0.048 respectively on performance of the left leg and it is also proved that there is no correlation between Body Mass Index and dynamic postural control on the anterior, posterior, posteromedial, medial and anteromedial directions of star excursion balance test with the correlation R value of -0.072, -0.027, -0.066, -0.140 and -0.136 respectively on performance of the right leg and with the R value of -0.032, -0.002, -0.135, -0.185 and -0.098 respectively on performance of the left leg. The results of this study go in hand with Greve et al. [1] concluded that postural balance measured using post urography was little influenced by anthropometric variable and in that height was the anthropometric variable that most influence postural balance. From these results, it can be concluded that, as body mass index increases the value of reach distances on anterolateral, lateral and posterolateral distances also increases. Thus, the Body Mass Index and dynamic postural control is positively correlated on these 3 directions of star excursion balance test but on the anterior, posterior, posteromedial, medial and anteromedial directions of star excursion balance test, the Body Mass Index has no significant influence over dynamic postural control. Thus, the Body Mass Index and dynamic postural control is negatively correlated on these 5 directions. Star excursion balance test, the one such testing tool to measure the dynamic balance control has the reach distances of all the possible eight directions of all the three planes. Out of eight directions of reach distances, it can be said that the subject’s ability in measuring the dynamic postural control on the anterolateral, lateral and posterolateral directions it has some influence with their body mass index. While on the other five directions of reach distances in measuring a dynamic postural control, it has no significant influence over subject’s body mass index.
The study concludes that, on performance of star excursion balance test, Body Mass Index is positively correlated with the dynamic postural control on the anterolateral, lateral and posterolateral directions of reach distances and the Body Mass Index and dynamic postural control are negatively correlated on the anterior, posterior, posteromedial, medial and anteromedial directions of reach distances.
Limitations
- Small sample size
- Only the age between 18 and 24 years are included in the study
Recommendations
- Elderly populations can be studied
- Can be studied in balance disordered population
- Gender difference in balance can be done
- Balance and nature of work can be compared
- Balance among postmenopausal women can be done
- Can be studied in school aged children
- Greve J, Alonso A, Bordini AC, Camanho GL (2007) Correlation between body mass index and postural balance. Clinics (Sao Paulo) 62: 717-720. [Crossref]
- Winter DA, Patla AE, Frank JS (1990) Assessment of balance control in humans. Med Prog Technol 16: 31-51.
- Hue O, Simoneau M, Marcotte J, Berrigan F, Doré J, Marceau P, et al. (2007) Body weight is a strong predictor of postural stability. Gait Posture 26: 32-38. [Crossref]
- Nuttal FQ (2015) Body mass index. Obesity, BMI and health: a critical review. Nutr Today 50: 117-128. [Crossref]
- WHO Physical Status (1985) The Use and index (W/H2) as a measure of fatness. Int J Obes 1985; 9: 147-153.
- Gribble PA, Hertel J, Plisky P (2012) Using the star excursion balance test to assess dynamic postural-control deficits and outcomes in lower extremity injury: a literature and systematic review. J Athl Train 47: 339-357. [Crossref]
- Appiah-Dwomoh EK, Müller S, Hadzic M, Mayer F (2016) Star Excursion Balance Test in Young Athletes with Back Pain. Sports (Basel): 4. [Crossref]
- McCann RS, Kosik KB, Beard MQ, Terada M, Pietrosimone BG, et al. (2015) Variations of star excursion balance test performance between high school and collegiate football players. J Strength Cond Res 29: 2765-2770. [Crossref]
- Gray GW (1995) Lower extremity functional profile. Adrian, MI: Wynn Marketing, Inc. Australia.
- Webster KA, Gribble PA (2010) Functional Rehabilitation Interventions for Chronic Ankle Instability: A Systematic Review. J Sport Rehabil 19: 98-114. [Crossref]
- Bhaskar BK, Vinod B, Sai K, Vikas KV (2013) Effectiveness of neuromuscular training for basketball players on performance of star excursion balance test. Int J physiotherapy Res 1: 251-260.
- Plisky PJ, Rauh MJ, Kaminski TW, Underwood FB (2006) Star Excursion Balance Test as a predictor of lower extremity injury in high school basketball players. J Ortho Sports Phys Ther 36: 911-919. [Crossref]
- Olmsted LC, Carcia CR, Hertel J, Shultz SJ (2002) Efficacy of the star excursion balance tests in detecting reach deficits in subjects with chronic ankle instability. J Athl Train 37: 501-506. [Crossref]
- Kejonen P, Kauranen K, Vanharanta H (2003) The relationship between anthropometric factors and body-balancing movements in postural balance. Arch Phys Med Rehabil 84: 17-22. [Crossref]


