A biomarker is a feature that is objectively evaluated and measured for the study of pathologic process, normal biologic process and pharmacologic response to treatment. Many prognostic and predictive biomarkers have been investigated in the past for decades [1,2]. With progression of new gene expression profiling technique, it has been evaluated that in comparison to traditional markers, molecular markers have important role. The incidence of breast cancer is rising globally in women and the trend is rising in India too, figuring 27% among all cancers with annual mortality of 21.5% of all cancer related deaths [3,4].
Many investigative efforts have focused on a better understanding of IBC's (Invasive Breast Carcinoma) oncogenic pathways and the search for new breast cancer biomarkers, of prognostic and therapeutic predictive value [5,6].
The consecutive 57 samples over a period of 18 months have been included for the study in a tertiary care set up of a centralized institute. The written informed consent has been obtained from the patients or their legal guardians. The study has been approved by institutional review board. The patients who were diagnosed as breast carcinoma clinically have submitted either mastectomy/lumpectomy specimen to the department have been included in the study and after screening confirmed Intraductal carcinoma cases are being analysed. The cases with presence of fixation artefact, other types of benign/malignant breast tumor besides invasive duct carcinoma, patients who have received any kind of chemotherapy/radiotherapy/contemporary treatment and the cases where the written informed consent could not be obtained are excluded from the study.
The primary outcome measure was to evaluate the correlation between Cyclin D1 status of IDC (Intraductal carcinoma) with different biomarkers of carcinoma of breast. As secondary outcome measures, the correlation with other variables e.g., Age, Tumour Grade, Tumour size, Nodal status, Laterality, Location with Molecular classification has been analysed. For statistical analysis data were entered and analysed by SPSS (Statistical Package for the Social Sciences) software (version 25.0; SPSS Inc., Chicago, IL, USA) [7].
In Grade-1 Group, (n=3, 50.0%) patients were in 41-50 years, in Grade-2 Group, (n=6, 42.9%) patients were 41-50 years, in Grade-3 Group, (n=2, 50.0%) patients were 61-70 years, in Grade-4 Group, (n=11, 44.0%) patients were in 41-50 years and in Grade-5 Group, (n=4, 50.0%) patients were distributed 41-50 years age group. The association of Age in Years vs group was not statistically significant (p=0.0710) (Table 1, Figure 1)
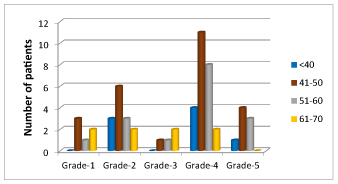
Figure 1. χ2 (Chi-square value): 10.4321; p-value: 0.5781
Table 1. Association between age in years: Cyclin D1 status
CYCLIN D1 STATUS |
Age in Years |
Grade-1 |
Grade-2 |
Grade-3 |
Grade-4 |
Grade-5 |
TOTAL |
<40
n
% |
0
0.0 |
3
21.4 |
0
0.0 |
4
16.0 |
1
12.5 |
8
14.0 |
41-50
n
% |
3
50.0 |
6
42.9 |
1
25.0 |
11
44.0 |
4
50.0 |
25
43.9 |
51-60
n
% |
1
16.7 |
3
21.4 |
1
25.0 |
8
32.0 |
3
37.5 |
16
28.1 |
61-70
n
% |
2
33.3 |
2
14.3 |
2
50.0 |
2
8.0 |
0
0.0 |
8
14.0 |
TOTAL
n
% |
6
10.5
100.0 |
14
24.6
100.0 |
4
7.0
100.0 |
25
43.9
100.0 |
8
14.0
100.0 |
57
100.0
100.0 |
In Grade-1 Group, (n=4, 66.7%) patients had 1 ER scoring, in Grade-2 Group, (n= 5,35.7%) patients had been found with 1 and 2 ER scoring, in Grade-3 Group, (n=1, 25.0%) patients had 1 ER, 2 Er, 3 ER and 4 ER scoring. In Grade-4 Group, (n=12, 48.0%) patients had 3 ER scoring, in Grade-5 Group, (n=4, 50.0%) patients had 2 ER scoring. The association of ER scoring vs group was not statistically significant (p=0.2227) (Table 2, Figure 2).
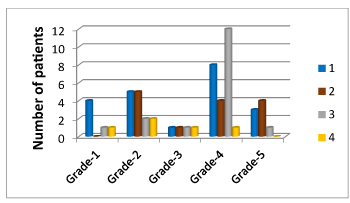
Figure 2. χ2 (Chi-square value): 15.3528; p-value: 0.2227
Table 2. Association between ER scoring: Cyclin D1 status
CYCLIN D1 STATUS |
ER scoring |
Grade-1 |
Grade-2 |
Grade-3 |
Grade-4 |
Grade-5 |
TOTAL |
1
n
% |
4
66.7 |
5
35.7 |
1
25.0 |
8
32.0 |
3
37.5 |
21
36.8 |
2
n
% |
0
0.0 |
5
35.7 |
1
25.0 |
4
16.0 |
4
50.0 |
14
24.6 |
3
n
% |
1
16.7 |
2
14.3 |
1
25.0 |
12
48.0 |
1
12.5 |
17
29.8 |
4
n
% |
1
16.7 |
2
14.3
|
1
25.0 |
1
4.0 |
0
0.0 |
5
8.8 |
TOTAL
n
% |
6
100.0 |
14
100.0 |
4
100.0 |
25
100.0 |
8
100.0 |
57
100.0 |
In Grade-1 Group, (n=4, 66.7%) patients had 2 ER Pos & Neg status, in Grade-2 Group, (n=10, 71.4%) patients had 1 ER Pos and Neg status, in Grade-3 Group, (n=3, 75.0%) patients had 1 ER Pos & Neg status and in Grade-4 Group, (n=17, 68.0%) patients had 1 ER Pos and Neg status and in Grade-5 Group, (n=5,62.5%) patients had 1 ER Pos & Neg status. The association of ER pos and Neg vs group was not statistically significant (p=0.5263). (Table 3, Figure 3).
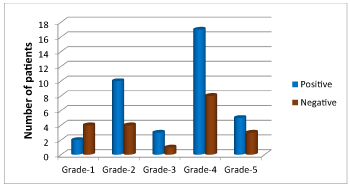
Figure 3. χ2 (Chi-square value): 3.1918; p-value: 0.5263
Table 3. Association between ER Pos & Neg: Cyclin D1 status
CYCLIN D1 STATUS |
ER pos & Neg |
Grade-1 |
Grade-2 |
Grade-3 |
Grade-4 |
Grade-5 |
TOTAL |
1
n
% |
2
33.3 |
10
71.4 |
3
75.0 |
17
68.0 |
5
62.5 |
37
64.9 |
2
n
% |
4
66.7 |
4
28.6 |
1
25.0 |
8
32.0 |
3
37.5 |
20
35.1 |
TOTAL
n
% |
6
100.0 |
14
100.0 |
4
100.0 |
25
100.0 |
8
100.0 |
57
100.0 |
In Grade-1 Group, (n=3, 50.0%) patients had 1 PR scoring, in Grade-2 Group, (n=7, 50.0%) patients had 3 PR scoring, in Grade-3 Group, (n=2, 50.0%) patients had 3 PR scoring and in Grade-4 Group, (n=7, 28.0%) patients had 5 PR scoring and in Grade-5 Group, (n=3, 37.5%) patients had 4 PR scoring. The association of PR scoring vs group was not statistically significant (p=0.3963) (Table 4, Figure 4).
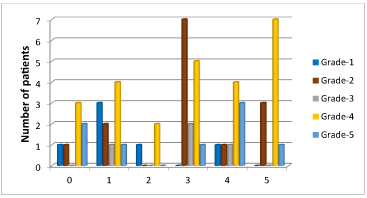
Figure 4. χ2 (Chi-square value): 21.0140; p-value: 0.3963
Table 4. Association between PR scoring: Cyclin D1 status
CYCLIN D1 STATUS |
PR scoring |
Grade-1 |
Grade-2 |
Grade-3 |
Grade-4 |
Grade-5 |
TOTAL |
0
n
% |
1
16.7 |
1
7.1 |
0
0.0 |
3
12.0 |
2
25.0 |
7
12.3 |
1
n
% |
3
50.0 |
2
14.3 |
1
25.0 |
4
16.0 |
1
12.5 |
11
19.3 |
2
n
% |
1
16.7 |
0
0.0 |
0
0.0 |
2
8.0 |
0
0.0 |
3
5.3 |
3
n
% |
0
0.0 |
7
50.0 |
2
50.0 |
5
20.0 |
1
12.5 |
15
26.3 |
4
n
% |
1
16.7 |
1
7.1 |
1
25.0 |
4
16.0 |
3
37.5 |
10
17.5 |
5
n
% |
0
0.0 |
3
21.4 |
0
0.0 |
7
28.0 |
1
12.5 |
11
19.3 |
TOTAL
n
% |
6
100.0 |
14
100.0 |
4
100.0 |
25
100.0 |
8
100.0 |
57
100.0 |
In Grade-1 Group, (n=3, 50.0%) patients had 3Her2-Neu scoring, in Grade-2 Group, (n= 6, 42.9%) patients had 0 Her2-Neu scoring, in Grade-3 Group, (n= 2, 50.0%) patients had 2 Her2-Neu scoring, in Grade-4 Group, (n=16, 64.0%) patients had 3Her2-Neu scoring and in Grade-5 Group, (n= 4,50.0%) patients had 1 Her2-Neu scoring. The association of Her2-Neu scoring vs group was statistically significant (p=0.0359) (Table 5, Figure 5).
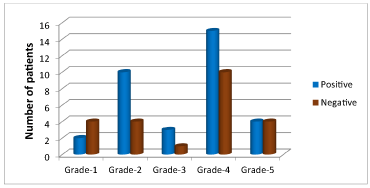
Figure 5. χ2 (Chi-square value): 3.2358; p-value: 0.5192
Table 5. Association between PR pos & Neg: Cyclin D1 status
CYCLIN D1 STATUS |
PR pos and Neg |
Grade-1 |
Grade-2 |
Grade-3 |
Grade-4 |
Grade-5 |
TOTAL |
1
n
% |
2
33.3 |
10
71.4 |
3
75.0 |
15
60.0 |
4
50.0 |
34
59.6 |
2
n
% |
4
66.7 |
4
28.6 |
1
25.0 |
10
40.0 |
4
50.0 |
23
40.4 |
TOTAL
n
% |
6
100.0 |
14
100.0 |
4
100.0 |
25
100.0 |
8
100.0 |
57
100.0 |
In Grade-1 Group, (n=4, 66.7%) patients had 2 PR Pos & Neg, in Grade-2 Group, (n=10, 71.4%) patients had 1 PR Pos & Neg, in Grade-3 Group, (n= 3, 75.0%) patients had 1 PR Pos & Neg, in Grade-4 Group, (n= 15, 60.0%) patients had 1 PR Pos & Neg and in Grade-5 Group, (n=4,50.0%) patients had both 1 PR Pos and Neg and 2 PR Pos and Neg status. The association of PR pos and Neg vs group was not statistically significant (p=0.5192). (Table 6, Figure 6).
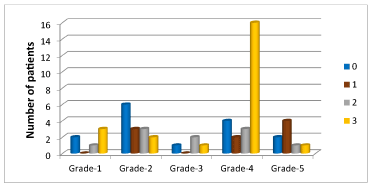
Figure 6. χ2 (Chi-square value): 22.1492; p-value: 0.0359
Table 6. Association between Her2-Neu scoring: Cyclin D1 status
CYCLIN D1 STATUS |
Her2-Neu scoring |
Grade-1 |
Grade-2 |
Grade-3 |
Grade-4 |
Grade-5 |
TOTAL |
0
n
% |
2
33.3 |
6
42.9 |
1
25.0 |
4
16.0 |
2
25.0 |
15
26.3 |
1
n
% |
0
0.0 |
3
21.4 |
0
0.0 |
2
8.0 |
4
50.0 |
9
15.8 |
2
n
% |
1
16.7 |
3
21.4 |
2
50.0 |
3
12.0 |
1
12.5 |
10
17.5 |
3
n
% |
3
50.0 |
2
14.3 |
1
25.0 |
16
64.0 |
1
12.5 |
23
40.4 |
TOTAL
n
% |
6
100.0 |
14
100.0 |
4
100.0 |
25
100.0 |
8
100.0 |
57
100.0 |
In Grade-1 Group, (n=3, 50.0%) patients had 1 Her2 Status, in Grade-2 Group, (n=9, 64.3%) patients had 2 Her2 Status, in Grade-3 Group, (n=2, 50.0%) patients had 2 Her2 Status, in Grade-4 Group, (n=15, 60.0%) patients had 1 Her2 Status and in Grade-5 Group, (n=5, 62.5%) patients had 2 Her2 Status. The association of Her2 Status vs group was not statistically significant (p=0.2672). (Table 7, Figure 7).
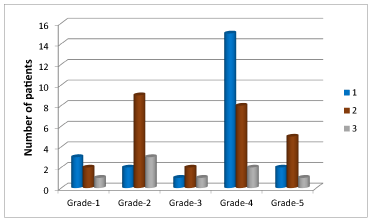
Figure 7. χ2 (Chi-square value): 9.9694; p-value: 0.2672
Table 7. Association between Her2 Status: Cyclin D1 status
CYCLIN D1 STATUS |
Her2 Status |
Grade-1 |
Grade-2 |
Grade-3 |
Grade-4 |
Grade-5 |
TOTAL |
1
n
% |
3
50.0 |
2
14.3 |
1
25.0 |
15
60.0 |
2
25.0 |
23
40.4 |
2
n
% |
2
33.3 |
9
64.3 |
2
50.0 |
8
32.0 |
5
62.5 |
26
45.6 |
3
n
% |
1
16.7 |
3
21.4 |
1
25.0 |
2
8.0 |
1
12.5 |
8
14.0 |
TOTAL
n
% |
6
100.0 |
14
100.0 |
4
100.0 |
25
100.0 |
8
100.0 |
57
100.0 |
In Grade-1 Group, (n=5, 83.3%) patients had High Ki-67 Status, in Grade-2 Group, (n=9, 64.3%) patients had Low Ki-67 Status, in Grade-3 Group, (n=3, 75.0%) patients had High Ki-67 Status, in Grade-4 Group, (n=22, 88.0%) patients had High Ki-67 Status and in Grade-5 Group, (n=8, 100.0%) patients had High Ki-67 Status. The association of Ki-67 Status vs group was statistically significant (p=0.0021) (Table 8, Figure 8).
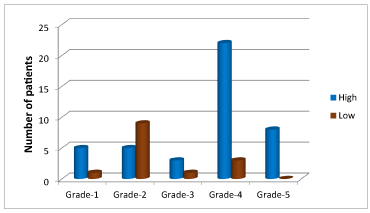
Figure 8. χ2 (Chi-square value): 16.8591; p-value: 0.0021
Table 8. Association between Ki-67 Status: Cyclin D1 status
CYCLIN D1 STATUS |
Ki-67 Status |
Grade-1 |
Grade-2 |
Grade-3 |
Grade-4 |
Grade-5 |
TOTAL |
High
n
% |
5
83.3 |
5
35.7 |
3
75.0 |
22
88.0 |
8
100.0 |
43
75.4 |
Low
n
% |
1
16.7 |
9
64.3 |
1
25.0 |
3
12.0 |
0
0.0 |
14
24.6 |
TOTAL
n
% |
6
100.0 |
14
100.0 |
4
100.0 |
25
100.0 |
8
100.0 |
57
100.0 |
In Grade-1 Group, both (n=3, 50.0%) patients had 2 TUMOR GRADE and 3 TUMOR GRADE, in Grade-2 Group, (n=10, 71.4%) patients had 2 TUMOR GRADE, in Grade-3 Group, (n=3, 75.0%) patients had 2 TUMOR GRADE, in Grade-4 Group, (n=15, 60.0%) patients and in Grade-5 Group, both (n=4, 50.0%) patients had 2 TUMOR GRADE and 3 TUMOR GRADE. The association of TUMOR GRADE vs group was not statistically significant (p=0.3514) (Table 9, Figure 9).
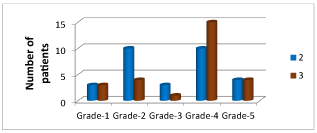
Figure 9. χ2 (Chi-square value): 4.4258; p-value: 0.3514
Table 9. Association between tumor grade: Cyclin D1 Status
CYCLIN D1 STATUS |
TUMOR GRADE |
Grade-1 |
Grade-2 |
Grade-3 |
Grade-4 |
Grade-5 |
TOTAL |
2
Row %
Col % |
3
50.0 |
10
71.4 |
3
75.0 |
10
40.0 |
4
50.0 |
30
52.6 |
3
Row %
Col % |
3
50.0 |
4
28.6 |
1
25.0 |
15
60.0 |
4
50.0 |
27
47.4 |
TOTAL
Row %
Col % |
6
100.0 |
14
100.0 |
4
100.0 |
25
100.0 |
8
100.0 |
57
100.0 |
In Grade-1 Group, (n=4, 66.7%) patients had STAGE-2, in Grade-2 Group, (n=7, 50.0%) patients had STAGE-2, in Grade-3 Group, (n=2, 50.0%) patients had STAGE-2, in Grade-4 Group, (n=16, 64.0%) patients had STAGE-2 and in Grade-5 Group, (n=4, 50.0%) patients had STAGE-2. The association of STAGE-T vs group was not statistically significant (p=0.3587) (Table 10, Figure 10).
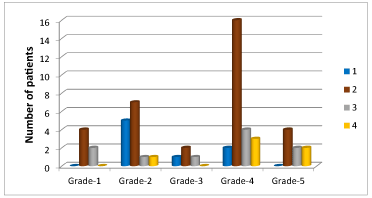
Figure 10. χ2 (Chi-square value): 13.1438; p-value: 0.3587
Table 10. Association between STAGE-T: Cyclin D1 status
CYCLIN D1 STATUS |
STAGE-T |
Grade-1 |
Grade-2 |
Grade-3 |
Grade-4 |
Grade-5 |
TOTAL |
1
n
% |
0
0.0 |
5
35.7 |
1
25.0 |
2
8.0 |
0
0.0 |
8
14.0 |
2
n
% |
4
66.7 |
7
50.0 |
2
50.0 |
16
64.0 |
4
50.0 |
33
57.9 |
3
n
% |
2
33.3 |
1
7.1 |
1
25.0 |
4
16.0 |
2
25.0 |
10
17.5 |
4
n
% |
0
0.0 |
1
7.1 |
0
0.0 |
3
12.0 |
2
25.0 |
6
10.5 |
TOTAL
n
% |
6
100.0 |
14
100.0 |
4
100.0 |
25
100.0 |
8
100.0 |
57
100.0 |
In Grade-1 Group, (n=5, 83.3%) patients had N 1, in Grade-2 Group, (n=5, 35.7%) patients had N0 and N1, in Grade-3 Group, (n=2, 50.0%) patients had N3, in Grade-4 Group, (n=9, 36.0%) patients had N2, and in Grade-5 Group, (n=4, 50.0%) patients had N2 lymph node status. The association of STAGE-N (lymph node status) vs group was not statistically significant, χ2 (Chi-square value): 17.9009; (p=0.1187). (Table 11, Figure 11).
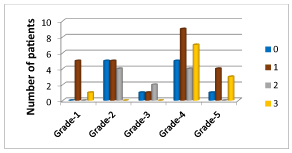
Figure 11. χ2 (Chi-square value): 17.9009; p-value: 0.1187
Table 11. Association between STAGE-N: Cyclin D1 status
CYCLIN D1 STATUS |
STAGE-N |
Grade-1 |
Grade-2 |
Grade-3 |
Grade-4 |
Grade-5 |
TOTAL |
0
n
% |
0
0.0 |
5
35.7 |
1
25.0 |
5
20.0 |
1
12.5 |
12
21.1 |
1
n
% |
5
83.3 |
5
35.7 |
1
25.0 |
9
36.0 |
4
50.0 |
24
42.1 |
2
n
% |
0
0.0 |
4
28.6 |
2
50.0 |
4
16.0 |
0
0.0 |
1
17.5 |
3
n
% |
1
16.7 |
0
0.0 |
0
0.0 |
7
28.0 |
3
37.5 |
1
19.3 |
TOTAL
n
% |
6
100.0 |
14
100.0 |
4
100.0 |
25
100.0 |
8
100.0 |
57
100.0 |
In Grade-1 Group, (n=5, 83.3%) patients had LL Laterality, in Grade-2 Group, (n=11, 78.6%) patients had LL Laterality, in Grade-3 Group, (n=4, 100.0%) patients had LL Laterality, in Grade-4 Group, (n=19, 76.0%) patients had LL Laterality and In Grade-5 Group, (n=6, 75.0%) patients had LL Laterality. It is evident that in all the grades LL (Left Lateral) laterality is predominant. The association of Laterality vs group was not statistically significant (p=0.8540) (Table 12, Figure 12).
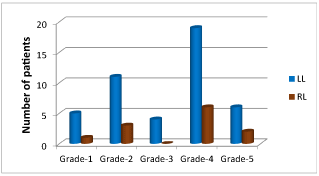
Figure 12. χ2 (Chi-square value): 1.3430; p-value: 0.8540
Table 12. Association between laterality: Cyclin D1 status
CYCLIN D1 STATUS |
Laterality |
Grade-1 |
Grade-2 |
Grade-3 |
Grade-4 |
Grade-5 |
TOTAL |
LL
n
% |
5
83.3 |
11
78.6 |
4
100.0 |
19
76.0 |
6
75.0 |
45
78.9 |
RL
n
% |
1
16.7 |
3
21.4 |
0
0.0 |
6
24.0 |
2
25.0 |
12
21.1 |
TOTAL
n
% |
6
100.0 |
14
100.0 |
4
100.0 |
25
100.0 |
8
100.0 |
57
100.0 |
In Grade-1 Group, (n=4, 66.7%) patients had UO (upper outer), in Grade-2 Group, (n=6,42.9%) patients had UI (upper inner), in Grade-3 Group, (n=2, 50.0%) patients had both UI and UO location, in Grade-4 Group, (n=12, 48.0%) patients had UI and in Grade-5 Group, (n=3, 37.5%) patients had UO location of the tumour. The association of LOCATION vs group was not statistically significant (p=0.7928) (Table 13, Figure 13).
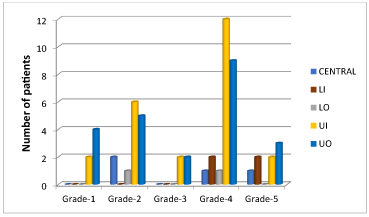
Figure 13. χ2 (Chi-square value): 11.2664; p-value: 0.7928
Table 13. Association between location: Cyclin D1 status
CYCLIN D1 STATUS |
LOCATION |
Grade-1 |
Grade-2 |
Grade-3 |
Grade-4 |
Grade-5 |
TOTAL |
CENTRAL
n
% |
0
0.0 |
2
14.3 |
0
0.0 |
1
4.0 |
1
12.5 |
4
7.0 |
LI
n
% |
0
0.0 |
0
0.0 |
0
0.0 |
2
8.0 |
2
25.0 |
4
7.0 |
LO
n
% |
0
0.0 |
1
7.1 |
0
0.0 |
1
4.0 |
0
0.0 |
2
3.5 |
UI
n
% |
2
33.3 |
6
42.9 |
2
50.0 |
12
48.0 |
2
25.0 |
24
42.1 |
UO
n
% |
4
66.7 |
5
35.7 |
2
50.0 |
9
36.0 |
3
37.5 |
23
40.4 |
TOTAL
n
% |
6
100.0 |
14
100.0 |
4
100.0 |
25
100.0 |
8
100.0 |
57
100.0 |
In Grade-1 Group, (n=2, 33.3%) patients had each HER2, LB and TN molecular classification. In Grade-2 Group, (n=8, 57.1%) patients had LA, in Grade-3 Group, (n=2, 50.0%) patients had LB, in Grade-4 Group, (n=15, 60.0%) patients had LB and in Grade-5 Group, (n=4, 50.0%) patients had LB molecular classification. The association of Molecular Classification vs group was statistically significant (p=0.0165) (Table 14, Figure 14).
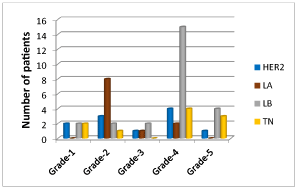
Figure 14. χ2 (Chi-square value): 24.6572; p-value: 0.0165
Table 14. Association between molecular classification: Cyclin D1 status
CYCLIN D1 STATUS |
MOLECULAR CLASSIFICATION |
Grade-1 |
Grade-2 |
Grade-3 |
Grade-4 |
Grade-5 |
TOTAL |
HER2
n
% |
2
33.3 |
3
21.4 |
1
25.0 |
4
16.0 |
1
12.5 |
11
19.3 |
LA
n
% |
0
0.0 |
8
57.1 |
1
25.0 |
2
8.0 |
0
0.0 |
11
19.3 |
LB
n
% |
2
33.3 |
2
14.3 |
2
50.0 |
15
60.0 |
4
50.0 |
25
43.9 |
TN
n
% |
2
33.3 |
1
7.1 |
0
0.0 |
4
16.0 |
3
37.5 |
10
17.5 |
TOTAL
n
% |
6
100.0 |
14
100.0 |
4
100.0 |
25
100.0 |
8
100.0 |
57
100.0 |
The oncogene encoding Cyclin D1 overexpression has been reported upto 50% of human breast cancers but its prognostic impact is still controversial. The inverse relationship between cyclin D1 overexpression and tumour grade and positive relationship between ER and PR scoring in IDC suggest that cyclin D1 may directly or indirectly responsible for maturation and differentiation for tumour cells [8,9].
Cyclin D1 regulates, cell cycle progression along G1 phase and oncogene CCND1 encoding cyclin D1 is amplified in parathyroid, colon, prostrate, breast carcinoma as well as in lymphoma and melanoma [10].
The clinical implications of Cyclin D1 protein can vary in different breast carcinoma subtype e.g., Luminal B subgroup is strongly ER positive with high level of Cyclin D1 protein whereas basal subgroup is ER negative and has low cyclin D1 expression. Most of the breast carcinoma cohorts (almost 70%) are luminal tumours. The relevance of Cyclin D1 in basal tumour is lost [11,12].
Cyclin D1 has been found to be correlated positively and negatively with Ki67 expression. Exploratory analysis is required to predict the clinical outcome if both these markers are elevated in breast tumours. In some studies the expression of Cyclin D1 is Her2 positive/negative and T1, T2 tumour size has been found to be significantly correlated [13,14].
The cell activity of proliferative biomarkers play an important role in development of neoplasia and metastasis and therefore clinically implicated with survival and prognosis of breast cancers [15,16].
The present study has some drawbacks. The other varieties of invasive breast carcinoma like lobular carcinoma, metaplastic, medullary carcinoma have not been studied. A follow up longitudinal study with higher sample size and more biomarkers will be helpful to extrapolate the findings of present study. Despite the above limitations, the present study is expected to generate the significant outcome which will be helpful for future research and will add scientific values with current understandings.
- Yang XR, Sherman ME, Rimm DL, Lissowska J, Brinton LA, et al. (2007) Differences in risk factors for breast cancer molecular subtypes in a population-based study. Cancer Epidemiol Biomarkers Prev 16: 439-443. [Crossref]
- Eeckhoute J, Carroll JS, Geistlinger TR, Torres-Arzayus MI, Brown M (2006) A cell-type-specific transcriptional network required for estrogen regulation of cyclin D1 and cell cycle progression in breast cancer. Genes Dev 20: 2513-2526. [Crossref]
- Gillett C, Fantl V, Smith R, Fisher C, Bartek J, et al. (1994) Amplification and overexpression of cyclin D1 in breast cancer detected by immunohistochemical staining. Cancer Res 54: 1812-1817. [Crossref]
- Zheng J, Benbrook DM, Yu H, Ding WQ (2011) Clioquinol suppresses cyclin D1 gene expression through transcriptional and post-transcriptional mechanisms. Anticancer Res 31: 2739-2747. [Crossref]
- Tobin NP, Bergh J (2012) Analysis of cyclin D1 in breast cancer: A Call to Arms. Curr Breast Cancer Rep 4: 171-173. [Crossref]
- Jiang Q, Zhang H, Zhang P (2011) ShRNA-mediated gene silencing of MTA1 influenced on protein expression of ER alpha, MMP-9, CyclinD1 and invasiveness, proliferation in breast cancer cell lines MDA-MB-231 and MCF-7 in vitro. J Exp Clin Cancer Res 30: 60. [Crossref]
- SPSS (version 25.0); SPSS Inc., Chicago, IL, USA.
- Yoshida T, Zhang Y, Rivera Rosado LA, Chen J, Khan T, et al. (2010) Blockade of Rac1 activity induces G1 cell cycle arrest or apoptosis in breast cancer cells through downregulation of cyclin D1, survivin, and X-linked inhibitor of apoptosis protein. Mol Cancer Ther 9: 1657-1668. [Crossref]
- Arnold A, Papanikolaou A (2005) Cyclin D1 in breast cancer pathogenesis. J Clin Oncol 23: 4215-4224. [Crossref]
- Mohammadizadeh F, Hani M, Ranaee M, Bagheri M (2013) Role of cyclin D1 in breast carcinoma. J Res Med Sci 18: 1021-1025. [Crossref]
- Reis-Filho JS, Savage K, Lambros MB, James M, Steele D, et al. (2006) Cyclin D1 protein overexpression and CCND1 amplification in breast carcinomas: An immunohistochemical and chromogenic in situ hybridisation analysis. Mod Pathol 19: 999-1009. [Crossref]
- Sutherland RL, Musgrove EA (2002) Cyclin D1 and mammary carcinoma: New insights from transgenic mouse models. Breast Cancer Res 4: 14-17. [Crossref]
- Naidu R, Wahab NA, Yadav MM, Kutty MK (2002) Expression and amplification of cyclin D1 in primary breast carcinomas: Relationship with histopathological types and clinico-pathological parameters. Oncol Rep 9: 409-416. [Crossref]
- Zhang SY, Caamano J, Cooper F, Guo X, Klein-Szanto AJ (1994) Immunohistochemistry of cyclin D1 in human breast cancer. Am J Clin Pathol 102: 695-698. [Crossref]
- Mansouri S, Esmaeili R, Kaviani A, Rezaei M, Abdoli N, et al. (2018) The interaction between the expression of proliferative biomarkers and clinical characteristics in breast cancer. Multidiscip Cancer Invest 2: 1-9.
- Colozza M, Azambuja E, Cardoso F, Sotiriou C, Larsimont D, et al. (2005) Proliferative markers as prognostic and predictive tools in early breast cancer: Where are we now? Ann Oncol 16: 1723-1739. [Crossref]
Editorial Information
Editor-in-Chief
Rawhi Omar
University of Louisville School of Medicine, USA
Article Type
Original Research Article
Publication history
Received date: April 26, 2021
Accepted date: May 12, 2021
Published date: May 18, 2021
Copyright
©2021 Panda SB. This is an open-access article distributed under the terms of the Creative Commons Attribution License, which permits unrestricted use, distribution, and reproduction in any medium, provided the original author and source are credited.
Citation
Panda SB, Chakrabarti S, Chakraborty J, Bhattacharyya R (2021) Cyclin D1 as emerging biomarker and its correlation with other biomarkers in intraductal carcinoma of breast. Clin Diagn Pathol, 4: DOI: 10.15761/CDP.1000139

Figure 1. χ2 (Chi-square value): 10.4321; p-value: 0.5781

Figure 2. χ2 (Chi-square value): 15.3528; p-value: 0.2227

Figure 3. χ2 (Chi-square value): 3.1918; p-value: 0.5263

Figure 4. χ2 (Chi-square value): 21.0140; p-value: 0.3963

Figure 5. χ2 (Chi-square value): 3.2358; p-value: 0.5192

Figure 6. χ2 (Chi-square value): 22.1492; p-value: 0.0359

Figure 7. χ2 (Chi-square value): 9.9694; p-value: 0.2672

Figure 8. χ2 (Chi-square value): 16.8591; p-value: 0.0021

Figure 9. χ2 (Chi-square value): 4.4258; p-value: 0.3514

Figure 10. χ2 (Chi-square value): 13.1438; p-value: 0.3587

Figure 11. χ2 (Chi-square value): 17.9009; p-value: 0.1187

Figure 12. χ2 (Chi-square value): 1.3430; p-value: 0.8540

Figure 13. χ2 (Chi-square value): 11.2664; p-value: 0.7928

Figure 14. χ2 (Chi-square value): 24.6572; p-value: 0.0165
Table 1. Association between age in years: Cyclin D1 status
CYCLIN D1 STATUS |
Age in Years |
Grade-1 |
Grade-2 |
Grade-3 |
Grade-4 |
Grade-5 |
TOTAL |
<40
n
% |
0
0.0 |
3
21.4 |
0
0.0 |
4
16.0 |
1
12.5 |
8
14.0 |
41-50
n
% |
3
50.0 |
6
42.9 |
1
25.0 |
11
44.0 |
4
50.0 |
25
43.9 |
51-60
n
% |
1
16.7 |
3
21.4 |
1
25.0 |
8
32.0 |
3
37.5 |
16
28.1 |
61-70
n
% |
2
33.3 |
2
14.3 |
2
50.0 |
2
8.0 |
0
0.0 |
8
14.0 |
TOTAL
n
% |
6
10.5
100.0 |
14
24.6
100.0 |
4
7.0
100.0 |
25
43.9
100.0 |
8
14.0
100.0 |
57
100.0
100.0 |
Table 2. Association between ER scoring: Cyclin D1 status
CYCLIN D1 STATUS |
ER scoring |
Grade-1 |
Grade-2 |
Grade-3 |
Grade-4 |
Grade-5 |
TOTAL |
1
n
% |
4
66.7 |
5
35.7 |
1
25.0 |
8
32.0 |
3
37.5 |
21
36.8 |
2
n
% |
0
0.0 |
5
35.7 |
1
25.0 |
4
16.0 |
4
50.0 |
14
24.6 |
3
n
% |
1
16.7 |
2
14.3 |
1
25.0 |
12
48.0 |
1
12.5 |
17
29.8 |
4
n
% |
1
16.7 |
2
14.3
|
1
25.0 |
1
4.0 |
0
0.0 |
5
8.8 |
TOTAL
n
% |
6
100.0 |
14
100.0 |
4
100.0 |
25
100.0 |
8
100.0 |
57
100.0 |
Table 3. Association between ER Pos & Neg: Cyclin D1 status
CYCLIN D1 STATUS |
ER pos & Neg |
Grade-1 |
Grade-2 |
Grade-3 |
Grade-4 |
Grade-5 |
TOTAL |
1
n
% |
2
33.3 |
10
71.4 |
3
75.0 |
17
68.0 |
5
62.5 |
37
64.9 |
2
n
% |
4
66.7 |
4
28.6 |
1
25.0 |
8
32.0 |
3
37.5 |
20
35.1 |
TOTAL
n
% |
6
100.0 |
14
100.0 |
4
100.0 |
25
100.0 |
8
100.0 |
57
100.0 |
Table 4. Association between PR scoring: Cyclin D1 status
CYCLIN D1 STATUS |
PR scoring |
Grade-1 |
Grade-2 |
Grade-3 |
Grade-4 |
Grade-5 |
TOTAL |
0
n
% |
1
16.7 |
1
7.1 |
0
0.0 |
3
12.0 |
2
25.0 |
7
12.3 |
1
n
% |
3
50.0 |
2
14.3 |
1
25.0 |
4
16.0 |
1
12.5 |
11
19.3 |
2
n
% |
1
16.7 |
0
0.0 |
0
0.0 |
2
8.0 |
0
0.0 |
3
5.3 |
3
n
% |
0
0.0 |
7
50.0 |
2
50.0 |
5
20.0 |
1
12.5 |
15
26.3 |
4
n
% |
1
16.7 |
1
7.1 |
1
25.0 |
4
16.0 |
3
37.5 |
10
17.5 |
5
n
% |
0
0.0 |
3
21.4 |
0
0.0 |
7
28.0 |
1
12.5 |
11
19.3 |
TOTAL
n
% |
6
100.0 |
14
100.0 |
4
100.0 |
25
100.0 |
8
100.0 |
57
100.0 |
Table 5. Association between PR pos & Neg: Cyclin D1 status
CYCLIN D1 STATUS |
PR pos and Neg |
Grade-1 |
Grade-2 |
Grade-3 |
Grade-4 |
Grade-5 |
TOTAL |
1
n
% |
2
33.3 |
10
71.4 |
3
75.0 |
15
60.0 |
4
50.0 |
34
59.6 |
2
n
% |
4
66.7 |
4
28.6 |
1
25.0 |
10
40.0 |
4
50.0 |
23
40.4 |
TOTAL
n
% |
6
100.0 |
14
100.0 |
4
100.0 |
25
100.0 |
8
100.0 |
57
100.0 |
Table 6. Association between Her2-Neu scoring: Cyclin D1 status
CYCLIN D1 STATUS |
Her2-Neu scoring |
Grade-1 |
Grade-2 |
Grade-3 |
Grade-4 |
Grade-5 |
TOTAL |
0
n
% |
2
33.3 |
6
42.9 |
1
25.0 |
4
16.0 |
2
25.0 |
15
26.3 |
1
n
% |
0
0.0 |
3
21.4 |
0
0.0 |
2
8.0 |
4
50.0 |
9
15.8 |
2
n
% |
1
16.7 |
3
21.4 |
2
50.0 |
3
12.0 |
1
12.5 |
10
17.5 |
3
n
% |
3
50.0 |
2
14.3 |
1
25.0 |
16
64.0 |
1
12.5 |
23
40.4 |
TOTAL
n
% |
6
100.0 |
14
100.0 |
4
100.0 |
25
100.0 |
8
100.0 |
57
100.0 |
Table 7. Association between Her2 Status: Cyclin D1 status
CYCLIN D1 STATUS |
Her2 Status |
Grade-1 |
Grade-2 |
Grade-3 |
Grade-4 |
Grade-5 |
TOTAL |
1
n
% |
3
50.0 |
2
14.3 |
1
25.0 |
15
60.0 |
2
25.0 |
23
40.4 |
2
n
% |
2
33.3 |
9
64.3 |
2
50.0 |
8
32.0 |
5
62.5 |
26
45.6 |
3
n
% |
1
16.7 |
3
21.4 |
1
25.0 |
2
8.0 |
1
12.5 |
8
14.0 |
TOTAL
n
% |
6
100.0 |
14
100.0 |
4
100.0 |
25
100.0 |
8
100.0 |
57
100.0 |
Table 8. Association between Ki-67 Status: Cyclin D1 status
CYCLIN D1 STATUS |
Ki-67 Status |
Grade-1 |
Grade-2 |
Grade-3 |
Grade-4 |
Grade-5 |
TOTAL |
High
n
% |
5
83.3 |
5
35.7 |
3
75.0 |
22
88.0 |
8
100.0 |
43
75.4 |
Low
n
% |
1
16.7 |
9
64.3 |
1
25.0 |
3
12.0 |
0
0.0 |
14
24.6 |
TOTAL
n
% |
6
100.0 |
14
100.0 |
4
100.0 |
25
100.0 |
8
100.0 |
57
100.0 |
Table 9. Association between tumor grade: Cyclin D1 Status
CYCLIN D1 STATUS |
TUMOR GRADE |
Grade-1 |
Grade-2 |
Grade-3 |
Grade-4 |
Grade-5 |
TOTAL |
2
Row %
Col % |
3
50.0 |
10
71.4 |
3
75.0 |
10
40.0 |
4
50.0 |
30
52.6 |
3
Row %
Col % |
3
50.0 |
4
28.6 |
1
25.0 |
15
60.0 |
4
50.0 |
27
47.4 |
TOTAL
Row %
Col % |
6
100.0 |
14
100.0 |
4
100.0 |
25
100.0 |
8
100.0 |
57
100.0 |
Table 10. Association between STAGE-T: Cyclin D1 status
CYCLIN D1 STATUS |
STAGE-T |
Grade-1 |
Grade-2 |
Grade-3 |
Grade-4 |
Grade-5 |
TOTAL |
1
n
% |
0
0.0 |
5
35.7 |
1
25.0 |
2
8.0 |
0
0.0 |
8
14.0 |
2
n
% |
4
66.7 |
7
50.0 |
2
50.0 |
16
64.0 |
4
50.0 |
33
57.9 |
3
n
% |
2
33.3 |
1
7.1 |
1
25.0 |
4
16.0 |
2
25.0 |
10
17.5 |
4
n
% |
0
0.0 |
1
7.1 |
0
0.0 |
3
12.0 |
2
25.0 |
6
10.5 |
TOTAL
n
% |
6
100.0 |
14
100.0 |
4
100.0 |
25
100.0 |
8
100.0 |
57
100.0 |
Table 11. Association between STAGE-N: Cyclin D1 status
CYCLIN D1 STATUS |
STAGE-N |
Grade-1 |
Grade-2 |
Grade-3 |
Grade-4 |
Grade-5 |
TOTAL |
0
n
% |
0
0.0 |
5
35.7 |
1
25.0 |
5
20.0 |
1
12.5 |
12
21.1 |
1
n
% |
5
83.3 |
5
35.7 |
1
25.0 |
9
36.0 |
4
50.0 |
24
42.1 |
2
n
% |
0
0.0 |
4
28.6 |
2
50.0 |
4
16.0 |
0
0.0 |
1
17.5 |
3
n
% |
1
16.7 |
0
0.0 |
0
0.0 |
7
28.0 |
3
37.5 |
1
19.3 |
TOTAL
n
% |
6
100.0 |
14
100.0 |
4
100.0 |
25
100.0 |
8
100.0 |
57
100.0 |
Table 12. Association between laterality: Cyclin D1 status
CYCLIN D1 STATUS |
Laterality |
Grade-1 |
Grade-2 |
Grade-3 |
Grade-4 |
Grade-5 |
TOTAL |
LL
n
% |
5
83.3 |
11
78.6 |
4
100.0 |
19
76.0 |
6
75.0 |
45
78.9 |
RL
n
% |
1
16.7 |
3
21.4 |
0
0.0 |
6
24.0 |
2
25.0 |
12
21.1 |
TOTAL
n
% |
6
100.0 |
14
100.0 |
4
100.0 |
25
100.0 |
8
100.0 |
57
100.0 |
Table 13. Association between location: Cyclin D1 status
CYCLIN D1 STATUS |
LOCATION |
Grade-1 |
Grade-2 |
Grade-3 |
Grade-4 |
Grade-5 |
TOTAL |
CENTRAL
n
% |
0
0.0 |
2
14.3 |
0
0.0 |
1
4.0 |
1
12.5 |
4
7.0 |
LI
n
% |
0
0.0 |
0
0.0 |
0
0.0 |
2
8.0 |
2
25.0 |
4
7.0 |
LO
n
% |
0
0.0 |
1
7.1 |
0
0.0 |
1
4.0 |
0
0.0 |
2
3.5 |
UI
n
% |
2
33.3 |
6
42.9 |
2
50.0 |
12
48.0 |
2
25.0 |
24
42.1 |
UO
n
% |
4
66.7 |
5
35.7 |
2
50.0 |
9
36.0 |
3
37.5 |
23
40.4 |
TOTAL
n
% |
6
100.0 |
14
100.0 |
4
100.0 |
25
100.0 |
8
100.0 |
57
100.0 |
Table 14. Association between molecular classification: Cyclin D1 status
CYCLIN D1 STATUS |
MOLECULAR CLASSIFICATION |
Grade-1 |
Grade-2 |
Grade-3 |
Grade-4 |
Grade-5 |
TOTAL |
HER2
n
% |
2
33.3 |
3
21.4 |
1
25.0 |
4
16.0 |
1
12.5 |
11
19.3 |
LA
n
% |
0
0.0 |
8
57.1 |
1
25.0 |
2
8.0 |
0
0.0 |
11
19.3 |
LB
n
% |
2
33.3 |
2
14.3 |
2
50.0 |
15
60.0 |
4
50.0 |
25
43.9 |
TN
n
% |
2
33.3 |
1
7.1 |
0
0.0 |
4
16.0 |
3
37.5 |
10
17.5 |
TOTAL
n
% |
6
100.0 |
14
100.0 |
4
100.0 |
25
100.0 |
8
100.0 |
57
100.0 |


