Abstract
We defined the depenadency level of the elderly, and calculated the annual transition probability of dependency level in Japan. Then incorporating this transition probability into a dynamic micro-simulation model named INAHSIM-II, we calculated expected years of each dependency level from birth for future years, applying the life table method. In this way, expectation of independent living at birth was obtained from the simulation, and we conclude that although extension of Healthy Life Expectancy is desirable, extension of Expectation of Independent Living is more important as a public health objective.
Key words
dependency level of the elderly, transition probabilities of dependency level, dynamic micro-simulation, expectation of independent living at birth.
Introduction
Public concern on health is high, and it is one of the highest priorities for the elderly. Various physical and mental functions inevitably deteriorate with age increase, but it is also known that there is a wide-range individual variation in this process. Quality of life is increasingly relevant not only to patients and disabled people but also to the elderly in general. Therefore, contrary to expectation of life which is calculated only from death rate, various measures taking quality of life into consideration have been developed.
Japanese expectation of life at birth has become the longest among major developed countries in 1980s, and it is still the case today. According to Complete Life Table for 2015, Japanese expectation of life at birth was 80.8 years for males and 87.0 years for females in 2015. The latest official population projection published in April 2017 assumed Japanese expectation of life at birth as 85.0 years for males and 91.4 years for females in 2065 [1].
Japanese Long-Term Care Insurance was implemented since April 2000, and rich LTC Insurance data are available for assessing the dependency level of the elderly. In Healthy Japan 21 (Second Term), which started in 2013, extension of healthy life expectancy at birth is one of the main objectives of the movement. There is about a 10-years discrepancy between life expectancy at birth and healthy life expectancy at birth, and narrowing the gap through health promotion and prevention of long-term care is considered to contribute not only to avoid deterioration of personal quality of life but also to control medical and long-term care expenditures in Japan.
The purpose of this paper is (1) to prepare an annual transition probability table of dependency levels for the elderly, and (2) to calculate expectation of independent living at birth. The author has so far tried several times to prepare an annual transition probability of dependency level for the elderly [2,3]. This time, we obtained a more realistic annual transition probability table of dependency levels, which was used in the INAHSIM 2017 Simulation. A new application of calculating expected years of each dependency level from birth was done in the simulation. Expectation of life at birth means an expected length of life, and expectation of independent living at birth means an expected length of independent living. We featured not only the independent living period but also home living period of the elderly. Explanation of the INAHSIM 2017 Simulation is found in Fukawa (2017) [4].
Annual transition probability of dependency level
(1) Dependency of the elderly
The dependency of the elderly aged 65 or over is classified into 5 levels as follows [2]:
Level 0: No disability and completely independent;
Level 1: Some disability but basically independent;
Level 2: Slightly or moderately dependent;
Level 3: Heavily dependent; and
Level 4: Death.
Levels 2 and 3 correspond to persons eligible for the LTC Insurance, and Level 3 corresponds to care need assessments 4 and 5 in particular. Annual dependency transition is given by age group and sex, and the death of the elderly is determined by dependency transitions from Levels 0-3 to Level 4 (Death).
(2) Distribution of the elderly by dependency level in 2015
The number of dependency levels 2 and 3 in 2015 was obtained by age group and sex from the LTC Insurance benefit monthly data (Note 1). The proportion of dependency level 0 was assumed to decline from 90% at age 50 for both sexes, through 50% at the age corresponding to expectation of life at birth minus 5 (Note 2), to 0% at age 104(males)/102(females) (Note 3). The number of dependency level 0 was calculated by using this proportion, and the number of dependency level 1 was the remainder. Table 1 shows the distribution of the elderly according to age group, sex and dependency level in 2015.
Table 1. Distribution of the elderly (65+) by age group, sex, and dependency level: 2015. Note: Number of LTC Insurance beneficiaries was as of October 2015.
Age Group |
Number (thousand) |
Proportion (%) |
Dependency level[a1] |
Dependency level |
Total |
0 |
1 |
2 |
3 |
0 |
1 |
2 |
3 |
|
Both sexes |
65+ |
33,466.4 |
18,044.0 |
11,477.8 |
2,732.2 |
1,211.4 |
53.9 |
34.3 |
8.2 |
3.6 |
65-69 |
9,643.9 |
6,406.7 |
3,072.2 |
116.8 |
48.2 |
66.4 |
31.9 |
1.2 |
0.5 |
70-74 |
7,695.8 |
4,584.2 |
2,835.8 |
198.0 |
77.8 |
59.6 |
36.8 |
2.6 |
1.0 |
75-79 |
6,276.8 |
3,310.8 |
2,478.2 |
353.0 |
134.8 |
52.7 |
39.5 |
5.6 |
2.1 |
80-84 |
4,961.4 |
2,253.5 |
1,846.0 |
627.9 |
234.0 |
45.4 |
37.2 |
12.7 |
4.7 |
85-89 |
3,117.2 |
1,104.3 |
950.6 |
756.4 |
305.9 |
35.4 |
30.5 |
24.3 |
9.8 |
90-94 |
1,349.1 |
333.7 |
256.3 |
500.0 |
259.1 |
24.7 |
19.0 |
37.1 |
19.2 |
95-99 |
359.4 |
49.2 |
32.7 |
151.9 |
125.6 |
13.7 |
9.1 |
42.3 |
34.9 |
100+ |
62.0 |
1.6 |
6.0 |
28.2 |
26.0 |
2.5 |
9.7 |
45.5 |
41.9 |
|
Males |
65+ |
14,485.4 |
7,533.0 |
5,749.6 |
877.7 |
325.1 |
52.0 |
39.7 |
6.1 |
2.2 |
65-69 |
4,659.7 |
2,977.5 |
1,588.9 |
67.1 |
26.2 |
63.9 |
34.1 |
1.4 |
0.6 |
70-74 |
3,582.4 |
2,013.3 |
1,429.3 |
101.0 |
38.8 |
56.2 |
39.9 |
2.8 |
1.1 |
75-79 |
2,787.4 |
1,346.3 |
1,235.0 |
149.0 |
57.1 |
48.3 |
44.3 |
5.3 |
2.0 |
80-84 |
1,994.3 |
787.7 |
918.0 |
212.5 |
76.1 |
39.5 |
46.0 |
10.7 |
3.8 |
85-89 |
1,056.6 |
325.4 |
449.3 |
209.5 |
72.4 |
30.8 |
42.5 |
19.8 |
6.9 |
90-94 |
333.3 |
73.7 |
113.3 |
107.1 |
39.2 |
22.1 |
34.0 |
32.1 |
11.8 |
95-99 |
63.3 |
8.6 |
14.3 |
27.2 |
13.2 |
13.6 |
22.6 |
43.0 |
20.9 |
100+ |
8.4 |
0.4 |
1.6 |
4.3 |
2.1 |
4.7 |
19.1 |
51.2 |
25.0 |
|
Females |
65+ |
18,981.0 |
10,511.0 |
5,728.2 |
1,854.5 |
886.3 |
55.4 |
30.2 |
9.8 |
4.7 |
65-69 |
4,984.2 |
3,429.1 |
1,483.4 |
49.7 |
22.0 |
68.8 |
29.8 |
1.0 |
0.4 |
70-74 |
4,113.4 |
2,570.9 |
1,406.5 |
97.0 |
39.0 |
62.5 |
34.2 |
2.4 |
0.9 |
75-79 |
3,489.4 |
1,964.5 |
1,243.2 |
204.0 |
77.7 |
56.3 |
35.6 |
5.8 |
2.2 |
80-84 |
2,967.1 |
1,465.7 |
928.1 |
415.4 |
157.9 |
49.4 |
31.3 |
14.0 |
5.3 |
85-89 |
2,060.6 |
778.9 |
501.3 |
546.9 |
233.5 |
37.8 |
24.3 |
26.5 |
11.3 |
90-94 |
1,015.8 |
260.0 |
143.0 |
392.9 |
219.9 |
25.6 |
14.1 |
38.7 |
21.6 |
95-99 |
296.1 |
40.6 |
18.4 |
124.7 |
112.4 |
13.7 |
6.2 |
42.1 |
38.0 |
100+ |
53.4 |
1.2 |
4.4 |
23.9 |
23.9 |
2.2 |
8.3 |
44.8 |
44.8 |
If we regard those elderly with dependency levels 0 and 1 as healthy, then the proportion of healthy elderly was 88% (92% for males and 86% for females) for the elderly as a whole, but the proportion declined from 98% for age group 65-69 to 44% for age group 90-94.
(3) Annual transition probability of dependency level: Assumptions
Table 2 shows how annual transition probabilities of dependency levels were calculated. This calculation was done by age group and sex under the following assumptions:
Table 2. Calculation of annual transition probabilities of dependency levels by age group and sex.
Dependency level year T |
Dependency level: Year T+1 |
0 |
1 |
2 |
3 |
4 |
0 |
y |
e |
f |
0.000 |
x |
1 |
|
c |
g |
h |
x1 |
2 |
|
|
b |
d |
x2 |
3 |
|
|
|
a |
x3 |
Note: x1, x2, x3 were assumed as follows (magnification of x).
|
65-69 |
70-74 |
75-79 |
80-84 |
85-89 |
90-94 |
95-99 |
100+ |
x1 |
4 |
3.5 |
3 |
2.5 |
2 |
1.5 |
1.5 |
1.2 |
x2 |
8 |
7 |
6 |
5 |
4 |
3 |
2 |
1.5 |
x3 |
16 |
12 |
10 |
8 |
6 |
4 |
3 |
2 |
-Let transition probability from dependency level 0 to dependency level 4 (we simply denote from L0 to L4) as x, then transition probabilities from L1 to L4 (x1), from L2 to L4 (x2), and from L3 to L4 (x3) are assumed as described at the footnote of Table 2. It is assumed that the difference in death rate caused by difference in dependency level will reduce with age increase.
- Transition probability from L0 to L0 (y) is determined as remaining rate in Life Table (described later).
- Transition probability from L0 to L3 is set as zero for all cases.
-The value of b in Table 2 is intermediate of y and a; the value of c is intermediate of y and b.
-The value of g in Table 2 is intermediate of d and e.
The dependency levels are assumed to remain or deteriorate. Therefore, dependency level 0 will become one of L0-L4 one year later. Dependency level 1 will become one of L1-L4 one year later, and soon. Using the assumptions mentioned above, a-h in Table 2 were determined as follows by age group and sex, if x and y were decided (except e):
a = 1- x3
b = (y + a) / 2
c = (y + b) / 2
d = 1- x2 - b
f = 1- x - y - e
g = (d + e) / 2
h = 1- x1 - c - g
(4) Annual transition probability of dependency level: Results
The value of x is decided uniquely by death rate. Let L(n) as a remaining number at age n in the Life Table 2015, and L(n,j) as the number of dependency level j among L(n). Then, y is determined as a five-year weighted average of y(n) = L(n+1,0) / L(n,0). The value of e in Table 2 is determined by the following equation: L(n,0) ・e + L(n,1) ・c = L(n+1,1).
Table 3 shows the results of annual transition probability of dependency level according to age group and sex in 2015. The value of x, 0.006 for males and 0.003 for females for age group 65-69, increased to 0.084 for males and 0.050 for females for age group 90-94. The value of y, 0.963 for males and 0.976 for females for age group 65-69, decreased to 0.754 for males and 0.793 for females for age group 90-94. Some adjustment was done at underlined parts in Table 3 in order to make all values positive, and values in the shaded parts were more or less artificial (Note 4) because reasonable values were not obtained by the above-mentioned method.
Table 3. Annual transition probability of elderly's dependency level: 2015.
Age group
|
|
Males |
Females
|
0 |
1 |
2 |
3 |
4 |
0 |
1 |
2 |
3 |
4 |
65-69
|
0 |
0.963 |
0.03 |
0.001 |
0 |
0.006 |
0.976 |
0.020 |
0.001 |
0 |
0.003 |
1 |
|
0.948 |
0.024 |
0.004 |
0.024 |
|
0.971 |
0.016 |
0.002 |
0.011 |
2 |
|
|
0.933 |
0.019 |
0.049 |
|
|
0.966 |
0.012 |
0.022 |
3 |
|
|
|
0.902 |
0.098 |
|
|
|
0.957 |
0.043 |
70-74 |
0 |
0.952 |
0.037 |
0.002 |
0 |
0.009 |
0.971 |
0.024 |
0.001 |
0 |
0.004 |
1 |
|
0.937 |
0.026 |
0.006 |
0.032 |
|
0.966 |
0.017 |
0.003 |
0.015 |
2 |
|
|
0.921 |
0.015 |
0.064 |
|
|
0.96 |
0.01 |
0.029 |
3 |
|
|
|
0.891 |
0.109 |
|
|
|
0.95 |
0.05 |
75-79
|
0 |
0.931 |
0.051 |
0.003 |
0 |
0.015 |
0.962 |
0.029 |
0.002 |
0 |
0.007 |
1 |
|
0.912 |
0.035 |
0.009 |
0.044 |
|
0.954 |
0.02 |
0.004 |
0.022 |
2 |
|
|
0.893 |
0.02 |
0.088 |
|
|
0.945 |
0.012 |
0.043 |
3 |
|
|
|
0.854 |
0.146 |
|
|
|
0.928 |
0.072 |
80-84
|
0 |
0.896 |
0.07 |
0.008 |
0 |
0.026 |
0.93 |
0.045 |
0.012 |
0 |
0.013 |
1 |
|
0.87 |
0.048 |
0.017 |
0.065 |
|
0.921 |
0.033 |
0.013 |
0.033 |
2 |
|
|
0.844 |
0.026 |
0.131 |
|
|
0.912 |
0.022 |
0.066 |
3 |
|
|
|
0.791 |
0.209 |
|
|
|
0.894 |
0.106 |
85-89
|
0 |
0.84 |
0.087 |
0.027 |
0 |
0.047 |
0.875 |
0.067 |
0.033 |
0 |
0.025 |
1 |
|
0.81 |
0.06 |
0.037 |
0.093 |
|
0.869 |
0.052 |
0.029 |
0.049 |
2 |
|
|
0.781 |
0.034 |
0.186 |
|
|
0.864 |
0.038 |
0.098 |
3 |
|
|
|
0.721 |
0.279 |
|
|
|
0.852 |
0.148 |
90-94
|
0 |
0.754 |
0.096 |
0.066 |
0 |
0.084 |
0.793 |
0.105 |
0.052 |
0 |
0.05 |
1 |
|
0.731 |
0.067 |
0.075 |
0.127 |
|
0.795 |
0.079 |
0.051 |
0.075 |
2 |
|
|
0.708 |
0.039 |
0.253 |
|
|
0.796 |
0.053 |
0.151 |
3 |
|
|
|
0.662 |
0.338 |
|
|
|
0.799 |
0.201 |
95-99
|
0 |
0.637 |
0.144 |
0.081 |
0 |
0.138 |
0.645 |
0.171 |
0.085 |
0 |
0.099 |
1 |
|
0.624 |
0.128 |
0.04 |
0.207 |
|
0.66 |
0.149 |
0.043 |
0.149 |
2 |
|
|
0.611 |
0.112 |
0.277 |
|
|
0.674 |
0.128 |
0.198 |
3 |
|
|
|
0.585 |
0.415 |
|
|
|
0.703 |
0.297 |
100+ |
0 |
0.491 |
0.187 |
0.086 |
0 |
0.236 |
0.397 |
0.272 |
0.136 |
0 |
0.196 |
1 |
|
0.5 |
0.162 |
0.055 |
0.283 |
|
0.45 |
0.238 |
0.078 |
0.235 |
2 |
|
|
0.509 |
0.136 |
0.354 |
|
|
0.503 |
0.204 |
0.293 |
3 |
|
|
|
0.528 |
0.472 |
|
|
|
0.609 |
0.391 |
Expectation of independent living
(1) Results from the INAHSIM 2017 Simulation
Dependency level is assigned only to the elderly aged 65 or over. We assume those elderly whose dependency levels are 0 or 1 as independent. We also assume that most of the elderly with dependency level 2 stay at home and most of the elderly with dependency level 3 stay at institutions.
A life table is prepared from an age specific death rate, and final output is expectation of life at each age. If we prepare a life table regarding dependency levels 3 and 4 as death, then we can obtain expectation of “home living” at each age. Similarly, we can obtain expectation of “independent living” and “super independent living” at each age, regarding dependency levels 2-4 and 1-4 as death respectively.
Table 4 shows the results, including expectation of independent living (IL) at birth, at 65, at 75, and at 85 years old. Expectation of life at birth will extend 4.5 years for males (from 80.8 to 85.3) and 4.1 years for females (from 87.0 to 91.1) in 50 years. This increment will be distributed among 4 dependency levels: 1.3 years for L0, 1.4 years for L1, 1.0 years for L2, and 0.8 years for L3 for males; and 0.9 years for L0, 1.1 years for L1, 0.9 years for L2, and 1.2 years for L3 for females. More than half of the gain will occur at more independent levels (namely L0 and L1) for males, but the gain will be more evenly distributed for females.
Table 4. Expectation of various periods at birth, 65, 75, and 85 years old: 2016-2065. Note: HL = Home Living, IL = Independent Living, SIL = Super Independent Living.
|
|
Expectation of Life |
Expectation of HL |
Expectation of IL |
Expectation of SIL |
|
|
0 |
65 |
75 |
85 |
0 |
65 |
75 |
85 |
0 |
65 |
75 |
85 |
0 |
65 |
75 |
85 |
Males |
2016 |
80.8 |
19.1 |
11.9 |
6.1 |
80.2 |
18.4 |
11.4 |
5.7 |
78.3 |
16.6 |
10.3 |
5.2 |
71.8 |
13.9 |
8.8 |
4.7 |
2025 |
81.4 |
19.6 |
12.4 |
6.4 |
80.8 |
18.9 |
11.8 |
5.9 |
78.8 |
16.9 |
10.5 |
5.3 |
72.0 |
14.0 |
8.9 |
4.8 |
2035 |
82.3 |
20.2 |
12.8 |
6.7 |
81.5 |
19.4 |
12.1 |
6.2 |
79.3 |
17.2 |
10.8 |
5.5 |
72.3 |
14.1 |
9.0 |
4.8 |
2045 |
83.2 |
21.0 |
13.5 |
7.2 |
82.2 |
19.9 |
12.6 |
6.5 |
79.8 |
17.5 |
11.0 |
5.7 |
72.5 |
14.3 |
9.2 |
5.0 |
2055 |
84.2 |
21.8 |
14.1 |
7.7 |
83.0 |
20.5 |
13.0 |
6.9 |
80.4 |
17.9 |
11.3 |
5.8 |
72.8 |
14.4 |
9.3 |
5.1 |
2065 |
85.3 |
22.7 |
14.9 |
8.3 |
83.9 |
21.2 |
13.5 |
7.2 |
81.0 |
18.2 |
11.5 |
6.0 |
73.1 |
14.5 |
9.4 |
5.2 |
Females |
2016 |
87.0 |
24.1 |
15.6 |
8.3 |
86.1 |
23.1 |
14.7 |
7.5 |
83.6 |
20.7 |
13.0 |
6.4 |
75.7 |
17.3 |
11.1 |
5.4 |
2025 |
87.7 |
24.6 |
16.0 |
8.6 |
86.6 |
23.5 |
15.0 |
7.7 |
84.0 |
20.9 |
13.2 |
6.5 |
75.8 |
17.4 |
11.2 |
5.5 |
2035 |
88.3 |
25.1 |
16.5 |
8.9 |
87.1 |
23.8 |
15.3 |
7.9 |
84.3 |
21.2 |
13.4 |
6.6 |
76.0 |
17.5 |
11.2 |
5.5 |
2045 |
89.2 |
25.8 |
17.1 |
9.4 |
87.7 |
24.3 |
15.7 |
8.2 |
84.8 |
21.5 |
13.6 |
6.8 |
76.2 |
17.6 |
11.3 |
5.6 |
2055 |
90.1 |
26.6 |
17.8 |
10.0 |
88.3 |
24.8 |
16.1 |
8.5 |
85.2 |
21.7 |
13.8 |
6.9 |
76.4 |
17.7 |
11.5 |
5.7 |
2065 |
91.1 |
27.5 |
18.6 |
10.7 |
89.0 |
25.3 |
16.5 |
8.8 |
85.6 |
22.0 |
14.0 |
7.1 |
76.6 |
17.8 |
11.5 |
5.8 |
Expectation of life at 75 years old will extend 3.0 years for both males and females in 50 years (Table 4). This increment will be distributed among 4 dependency levels: 0.6 years for L0 and L1, and 0.9 years for L2 and L3 for males; and 0.4 years for L0, 0.6 years for L1, 0.8 years for L2, and 1.2 years for L3 for females. Total increment will be distributed mildly weighted towards more dependent levels for males, but this tendency will be quite remarkable for females.
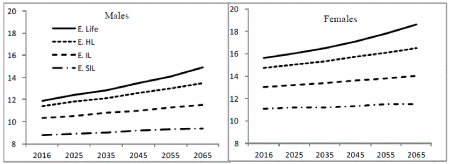
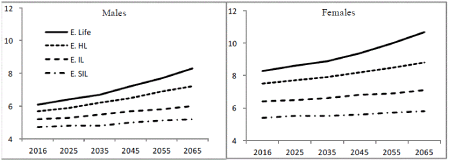
Figure 2 shows how expectation of various periods at 75 years old changes in future. Female data are always superior to male data, and a future increase in the Expectation of Independent Living, for example, will not be able to match with a future increase in Expectation of Life. Situation will be almost the same at 85 years old (Figure 3).
(2) Comparison to healthy life expectation
The Healthy Life Years (HLY) indicator (also called disability-free life expectancy) measures the number of remaining years that a person of a certain age is still supposed to live without disability. Healthy Life Years is an indicator to monitor not only the length of life, as is the case for life expectancy, but also the quality of life.
Life expectancy (LE) at a given age is the average remaining years of life a person can expect to live on the basis of the current mortality rates for the population. Healthy life expectancy (HLE) estimates the equivalent healthy years that a person can expect to live on the basis of the current mortality rates and prevalence distribution of health status in the population.
Table 5 shows a comparison of life expectancy at birth and healthy life expectancy at birth as well as at 60 for 12 countries in 2015. Life expectancy among men is highest in Sweden (80.7 years), while for women, it is highest in Spain (85.5 years) among European EU countries in Table 5. Japan is the longest in both indexes. Higher life expectancy is generally associated with higher healthy life expectancy, and in fact healthy life expectancy at birth is about 87 or 88% of life expectancy at birth for every country in Table 5. Despite females have a higher number of years in good health than males, males live a higher proportion of their lives in good health and disability-free in all countries in Table 5.
Table 5. Healthy life expectancy at birth in 12 countries: 2015. Source: WHO World Health Statistics 2017 and WHO Global Health Observatory data.
(In years) |
|
Total population
(million) |
Life expectancy at birth |
Healthy life expectancy
at birth |
Healthy life expectancy
at 60 |
Males |
Females |
Both sexes |
Males |
Females |
Both sexes |
Males |
Females |
Both sexes |
Australia |
24 |
80.9 |
84.8 |
82.8 |
70.8 |
72.9 |
71.9 |
18.6 |
20.5 |
19.6 |
Belgium |
11.3 |
78.6 |
83.5 |
81.1 |
69.4 |
72.8 |
71.1 |
17.2 |
19.9 |
18.6 |
Canada |
35.9 |
80.2 |
84.1 |
82.2 |
71.3 |
73.3 |
72.3 |
18.6 |
20.6 |
19.7 |
France |
64.4 |
79.4 |
85.4 |
82.4 |
70.7 |
74.4 |
72.6 |
18.7 |
21.7 |
20.3 |
Germany |
80.7 |
78.7 |
83.4 |
81 |
69.7 |
72.8 |
71.3 |
17.2 |
19.9 |
18.6 |
Italy |
59.8 |
80.5 |
84.8 |
82.5 |
71.8 |
73.7 |
72.8 |
18.7 |
20.9 |
19.9 |
Japan |
126.6 |
80.5 |
86.8 |
83.7 |
72.5 |
77.2 |
74.9 |
18.9 |
23.1 |
21.1 |
Netherlands |
16.9 |
80 |
83.6 |
81.9 |
71.2 |
73.2 |
72.2 |
18 |
20.4 |
19.3 |
Spain |
46.1 |
80.1 |
85.5 |
82.8 |
70.6 |
74.1 |
72.4 |
17.8 |
20.9 |
19.4 |
Sweden |
9.8 |
80.7 |
84 |
82.4 |
71.1 |
73 |
72 |
18.2 |
20 |
19.1 |
UK |
64.7 |
79.4 |
83 |
81.2 |
70.3 |
72.5 |
71.4 |
17.8 |
18.8 |
USA |
321.8 |
76.9 |
81.6 |
79.3 |
67.7 |
70.4 |
69.1 |
17 |
19.1 |
18.1 |
Japanese healthy life expectancy at birth in Table 5 (72.5 years for males and 77.2 years for females) is rather similar to the value of expectation of super independent living at birth in Table 4 (71.8 years for males and 75.7 years for females).
Discussions
The calculation of annual transition probabilities of dependency levels was done with many assumptions, and each assumption must be verified by its appropriateness. Especially, the proportion of dependency level 0 was merely assumed, and there is so far little evidence whether the proportion of dependency level 1 is realistic. Moreover, concerning e in Table 2, there was only a small discrepancy between what was obtained from the equation and what was actually adopted in Table 3 for males (except age group 95+), but pertinent values could not be obtained from the equation for females aged 75 or over. One possible reason for these problems could be that the proportions of dependency levels 2 and 3 at an advanced age group for females in 2015 were too high, although Table 1 correctly reflects the reality in 2015. Having these defects, however, the transition probability itself is not only interesting to each individual, but also it is necessary information to capture elderly care needs of the society as a whole.
As clearly shown in Table 1, the number and proportion of those elderly who have some kind of care needs increase with age, and LTC is a universal need for those elderly with advanced age. In this paper, we focused on dependency level of the elderly and did not distinguish the location of them (whether they are at homes or in institutions). However, with references to future trends of the number of those elderly who need institutional care and development of community care settings in coming years, importance of the location of the elderly may increase remarkably.
The gender gap in life expectancy has narrowed over the past 25 years in many countries, but women still live 5.5 years more than men on average across EU countries (83.6 years for women and 78.1 years for men in 2014) [5]. The gender gap in healthy life years is much smaller than for life expectancy, reflecting the fact that in nearly all countries, women can expect to live a smaller proportion of their lives without disability [6].
Healthy life expectancy (HLE) is a population health measure that combines age-specific mortality with morbidity or health status to estimate expected years of life in good health for persons at a given age. HLE reflects both quality and quantity of life and might be useful in describing and monitoring the health status of a population [7]. Since 2010, the HLY at birth has been measured in the EU28 around 62.0 for women and around 61.6 for men, and HLY improvement such as to increase the average healthy lifespan of Europeans by 2 years by 2020 is the main health goal for the EU [8].
Healthy life expectancy based on self-reported health status information may face in general with comparability problems across countries due to differences in survey design and methods, and more
importantly to cultural differences in reporting of health. When asked "How is your health in general?" only 35% of people in Japan reported to be in good health, much less than the OECD average of 69%, therefore caution is required in making cross-country comparisons as the assessment can be affected by factors such as cultural background [9]. Nevertheless, HLE is a clear, consistent, and important population health outcome measure that can inform judgments about value for health care investment, and can be an important outcome measure to guide and evaluate resource allocation and improvement initiatives for both health care systems and public health agencies [10]. Because differences in HLE by demographics might result from variations in morbidity or mortality, examining HLE as a percentage of LE reveals populations that might be enduring illness or disability for more years [11].
HLE is a relatively simple measure that can be readily used by public health officials, health-care providers, and policy makers to monitor trends in the health of populations and identify health inequalities
- HLE is used for a variety of purposes, including highlighting health inequalities, targeting resources for health promotion, evaluating the impact of health policies, and planning for health, social, and fiscal policy
- The United Kingdom currently uses HLE in a variety of policy applications, for example, to monitor the quality of life and social exclusion of the elderly, as an indicator of sustainable development, and in deliberations on changing the retirement age [12,13]. In the United States, the two goals of the federal government's Healthy People 2010 initiative are increasing the quality and years of healthy life and eliminating disparities [14].
A major question with an aging population is whether increases in life expectancy will be associated with a greater or lesser proportion of the future population spending their years living with disability [8]. The change in the ratio of HLE to life expectancy (LE) over time is a measure of the compression or expansion of morbidity in a population, or the extent to which an increase in life expectancy is accompanied by an increase or decrease in the burden of ill health [10]. Decomposition of HLE into the specific conditions that lead to mortality and morbidity illustrates the utility of the composite measure by providing important insights into how to improve overall HLE, including the impact on the compression or expansion of morbidity.
Between 2010 and 2014, there have been virtually no gains in healthy life years for men and women in many EU countries, which suggests that greater efforts may be needed to prevent illness and disability and to improve the management of these conditions to reduce their disabling effects [6]. As mentioned earlier, Japanese healthy life expectancy at birth in Table 5 is rather similar to the value of expectation of super independent living at birth in Table 4. An increase in life expectancy will be distributed among 4 dependency levels. Therefore, in considering the gap between life expectancy and healthy life expectancy, the meaning of healthy is quite important. Extension of healthy life expectancy, which rather corresponds to a quite healthy period with no disability and completely independent in Japanese context, is off course desirable. However, not everybody can expect super-independent living at old age, and extension of expectation of independent living is more important as a public health objective.
(Note 1) We used October 2015 data.
(Note 2) According to the Life Table 2015, expectation of life at birth was 80.8 years for males and 87.0 years for females. Therefore, we assumed the proportion of dependency level 0 would be 50% at age 76 (=81-5) for males and 82 (=87-5) for females.
(Note 3) We were obliged to decrease the age at which the proportion of dependency level 0 would be 0% for females. Otherwise, we could not gain enough number of dependency level 1 for females aged 95 or over.
(Note 4) The value of e in Table 2 is desirably determined by the equation, but we assumed e (95-99) was 150% of e (90-94) and e (100+) was 130% of e (95-99) for males. For females however, we decided (75-79) and e (80-84) in line with male data, and we assumed e vs. f would be 2 to1 for age group 85-89 and above.
References
- National Institute of Population and Social Security Research (2017) Population Projections for Japan: 2015-2065.
- Fukawa T (2010) Household Projection using INAHSIM and its Application to Medical/LTC Expenditure Projection in Japan. In Econometric Model Analysis for Social Security. University of Tokyo Press.
- Fukawa T (2012) Projection of Social Burden of the Elderly in Japan Using INAHSIM-II. Epidemiology Research International p. 9.
- Fukawa T (2017) Population-household Projection in Japan: INAHSIM 2017 Simulation. IFW Discussion Paper Series 2017-E1.
- Eurostat (2015) People in the EU- Statistics on an Ageing Society.
- OECD (2016) Health at a Glance: Europe 2016.
- Centers for Disease Control and Prevention (CDC) (2013) State-specific healthy life expectancy at age 65 years--United States, 2007-2009. MMWR Morb Mortal Wkly Rep 62: 561-566. [Crossref]
- European Commission (2017) Healthy Life Years.
- OECD (2013) OECD Better Life Index: Country Reports.
- Stiefel, Matthew C, Perla Rocco J, Zell Bonnie L (2010) A Healthy Bottom Line: Healthy Life Expectancy as an Outcome Measure for Health Improvement Efforts. The Milbank Quarterly 88: 30-53.
- European Commission (2009) Healthy Life Years.
- Bajekal M (2007) Health Expectancies: The UK Experience, REVES.
- UK Office for National Statistics (2016) Health State Life Expectancies, UK.
- U.S. Department of Health and Human Services (2009) Healthy People 2010: Executive Summary.