Abstract
Among many nanotechnological applications, the therapeutical use of nanocarriers is of relevance. G-1, a G-protein estrogen receptor (GPER-1) selective agonist, was encapsulated in polymeric nanoparticles and liposomes modified for central nervous system applications. GPER-1 signals through the rapid estrogen pathway, which is linked with neuroprotection and anti-inflammatory phenomena. Polyssorbate-80-coated PLGA nanoparticles and anti-transferrin antibody labelled immunoliposomes were synthesized. The nanoparticles were obtained by the oil-in-water emulsion method followed by sonication. This synthesis was in terms of surfactant (DMAB or DDAB), sonication regime, T-80 solution dispersion volume and size of stirrer on the size, polidispersity and zeta potential of the nanoparticles. Immunoliposomes containing either DPPC:CH:DSPE-PEG2000or DOPC:CH:DSPE-PEG2000 at 4:1:0.2 molar proportions and DSPE-PEG2000-Transferrin(mAb); were obtained by the lipid film hydration method followed by sonication. DMAB tends to produce more monodisperse and stable particles. Moreover, immunoliposomes obtained with DOPC are smaller than those with DPPC. In vitro experiments were performed with Neuro-2a and/or SHSY5Y cells. The results show that T-80-coated NPs do not possess cytotoxicity at low dilutions (324 µg/mL) and are internalized within 24 h. On the other hand, immunoliposomes did not reveal cytotoxicity and were internalized in neurons in less than 30 min. G-1 was encapsulated in both systems, in which PLGA nanoparticles revealed a much lower encapsulation efficiency 41,45 ± 4,05% than immunoliposomes 97,17 ± 2,84%. These process optimizations may elucidate many aspects of nanocarrier synthesis. It is also believed that G-1-loaded nanocarriers may be efficient for the treatment of several central nervous system diseases more efficiently.
Keywords
polymeric nanoparticles, immunoliposomes, central nervous systems, cytotoxicity.
Introduction
Nanotechnology refers to the study of devices that possess one of its dimensions below 100 nm. Nonetheless, due to the large variety of systems and their applicability in different areas, the FDA considers a nanotechnological device if it is within the 1-1000 nm scale[1]. Nanomedicine comprises an important area of nanotechnology in which systems act at the molecular level focusing on treatment, prevention or diagnostics of various diseases. Nanocarriers are, therefore, a key component of nanomedicine regarding the delivery of drugs[2]. Liposomes, micelles, nanoparticles, dendrimers and nanotubes are among the great variety of nanocarriers that have already been synthesized [3,4]. Liposomes and polymeric nanoparticles are two different nanosystems that have been previously used for drug delivery.
Liposomes (LPs) are vesicles formed by at least one double layer of phospholipids and an aqueous core [5]. Their outer layer can be modified as to contain polyethylene glycol (PEG), which then reduces the systemic clearance and inhibits the interaction with serum proteins, such as opsonins; thus limiting the carrier removal rate by cells from the mononuclear phagocyte system. These liposomes containing a PEG-coating are denominated sterically stabilized liposomes[6-8]. They may possess other functionalizations, namely the placement of vectors in the outer layer of the vesicle. The addition of vectors in liposomes may assist them in overcoming different barriers in the organism, such as the blood-brain barrier (BBB). In this context, the monoclonal antibody of the transferrin receptor revealed to enhance the capability of the vesicles in reaching the central nervous system (CNS)[9,10]. A liposome associated with an antibody is denominated an immunoliposome. Liposomes may also be formed by different kinds of lipids, and the phosphatidylcholines (PCs) are among the most frequently used. PCs are glycerophospholipids in which a choline is linked to the phosphate moiety being, as well, the most abundant class of lipids in eukaryotic cells[11]. Among the most studied PCs, dipalmitoylphosphatidylcholine (DPPC) and dioleylphosphatidylcholine (DOPC) are to be named [11].
Polymeric nanoparticles (NPs), on the other hand, are colloidal particles formed by polymeric chains. There are numerous kinds of structural polymers that can be used on nanoparticles synthesis, being the biodegradable ones, such as the FDA approved poly(D, L-lactide-co-glycolide acid) (PLGA), of great biological interest[12,13]. PLGA is slowly metabolized, forming the copolymer monomers, lactic and glycolic acids, which finally are decomposed in the citric acid cycle [14]. During the synthesis of NPs, the emulsification step involves a surfactant in order to reduce particle polydispersity and size. Polyvinyl alcohol (PVA) is largely used, as it is easily dispersed in the aqueous phase and can result a monodisperse population of particles; although particles that retain less PVA are more easily internalized by the target-cells[15,16]. The quaternary ammonium bromides, such as didodecyldimethylammonium bromide (DMAB) or didecyldimethylammonium bromide (DDAB), have also been previously employed for nanoparticle synthesis resulting in monodisperse and reduced-size particle populations (means of 108 and 90 nm respectively)[17,18]. These carriers can also be functionalized, like LPs, in order to improve cell-, tissue- and system-targeting. NPs coated with polyssorbate-80 have been shown to be more promptly captured by endothelial cells of the encephalic capillaries by a yet to be elucidated endocytotic mechanism[19,20].
Lastly, G-1 is a G-protein coupled estrogen receptor 1 (GPER-1) selective agonist, being rather recently synthesized[21]. GPER-1, a seven-transmembrane-helix receptor, activation cascade and its effects are considerably distinct from the genomic or non-genomic pathways mediated by the classic estrogen nuclear receptors (ERs). GPER-1 signals through the rapid-pathway, in which activation of kinases, such as ERK/MAPK, PKA, PLC/PKC and PI3K/Akt/mTOR are possibly linked to the rapid effects mediated by GPER-1 activation[22]. Different from the genomic actions of estrogen, the activation of GPER-1 do not elicit feminizing aspects[23]. It has been demonstrated that G-1 improves the cognitive abilities and social learning of mice[24,25]. It may also possess anxiolytic potential in mice[26,27]; and potential antineoplasic effects, as it is capable of inhibiting the proliferation of cervical, adrenocortical carcinoma and breast tumor cells[28-30]. G-1 has also anti-inflammatory properties, raising T regulatory cell population and IL-10 secretion[31,32]. This may have some association as to why G-1 reduces multiple sclerosis deficits[33]. It has also been previously verified that G-1 has neuroprotective actions in a Parkison’s disease MPTP model in mice, and also in an in vitroischemia model in primary cortical brain cells[34,35].
Thus, this work aimed to compare and optimize the synthesis of two different nanocarriers, the polyssorbate-80-coated polymeric nanoparticles and the anti-transferrin labelled immunoliposomes, and encapsulate this promising drug, G-1, regarding its neuroprotective actions, as extensively researched previously.
Materials and methods
Materials
PLGA 50:50, DMAB, DDAB, Fluorescein isothiocyanate isomer I (FITC), ethyl acetate (HPLC), MTT (3-(4,5-Dimethylthiazol-2-yl)-2,5-Diphenyltetrazolium bromide) and anti-β-actin monoclonal antibody (mouse) were purchased from Sigma-Aldrich. The anti-pan-cadherin antibody (goat) was obtained from Santa Cruz. DPPC, DOPC, cholesterol (CH), pegylated (2000 kDa chain) disthearoylphosphatidylethanolamine (DSPE-PEG2000), pegylated (2000 kDa chain) with maleimide headgroup disthearoylphosphatidylethanolamine (DSPE-PEG2000-Mal) were from Avanti Lipids and the anti-transferrin monoclonal antibody (mouse) was from Bio X-cell; all of which were kindly provided by Professor Gerhard Wunderlich group. Polyssorbate-80 (T-80 or Tween-80) (U.S.P.) was obtained from Synth and Dulbecco’s Modified Eagle’s Medium (DMEM) from Vitrocell.
Synthesis of nanoparticles and its optimization
NPs were synthesized by the oil-in-water emulsion method, in which 50 mg of PLGA were solubilized in 2.5 mL of ethyl acetate and emulsified with a solution of distilled water and a surfactant (1 % w/v either DMAB or DDAB). The emulsion was then sonicated and left in overnight agitation, followed by centrifugation (25 min, 17,000 g, 4 °C), in which the pellet was resuspended with a solution of T-80 (4 % v/v in distilled water). The dispersion was agitated with a magnetic stirrer for 1h, and was centrifuged once again. The pellet was, this time, resuspended in distilled water. FITC-loaded nanoparticles (FITC-NPs) were obtained with small modifications from this protocol, in which 2 mg of FITC were solubilized in a solution of 53% acetone/ethyl acetate (v/v) and added proportionally to the PLGA solution. G1-loaded nanoparticles (G1-NPs) were prepared by dissolving G-1 into ethyl acetated and adding a fixed quantity of 2 µg of the drug to the PLGA solution. FITC-NPs and G1-NPs’ T-80 adsorption time was decreased to 10 min. Nanoparticles synthesis was optimized by the sonication regime, the adsorption parameters and by the type of surfactant in the water phase. They were characterized by particle diameter, polydispersity index (PDI), zeta (ζ) potential and morphology by scanning electron microscopy with field emission gun (SEM-FEG), which took place in Centro de MicroscopiaEletrônica (CEME) da Universidade Federal de São Paulo (UNIFESP).
Synthesis of immunoliposomes and its optimization
LPs were synthesized by hydration of lipid film, starting from a mixture of the lipids DPPC/DOPC:CH:DSPE2000 (4:1:0.2 molar proportions) and 5 µg of the conjugated antibody-lipid DSPE-PEG2000(Mal-Transferrin antibody) dissolved in chloroform. The conjugation of lipid and the antibody was performed with 2-iminothiolane (Traut’s reagent). Traut’s reagent (14 mM) was mixed with the anti-transferrin antibody in PBS (pH 8,0) for 2 h, 30 °C. The thiolated antibody was then purified in a Sephadex G-25 desalting column. DSPE-PEG2000(Mal) in 10:1 (molar to the antibody) was then added in PBS (pH 6,0) until a lipid film was formed, after which it was resuspended and left agitating overnight. The chloroform was evaporated, and the formed film was hydrated with PBS (pH 7.4). The solution was then sonicated and either filtrated using a 0.45 µm syringe filter and/or centrifugated. FITC-loaded immunoliposomes (FITC-LPs) were prepared resuspending the lipid film with a FITC solution in PBS (100 µg/mL); and G1-loaded immunoliposomes (G1-LPs) were obtained by adding a total of 1 µg of the drug dissolved in chloroform to the lipid mixture. LPs synthesis was optimized by the type of phospatidylcholine used, the sonication regime, the chloroform evaporation method (either 37 °C with agitation; or 37°C, 1 h, vacuum) and the centrifugation method (either using 1 h, 21,000 g, 4 °C; or 10 min, 5,000 rpm, 25 °C). They were characterized by vesicle diameter, PDI and zeta potential.
Cytotoxicity profile of the optimized nanocarriers in SHSY5Y and Neuro-2a
Empty LPs and NPs were tested as for their cytotoxic profile on neuroblastoma cell lines, either human (SHSY5Y, ATCC® CRL-266TM) or murine (Neuro-2a or N2a, ATCC® CCL-131TM). The cells were cultivated in DMEM + 10% FBS and were plated in 96-well multiwell plates at 4x10⁴cells/well for the experiments. The nanocarriers were serially diluted from 1:5, 1:25 – 1:78125 (v/v) in the well and incubated for different periods (15 h and 24 h for N2a; 12h and 24 h for SHSY5Y). The cell viability was availed with a MTT padronized assay.
Nanocarriers effects on the intracellular delivery of FITC in SHSY5Y and Neuro-2a
Empty nanocarriers were incubated for different time periods in 24-well multiwell plates containing coverslips at 4x10⁵ cells/well containing either SHSY5Y or N2a cells. For LPs, 30 minutes, 6 h and 24 h-time periods were availed, and for NPs, 6 h, 12 h and 24 h. After the incubation period, the medium was drained and the well was washed with 4 °C sterile PBS, following a 30 minute-incubation of methanol at 4 °C. The alcohol was drained, and was followed by PBS and PBS + glycine (7,5 mg/mL) washes. The block solution (5% donkey serum + 0.05% Triton X-100 in PBS v/v) was applied for 1 h, and was followed by the primary antibody-containing solution (1% donkey serum + 0.01% Triton X-100 + either 1:1.000 anti-pancadherin antibody or 1:4.000 anti-β-actin antibody in PBS), which was incubated for 16 h at 4 °C. After new PBS washes, the secondary antibody solution was applied (0.05% Triton X-100 + Alexa Fluor 594 either donkey anti-goat or anti-mouse) and incubated for 2 h. Finally, 4′,6-Diamidine-2′-phenylindole dihydrochloride (DAPI) was applied. FluoromountTMwas used to apply converslips onto the slides, which were analyzed on a Nikon Eclipse 80i fluorescence microscope.
G-1 encapsulation efficiency
G-1 quantification was obtained by a high performance liquid chromatography (HPLC) method, in which a C18 column was used. The flux was fixed at 1 mL/min, 20% devoted to deionized water acidified with phosphoric acid (pH 3.2) and 80% to acetonitrile. The column temperature was stablished at 25 °C and the UV detector to 254 nm wavelength. The encapsulation efficiency was determined by the indirect method. Nanoparticles were separated by centrifugation and their supernatant was collected. LPs were ultrafiltered with a 10 kDa filter (Millipore), and the supernatant was collected, as well.
Data analysis and statistical treatment
Data were analyzed by the following softwares: GraphPad Prism 6.0, Microsoft Office Excel 2016, Minitab 17 and OriginPro 9. Different statistical tests were applied, such as two-way analysis of variance, unpaired Student’s t test, non-linear regression and the complete factorial test. Statistically significant comparisons were availed to the 5% level and data was plotted as mean ± standard error of mean (s.e.m.).
Results
Polymeric nanoparticle characterization and optimization
We optimized the synthesis of NPs on the emulsification, sonication and T-80 adsorption steps. Two different sonication regimes were compared, one with 5 pulses of 30 s of sonication and one with 5 pulses of 50 s of sonication, both of those regimes having a 30 s gap between pulses. Nanoparticles mean diameter, PDI and ζ potential were verified in each synthesis step for both treatments (Figure 1). The different sonication treatments do not influence particle size (F(1, 34) = 0,1605, p = 0,6912), in contrast to the effects of the synthesis steps (F(5, 34) = 5,8101, p = 0,0006). NPs start, after a 30-pulse sonication regime, with a 59,63 ± 1,60 nm mean diameter and reach 84,36 ± 1,33 nm at the end of the synthesis. PDI is not affected neither by sonication (F(1, 34) = 0,0922, p = 0,7632) or by the synthesis procedure (F(5, 34) = 0,6929, p = 0,6323); although ζ potential is clearly inverted after T-80 adsorption. Additionally the different sonication regimes do affect nanoparticles ζ potential (F(1, 34) = 5,631, p = 0,0235), in which the 50 s-pulse regime results a more negative ζ potential at the end of the synthesis.
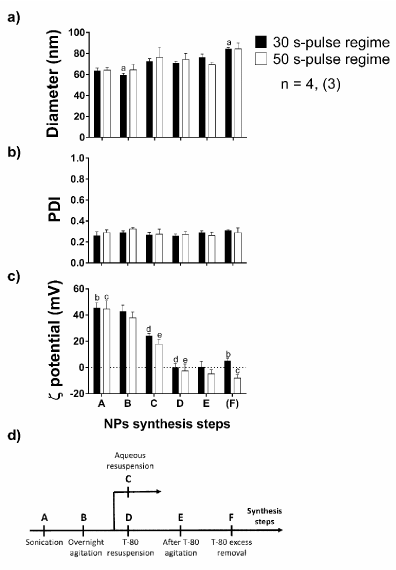
Figure 1. (a) Particle diameter, (b) PDI and (c) ζ potential in the synthesis characterization while comparing two different sonication regimes, one with five 30 s pulses and another with 50 s pulses. The sample size is 4 for most synthesis steps, with the exception of the last step, in which 3 replicates were executed. The two-way ANOVA was employed along with the Holm-Šídák test; and statistically significant comparisons at the 5 % level are marked by letters (a-e). (d) A fluxogram of the synthesis procedure of NPs is revealed, being A: post-sonication; B: after overnight agitation; C: after aqueous resuspension (control); D: after T-80 resuspension; E: after 1 h agitation in T-80 solution; F: after T-80 excess removal. pa, pb, pc< 0,0001; pd = 0,0055; pe = 0,0279.
It was also compared if the employment of two different surfactants, DMAB and DDAB, in the emulsification step would result in different properties of the formed NPs. The data collection was done for each synthesis step while comparing the distinct treatment of either DMAB or DDAB (Figure 2). In this case, it was not possible to verify statistical difference between the treatments when it comes to the 5 % level. Nevertheless, it may not be overlooked that there are some tendencies that DMAB-synthesized NPs be less polydispersed and more electrostatically stable, due the more negative ζ potential, at the end of the NP synthesis, therefore DMAB was selected for future NP synthesis.
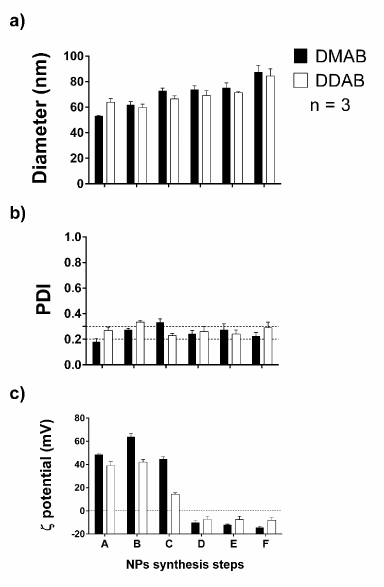
Figure2.(a) Particle diameter, (b) PDI and (c) ζ potential in the synthesis characterization while comparing two different sonication regimes, one with five 30 s pulses and another with 50 s pulses. The dotted lines in the PDI graph limit the most desirable PDI values zone. The sample size is 3 for each synthesis step. The two-way ANOVA was employed along with the Holm-Šídák test. The letters on x-axis refer to the synthesis steps illustrated on the Fig. 1d fluxogram, being A: post-sonication; B: after overnight agitation; C: after aqueous resuspension (control); D: after T-80 resuspension; E: after 1 h agitation in T-80 solution; F: after T-80 excess removal.
Lastly, the T-80 adsorption step was optimized using a 2² factorial test, in which one of the selected variables was the T-80 resuspension volume (variable A) and the other one, the size of the magnetic stirrer (B). Each variable would possess two different levels, as shown in Table 1. Table 2 reveals the factorial test design, in which all variable levels were combined in order to verify distinct aspects of NP diameter and ζ potential. Lastly, Table 3 shows the effects for each response element (NP diameter and ζ potential). From these data, it is possible to verify that the interaction between both variables (AB) greatly influence both nanoparticle size and stability, as well as the T-80 resuspension volume itself. Therefore, using the inferior level of variable A, and the superior level of variable B [A(-), B(+)], thus being, resuspending the nanoparticles in 1 mL of T-80 and agitating them with a 10 x 8 x 8 mm magnetic bar, would render more suitable NPs in terms of diameter and ζ potential.
Table 1.2² factorial test factors (variables) and levels. Each factor possesses a superior (+) and inferior (-) level in a 2² factorial test.
Variable |
Levels |
A |
T-80 resuspension volume |
+ |
2 mL |
- |
1 mL |
B |
Magnetic stirrer size |
+ |
10 x 8 x 8 mm |
- |
8 x 1.5 x 1 mm |
Table 2.2² factorial design in standard order and results. The run order is random in order to improve statistical power. For each scenario of variable levels, the response elements diameter and ζ potential of the particles were measured.
Standard order |
Run order (random) |
Variable A |
Variable B |
Interaction AB |
Diameter (nm) |
Potential (mV) |
1 |
3 |
- |
- |
+ |
69,92 |
-0,55 |
2 |
4 |
+ |
- |
- |
66,93 |
-3,59 |
3 |
2 |
- |
+ |
- |
78,96 |
-1,10 |
4 |
1 |
+ |
+ |
+ |
69,35 |
-9,00 |
Table 3. Effects for each variable (A, B) and their interaction (AB) for diameter and zeta potential. It is the medium values variable for each response element. * Refers to the effects considered significant by the Cuthbert Daniel method.
Variable |
Effect in diameter (nm) |
Effect in ζ potential (mV) |
A |
-6,35 |
-5,466* |
B |
5,78 |
-2,976* |
AB |
-3,26* |
-2,429* |
I |
71,26 |
-3,559 |
After the synthesis optimization, the nanoparticles were verified by scanning electron microscopy (SEM). Both G1-NPs, empty nanoparticles functionalized with T-80 (NP(+T80)) and without T-80 (NP(-T80)) were compared using this method (Figure 3). NPs(-T80) reveal to be smaller and more positively charged than those functionalized with the surfactant. The G-1 entrapment did not seem to alter either size or zeta potential distribution of these optimized nanoparticles. Nonetheless, the T-80 makes the aggregation rather incipient after the fixation procedure for SEM, as it can be verified in the images.
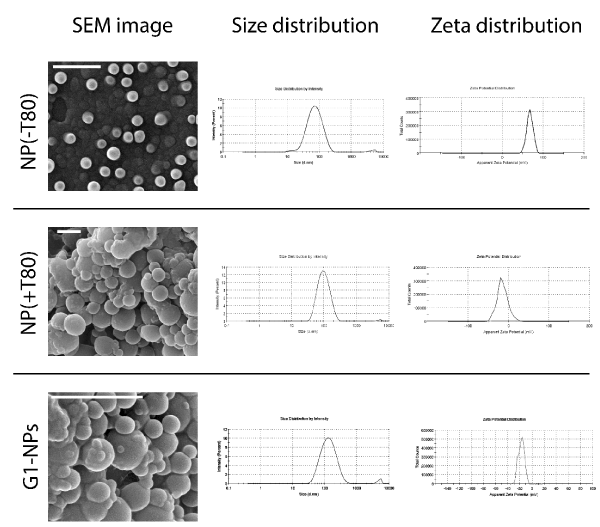
Figure 3.Comparison of empty NPs with or without being functionalized with T-80; and G1-NPs regarding their SEM morphology, size and ζ potential distributions. The scale bar refers to a real size of 1 µm.
Immunoliposome characterization and optimization
LP synthesis was optimized on the lipid film formation, sonication and post-sonication (centrifugation and filtration) steps. It was also availed which kind of PC would be a better choice for this nanocarrier. Firstly, we investigated the liposome formation kinetics, in which both DPPC- and DOPC-containing liposomes (DPPC-LPs and DOPC-LPs respectively) were sonicated for 30 s pulses between measurements (Figure 4). The different LPs do present distinct formation curves. It can be stablished that six 30 s pulses are sufficient to form DPPC-LPs. In contrast only three 30 s pulses would be enough to form the DOPC-LPs. The PCs did influence the liposomes sizes during sonication (F(1, 16) = 54,585, p = 0,0001) and how early this vesicles sizes are achieved over time (F(7, 16) = 82,340, p = 0,0001). The PDI profile over time is also largely distinct from both treatments (F(7, 16) = 7,9259, p = 0,0003). It is, therefore, clear that DOPC-LPs can be formed in less time and with smaller sizes than DPPC-LPs.
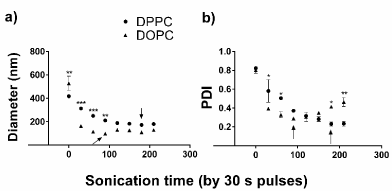
Figure4.DPPC-LPs and DOPC-LPs formation curves. Measurements of the vesicles (a) size and (b) PDI were taken. The arrows indicate in which time the size or PDI were considered optimum. The tests were conducted in duplicate (some of the errors are rather small in this scale). The two-way ANOVA with the multiple comparisons by the Holm-Šídák test were used to find statistical significance when comparing the PCs. *p < 0.05; **p < 0.01; ***p < 0.001 by each PC-time comparison.
Two different lipid film formation techniques were compared: one involving vacuum, and another in which constant agitation over time and fixed temperature were used to evaporate chloroform. Measurements of DPPC-LPs diameter, PDI and ζ potential were taken during consecutive synthesis steps (Figure 5). It was possible to verify that the different lipid film formation techniques did not differ from one another either by verifying the liposomes diameter (F(1, 18) = 0,0551, p = 0,8170), PDI (F(1, 18) = 1,5617, p = 0,2274) or the ζ potential (F(1, 18) = 0,1267, p = 0,7260). Yet, some steps did affect these parameters, such as filtration on the PDI or the vigorous centrifugation (1 h, 21,000 g, 4 °C) on the ζ potential. We had strong belief that this centrifugation might be affecting the vesicles integrity, so it was decided that this synthesis step would be modified. Moreover, although filtration would affect positively the PDI, it was of our conception that the G-1 loading would be heavily impaired by it, therefore we removed this step from the synthesis as well. The future LP confection would be submitted by the thermal agitation procedure for lipid film formation, as there was no difference between treatments.

Figure 5.Analysis of different lipid film formation techniques om DPPC-LPs (a) diameter, (b) PDI and (c) ζ potential. The sample size is four and statistical analysis was done with the two-way ANOVA followed by the multiple comparisons Holm-Šídák test. *p < 0.05 when comparing the same post-sonication treatment group.
The centrifugation step was further investigated and we compared both DPPC-LPs and DOPC-LPs in a considerably less vigorous centrifugation (10 min, 5,000 rpm, 25 °C) (Figure 6). It was of our intent to remove in this step titanium dioxide particles, which are known to be genotoxic and pro-inflammatory[36]. Only DPPC-LPs revealed a PDI decrease after centrifugation (p = 0,0029). On the other hand, DOPC-LPs did reveal a significant change of their ζ potential (p = 0,0396) after being centrifuged.
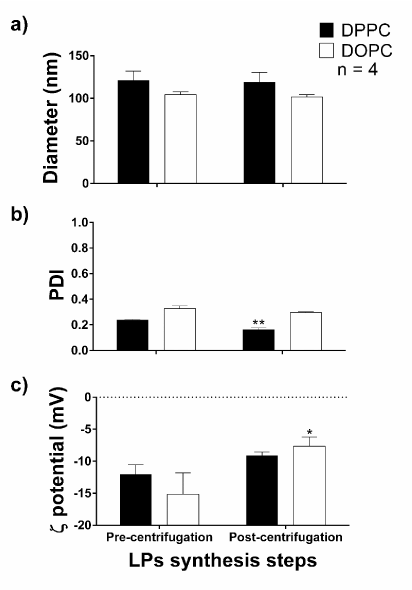
Figure6. Comparison between DPPC-LPs and DOPC-LPs after a less vigorous centrifugation. Measurements of the liposomes regarded their (a) diameter, (b) PDI and (c) ζ potential. The sample size is four and statistical analysis was done with the two-way ANOVA with the multiple comparisons by the Holm-Šídák test. *p < 0.05; **p < 0.01 when comparing the same PC.
Cytotoxic profile of the optimized nanocarriers
NPs and LPs cytotoxic profiles were first verified on Neuro-2a cells (Figure 7). We tested the cytotoxic profile of NPs in SHSY5Y also (Figure 8) and verified them to be more resistant to the carrier presence. Therefore, we did not investigate the profile of LPs in this cell line, which already did not reveal a cell damaging profile in Neuro-2a.

Figure7. Cytotoxic profile of (a) NPs and (b) LPs and a (c) comparison of the profiles with the positive control in 24 h time (Triton X-100 9% in PBS) in N2a cells. The graphs show both experimental points and pharmacological profile adjustments when possible. The sample size was six (n = 6). Carriers were applied for either 15 h or 24 h. Statistical analysis was performed by two-way ANOVA and multiple comparisons by the Holm-Šídák test. *** p < 0.001; **** p < 0.0001 in relation to the highest concentration of each time period.
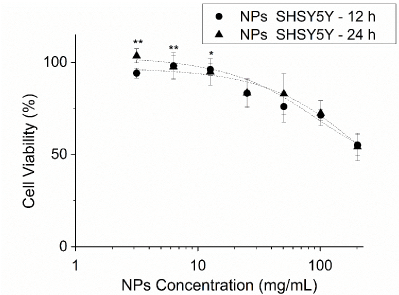
Figure8.Cytotoxic profile of nanoparticles in SHSY5Y cells. The graphs show both experimental points and pharmacological profile adjustments. The sample size was six (n = 6). Carriers were applied for either 12 h or 24 h. Statistical analysis was performed by two-way ANOVA and multiple comparisons by Holm-Šídák test. ** p < 0,01; *p < 0,05 in relation to the highest concentration of each time period.
From the non-linear regressions, we were able to obtain the half maximal inhibitory concentration (IC50) of the pharmacological models from NPs and Triton X-100 profiles in the N2a experiments (Table 4). LPs did not reveal a cytotoxic profile and the viability of SHSY5Y cells with the maximum concentration of nanoparticles was still too high to calculate this parameter.
Table 4. Pharmacological model adjustment for the cytotoxic profiles of NPs and Triton X-100 9% in PBS.
Model |
IC50 (mg/mL) |
R2adj. |
p |
NPs – 15 h |
19,46 |
0,9613 |
0,0003 |
NPs – 24 h |
15,82 |
0,9698 |
0,0008 |
Triton 24 h |
0,129 |
0,9416 |
0,0022 |
Intracellular delivery of FITC by the optimized nanocarriers
FITC-LPs and FITC-NPs were incubated with N2a and SHSY5Y cells. The first internalization experiments were performed in N2a for the periods of 24 h and 6 h (Supplementary material). Although FITC-LPs were identified both for 24 h and 6 h, FITC-NPs were only verified when incubating these nanocarriers for 24 h in N2a. We also tested both nanocarriers in SHSY5Y cells, as shown in Figure 9 – Figure 11. The synthesized FITC-LPs are promptly internalized (in less than 30 minutes), opposed to what happens with the FITC-NPs, which clearly reveal a slower kinetic profile (internalization in more than 6 h, less than 12 h). It is also possible to observe that FITC-containing cells in the 30-minute timeframe is more pronounced when FITC-LPs were used instead of a 20 µg/mL solution of FITC.
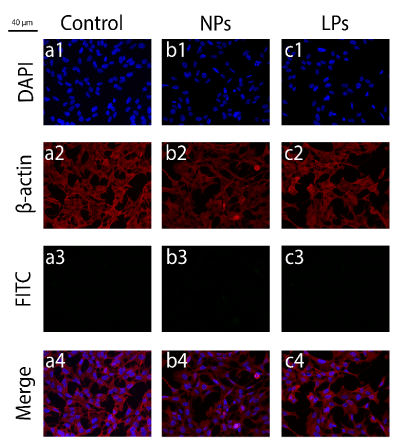
Figure9.Immunofluorescence images for the internalization experiments regarding FITC-LPs and FITC-NPs, in which only the controls are shown. The frames numbered from 1-4 denote DAPI (1), β-actin (2), FITC (3) and the merge (4). In (a) nanocarriers were not applied, in (b) empty LPs were incubated and in (c) empty NPs. This experiment was performed in SHSY5Y cells.
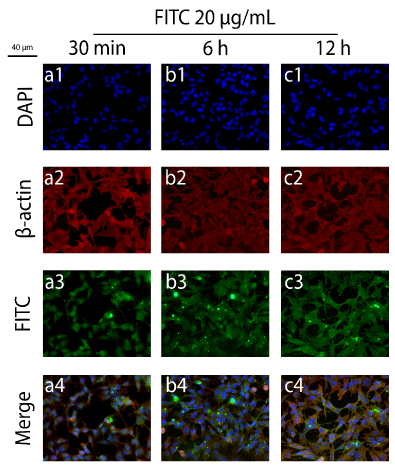
Figure 10.Immunofluorescence images for the internalization experiments regarding FITC-LPs and FITC-NPs, in which only a solution of FITC (20 µg/mL) was applied as a control. The frames numbered from 1-4 denote DAPI (1), β-actin (2) and FITC (3) and merge (4). The fluorescent particles were incubated for 30 min in (a), 6 h in (b) and 12 h in (c) with SHSY5Y cells.
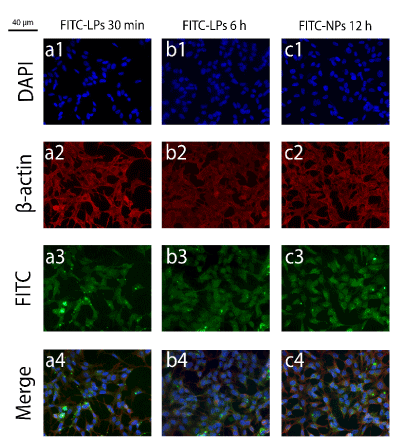
Figure 11.Immunofluorescence images for the internalization experiments regarding FITC-LPs and FITC-NPs, in which fluorophore-containing carriers were applied. The frames numbered from 1-4 denote DAPI (1), β-actin (2), FITC (3) and merge (4). FITC-LPs was applied for 30 min in (a) and for 6 h in (b); and FITC-NPs were incubated for 12 h in (c), both in SHSY5Y cells.
G1-NPs and G1-LPs: encapsulation efficiency and physical properties
From the data collected (Table 5), G1-LPs showed a greater encapsulation efficiency then G1-NPs. In this case, we tried different initial drug masses for loading, in order to equalize the final drug mass in both systems, taking into account the encapsulation efficiency. Additionally, G1-LPs revealed to encapsulate in such amount, that we could not quantify one of our replicates. The physical properties, such as diameter, PDI and ζ potential of the G1-loaded carriers were also compared with the empty ones (Figure 12). G1-LPs did not differ from empty LPs in none of the investigated physical properties. G1-NPs are also similar to empty NPs in term of particles size and PDI. Nevertheless, G1-NPs possess a more negative ζ potential.
Table 5. Encapsulation efficiency of G1-NPs and G1-LPs.
Nanocarrier |
Initial drug mass (µg) |
Encapsulation efficiency (%) |
n |
G1-NPs |
2,0 |
41,45 ± 4,05 |
6 |
G1-LPs |
1,0 |
97,17 ± 2,84a |
2 |
aOne of the replicates resulted a value below the quantification limit of our method, and the encapsulation efficiency was therefore considered to be 100%.
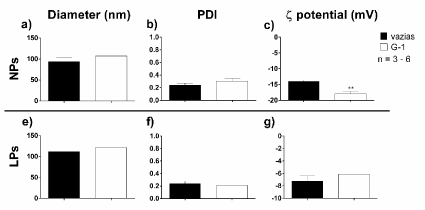
Figure12.Comparison of the physical properties of G1-loaded nanocarriers (T-80-coated polymeric nanoparticles and anti-transferrin labelled immunoliposomes) with the empty ones. (a) Diameter, (b) PDI and (c) ζ potential of G1-NPs were compared with empty NPs, and the same properties were also availed with G1-LPs and empty LPs (d-f). The sample size varies from 3 to 6 and the statistical analysis was performed with unpaired Student t-tests. **p < 0.01.
Discussion
We optimized the synthesis of T-80-coated polymeric nanoparticles and anti-transferrin functionalized liposomes in order to encapsulate the GPER-1 selective agonist – G-1.
Regarding NPs synthesis, different sonication regimes do affect the ζ potential profile of the NPs during the synthesis steps. The sonication time can result on surface modifications due to the fact that, regarding the physical procedure of sonicating, there is a chemical alteration at the particles surface. Not only does sonication promote rupture of aggregates, but it is also involves oxidation and hydroxylation of moieties in the carrier structural component[37]. During the synthesis, the diameter of the NPs was slightly increased, which was expected due to the two centrifugation steps, both of which can result in particle aggregation. The ζ potential has a clear inversion, especially when comparing the aqueous resuspension with the T-80 resuspension. The quaternary ammonium salts are highly cationic and the potential inversion could be a reflection of the T-80 adsorption, a surfactant with neutral characteristics[38]. The synthesis of NPs showed a slightly negative ζ potential, which was previously verified in both PLGA and poly(butylcyanoacrylate) (PBCA) nanoparticles[39,40]. It is, thus, reckoned that this fact can result on different adsorption efficiency of T-80. Moreover, although different surfactants (DMAB or DDAB) did not influence NPs physical properties, it is believed that due to the greater lipophilicity of DMAB, this surfactant can promote a better emulsification process for the formation of the polymeric condensate[41]. We could only verify small tendencies of improved PDI and ζ potential for this surfactant group. The 2² factorial test was performed for improving the nanoparticles profile during the T-80 adsorption step. It was noted that a reduced T-80 resuspension volume and a bigger magnetic stirrer could result on smaller and more stable NPs. Although the context of factor-level [A(-); B(+)] was chosen, one may enquire why the B(+) level was opted, as it would not benefit the ζ potential of the NPs. Firstly, the [A(-); B(+)] context is associated with the AB(-) level, which affects positively the size and ζ potential of the NPs. Lastly, the A(-) level has a greater impact on the ζ potential than the B(-) level. Non-ionic surfactants, such as T-80, are adsorbed to a surface through physical adsorption, in which van der Waals interactions, not electrostatic interactions, exist between the adsorbent-adsorbate[42]. Differently from ionic surfactants, non-ionic surfactant adsorption is greatly affected by concentration, temperature or molecular structure alterations, either by adsorbate-adsorbate or adsorbate-solvent interaction[43]. It is of our belief that either changes in the surfactant volume or the manner in which agitation occurred could have altered the manner the surfactant effectively associated to the NPs. The SEM images revealed that NP(-T80) are smaller than NP(+T80), which also tend to aggregate when preparing the coverslips for SEM imaging, alike the G1-NPs. The highly cationic ζ potential of NP(-T80) would possibly explain why those maintain their stability after the fixation procedure. During this procedure, the supernatant volume is left evaporating, in order for particles to sediment onto the coverslips. It is known that the dispersant volume reduction can contribute to the formation of aggregates, as it elevates particle’s concentration[44].
LP synthesis optimization was firstly regarded for the sonication step, in which DPPC-LPs and DOPC-LPs were compared. DPPC-LPs reach a size plateau after six 30 s sonication pulses, opposed to what happens to DOPC-LPs, whose plateau is formed twice as early. The transition temperature (Tm) of the PCs may explain this difference. The sonication process promotes a temperature raise and its efficiency is increased when lipids are above their transition temperature. DOPC (Tm,DOPC = -22 °C) has a much lower transition temperature than DPPC (Tm,DPPC = 41 °C), a fact that may make it possible for DOPC-LPs to reach it most stable conformation more rapidly[45]. The sonication may also cause vesicle coagulation, which can be verified in DOPC-LPs PDI curve after further sonication[46]. Therefore, in the case of DOPC-LPs, a fixed number of sonication pulses dictate both the optimum LP size and PDI. We also tested different lipid film formation techniques, and neither using the rotatory vacuum evaporation, nor the gradual evaporation did the liposomes show different physical properties. We also investigated if the filtration with a 0.45 µm pore syringe filter or a vigorous centrifugation could benefit the obtained vesicles. It was expected that filtration would reduce liposome PDI. Yet, the vigorous centrifugation revealed to alter the liposomes stability. It is known that if a colloidal mixture is submitted to an elevated centrifugal force, the dispersed elements may have their electric double layer polarized, promoting the formation of stable aggregates[47]. On the other hand, a less vigorous centrifugation revealed to reduce the stability of DOPC-LPs, contrary do DPPC-LPs. DOPC-LPs are more fluid at room temperature due to the PC inferior Tm, which can facilitate the vesicle agglomeration. DPPC-LPs, in contrast, are more rigid at the same temperature and did not reveal to agglomerate in this procedure. However, the titanium dioxide and aggregates of greater size precipitate in both cases. This would be the reaspm why DOPC-LPs’ PDI do not change while the PDI of DPPC-LPs reduces[48]. Although DOPC-LPs happen to be less stable, we believe that, due to their smaller size, this nanocarriers may be more suitable for eventual CNS applications.
Regarding the cytotoxicity of the nanocarriers, time was not associated with nanoparticles cytotoxic profile. It needs to be stated that NPs without T-80 have low cytotoxicity. Semete and colleagues investigated HeLa and Caco-2 cell viability after the administration of 1, 10 and 100 µg/mL of PLGA NPs, yet they could not determine the IC50[13] (Semete et al. 2010). We were able to obtain a cytotoxic profile of NP(+T80) in N2a, but not in SHSY5Y cells. NP(+T80) do not seem to be cytotoxic in concentrations below 324 µg/mL in N2a. Arechebala and colleagues did obtain the IC50 for polyssorbate-80 in fibroblasts, 210,0 ± 15,0 µg/mL, a value more than 100 times smaller than the ones we obtained for NP(+T80), indicating that the functionalized nanoparticles are clearly less cytotoxic than the pure surfactant[49]. SHSY5Y cells were less susceptible to NP(+T80) and the IC50 could not be determined. These cells reveal to be completely viable with 12,7 mg/mL of NP(+T80), a value ~39 times greater than the N2a case. LPs did not reveal any cytotoxic profile in N2a cells and, as SHSY5Y were less damaged by NP(+T80), the viability test of SHSY5Y with LPs was not performed. We already expected absence of cytotoxicity in LPs, due to their high biocompatibility and biodegradability[50].
Then, the internalization kinetics experiments were conducted. Firstly, a series of test in N2a cells were performed (Supplemental material), in which it was possible to verify that both nanocarriers content (FITC) could be seen within neurons in 24 h. In 6 h, only when the delivery was performed by FITC-LPs, but not by FITC-NPs, the fluorescent content would be internalized. We lastly executed the experiment in SHSY5Y cells, in which FITC-LPs could internalize FITC both in 30 min and 6 h, and FITC-NPs in 12 h. It is, therefore, clear that the optimized LPs do possess a faster internalization kinetics opposed to our optimized NPs. It was previously verified that PLGA NPs do possess a slower internalization kinetics until 24 h in MC3T3-E1 cells [51]. Sterically stabilized liposomes, on the other hand, would have an erratic internalization kinetic in cell culture, as for example 7 minutes in B16-F10 cells[52]. Liposome great biosimilarity and cell membrane elements compatibility might explain this fact when in direct contact with cells[53].
Lastly, we encapsulated G-1 and verified the encapsulation efficiency and the G1-NPs and G1-LPs physical properties. It is noticeable that LPs do have the tendency to encapsulate G-1 with high efficiency in contrast to NP(+T80). G1 is a lipophilic compound, having a 100 mM solubility in dimethyl sulfoxide (DMSO)[54]. Liposomes do encapsulate efficiently water insoluble drugs, especially when containing cholesterol in its composition[55]. NPs, on the other hand, can vary its entrapment efficiency according to the used polymer. We believe that an interaction between PLGA and the drug may have influenced the intermediate entrapment obtained[56]. Nonetheless, when altering the initial drug content of the formulation, the encapsulation efficiency was maintained, thus making it possible to equalize the concentration of G-1 both in G1-NPs and G1-LPs.
Conclusion
We describe G-1-loaded nanocarriers optimized synthesis methods, focusing on central nervous system derived cells applications. We take this opportunity to compare different nanocarriers: the polymeric nanoparticles and immunoliposomes. It is evident that each kind of nanocarrier possess its particularity, such as cytotoxicity, internalization kinetics or encapsulation efficiency. Nevertheless, what may be the application of these G-1-loaded nanocarriers will truly dictate which carrier is more appropriate for each application.
Conflict of interest
The author report no conflict of interest on the content presented in this article.
Acknowledgements
The author expresses their gratitude to Professor Andrea da Silva Torrão (PhD), Professor Carolina Munhoz (PhD), Professor Luciana Biagini Lopes (PhD), Professor Dielly Catrina Lopes (PhD), Dr. Wesley LuzettiFotoran (PhD), Vanessa Marcelo Carvalho Franco (M.S.) and DaianaAparecida da Silva (M.S.) for supporting the development of this work.
Funding
The development of this work was supported by Fundação de Amparo à Pesquisa do Estado de São Paulo (FAPESP: 2012/24727-4 and 2013/16617-7) and Coordenação de Aperfeiçoamento de Pessoal de Nível Superior (CAPES).
References
- FDA (2014) Guidance for Industry Considering Whether and FDA-Regulated Product Involves the Application of Nanotechnology. U.S. Departmanet of Health and Human Services - Food and Drug Administration Office of the Commissioner.
- Park K (2007) Nanotechnology: What it can do for drug delivery.J Control Release120:1-3. [Crossref]
- Bitounis D, Fanciullino R, Iliadis A, Ciccolini J (2012) Optimizing Druggability through Liposomal Formulations: New Approaches to an Old Concept ISRN Pharmaceutics.
- Campos PRF (2013) Liposomes and nanotechnology in drug development: focus on neurological targets.Int J Nanomedicine8:951-960.[Crossref]
- Schnyder A, Huwyler J (2005) Drug Transport to Brain with Targeted Liposomes.NeuroRx 2:99-107.[Crossref]
- Allen TM (1994) Long-circulating (sterically stabilized) liposomes for targeted drug delivery Trends in Pharmacological Sciences 15:215-220.
- Allen TM, Chonn A (1987) Large unilamellar liposomes with low uptake into the reticuloendothelial system FEBS Letters 223:42-46.
- Papahadjopoulos D, Allen TM, Gabizon A, Mayhew E, MatthayK, et al. (1991) Sterically stabilized liposomes: improvements in pharmacokinetics and antitumor therapeutic efficacy. Proc Natl Acad Sci U S A 88:11460-11464. [Crossref]
- Pardridge WM (2005) The Blood-Brain Barrier Bottleneck in Brain drug development.NeuroRx2:3-14. [Crossref]
- Wu D,Yang J,Pardridge WM (1997) Drug targeting of a peptide radiopharmaceutical through the primate blood-brain barrier in vivo with a monoclonal antibody to the human insulin receptor.J Clin Invest 100:1804-1812.[Crossref]
- Attwood SJ, Choi Y, Leonenko Z (2013) Preparation of DOPC and DPPC Supported Planar Lipid Bilayers for Atomic Force Microscopy and Atomic Force Spectroscopy.International journal of molecular sciences14:3514-3539.[Crossref]
- Lu JM, Wang X, Marin-Muller C, Wang H, Lin PH, et al. (2009) Current advances in research and clinical applications of PLGA-based nanotechnology Expert review of molecular diagnostics 9:325-341. [Crossref]
- Semete B, Booysen L, Lemmer Y, Kalombo L, Katata L, et al. (2010) In vivo evaluation of the biodistribution and safety of PLGA nanoparticles as drug delivery systems.Nanomedicine 6:662-671.[Crossref]
- Panyam J, Labhasetwar V (2003) Biodegradable nanoparticles for drug and gene delivery to cells and tissue. Adv Drug Deliv Rev 55: 329-347.[Crossref]
- Jain RA (2000) The manufacturing techniques of various drug loaded biodegradable poly(lactide-co-glycolide) (PLGA) devices Biomaterials 21:2475-2490.
- Sahoo SK, Panyam J, Prabha S, Labhasetwar V (2002) Residual polyvinyl alcohol associated with poly (D,L-lactide-co-glycolide) nanoparticles affects their physical properties and cellular uptake.Journal of Controlled Release82:105-114.
- Gossmann R, Langer K, Mulac D (2015) New Perspective in the Formulation and Characterization of Didodecyldimethylammonium Bromide (DMAB) Stabilized Poly(Lactic-co-Glycolic Acid) (PLGA) Nanoparticles.PLoS One10:e0127532. [Crossref]
- Kuo YC, Yu HW (2011) Surface coverage of didecyl dimethylammonium bromide on poly(lactide-co-glycolide) nanoparticles Colloids and surfaces B, Biointerfaces 84:253-258.
- Ramge PU, Oltrogge RE, Zenker JB, Begley D,Kreuter J, et al. (2000) Polysorbate-80 coating enhances uptake of polybutylcyanoacrylate (PBCA)-nanoparticles by human and bovine primary brain capillary endothelial cells.European Journal of Neuroscience12:1931-1940.
- Tahara K, Yamamoto H, Kawashima Y (2010) Cellular uptake mechanisms and intracellular distributions of polysorbate 80-modified poly (D,L-lactide-co-glycolide) nanospheres for gene delivery European journal of pharmaceutics and biopharmaceutics : official journalof Arbeitsgemeinschaft fur PharmazeutischeVerfahrenstechnik eV 75:218-224.
- Bologa CG (2006) Virtual and biomolecular screening converge on a selective agonist for GPR30 Nature Chemical Biology 2:207-212.
- Srivastava DP, Waters EM, Mermelstein PG, Kramár EA, Shors TJ, et al. (2011) Rapid EstrogenSignaling in the Brain: Implications for the Fine-Tuning of Neuronal Circuitry.J Neurosci31:16056-16063.[Crossref]
- Petrone AB, Gatson JW, Simpkins JW, Reed MN (2014) Non-feminizing estrogens: A novel neuroprotective therapy.Mol Cell Endocrinol 389:40-47.[Crossref]
- Ervin KSJ, Mulvale E, Gallagher N, Roussel V, Choleris E (2015) Activation of the G protein-coupled estrogen receptor, but not estrogen receptor a or ß, rapidly enhances social learning.Psychoneuroendocrinology 58:51-66.[Crossref]
- Gabor C, Lymer J, Phan A, Choleris E (2015) Rapid effects of the G-protein coupled oestrogen receptor (GPER) on learning and dorsal hippocampus dendritic spines in female mice. PhysiolBehav149: 53-60.[Crossref]
- Liu SB, Tian Z, Guo YY, Zhang N, Feng B, et al. (2015) Activation of GPR30 attenuates chronic pain-related anxiety in ovariectomized mice. Psychoneuroendocrinology53: 94-107.[Crossref]
- Tian Z, Wang Y, Zhang N, Guo YY, Feng B, et al. (2013) Estrogen receptor GPR30 exerts anxiolytic effects by maintaining the balance between GABAergic and glutamatergic transmission in the basolateral amygdala of ovariectomized mice after stress. Psychoneuroendocrinology 38:2218-2233.[Crossref]
- Chimento A, SirianniR, Casaburi I, Zolea F, Rizza P, et al. (2015) GPER agonist G-1 decreases adrenocortical carcinoma (ACC) cell growth in vitro and in vivo.Oncotarget6: 19190-19203.
- Wei W, Chen ZJ, Zhang KS, Yang XL, Wu YM, et al. (2014) The activation of G protein-coupled receptor 30 (GPR30) inhibits proliferation of estrogen receptor-negative breast cancer cells in vitro and in vivo. Cell Death Dis 5: e1428.[Crossref]
- Zhang Q, Wu YZ, Zhang YM, Ji XH, Hao Q (2015) Activation of G-protein coupled estrogen receptor inhibits the proliferation of cervical cancer cells via sustained activation of ERK1/2 Cell Biochemistry and Function 33:134-142.
- Brunsing R, Owens KS, Prossnitz ER (2013) The G protein-coupled estrogen receptor (GPER) agonist G-1 expands the regulatory T-cell population under TH17-polarizing conditions.J Immunother36:190-196.[Crossref]
- Itoga M, Konno Y, Moritoki Y, Saito Y, Ito W et al. (2015) G-protein-coupled estrogen receptor agonist suppresses airway inflammation in a mouse model of asthma through IL-10.PLoS One10: e0123210.[Crossref]
- Rodrigues JRdS NB, Munhoz CD (2015) Participação do GPER namodulaçãoastrocitárianavigência de estímulosinflamatórios in vitro similaresaospresentesnaEscleroseMúltipla. 2015 IBRO.
- Bourque M, Morissette M, Di Paolo T (2015) Neuroprotection in Parkinsonian-treated mice via estrogen receptor α activation requires G protein-coupled estrogen receptor 1.Neuropharmacology 95:343-352.[Crossref]
- Lopes DCF (2014) Participação do receptor GPER-1 naneuroproteçãomediadaporestrógenoemmodelo de isquemiaporprivação de glicose/oxigênioemcélulascorticaiscerebrais. São Paulo.
- Skocaj M, Filipic M, Petkovic J, Novak S (2011) Titanium dioxide in our everyday life; is it safe? Radiol Oncol 45: 227-247.[Crossref]
- Taurozzi JS, Hackley VA, Wiesner MR (2011) Ultrasonic dispersion of nanoparticles for environmental, health and safety assessment--issues and recommendations.Nanotoxicology 5:711-729.[Crossref]
- Bhardwaj V, Ankola DD, Gupta SC, Schneider M, Lehr CM, et al. (2009) PLGA nanoparticles stabilized with cationic surfactant: safety studies and application in oral delivery of paclitaxel to treat chemical-induced breast cancer in rat Pharmaceutical research 26:2495-2503. [Crossref]
- Girotra P, Singh SK (2016) A Comparative Study of Orally Delivered PBCA and ApoE Coupled BSA Nanoparticles for Brain Targeting of Sumatriptan Succinate in Therapeutic Management of Migraine Pharmaceutical research 33:1682-1695.
- Miyazawa T, Nakagawa K, Harigae T, Onuma R, Kimura F, et al. (2015) Distribution of beta-carotene-encapsulated polysorbate 80-coated poly(D, L-lactide-co-glycolide) nanoparticles in rodent tissues following intravenous administration. Int J Nanomedicine10:7223-7230.[Crossref]
- Cooper DL, Harirforoosh S (2014) Design and optimization of PLGA-based diclofenac loaded nanoparticles. PLoS One9: e87326.[Crossref]
- Santhanalakshmi J, Balaji S (1996) Adsorption Studies of Nonionic Surfactants on Charcoal and Alumina in Aromatic Solvents.Journal of colloid and interface science179:517-521.
- Paria S, Khilar KC (2004) A review on experimental studies of surfactant adsorption at the hydrophilic solid-water interface Advances in colloid and interface science 110:75-95. [Crossref]
- Smoluchowski M (1917) Mathematical theory of the kinetics of the coagulation ZeitschriftfürphysikalischeChemie 92:129.
- Szoka F Jr, Papahadjopoulos D (1980) Comparative properties and methods of preparation of lipid vesicles (liposomes) Annual review of biophysics and bioengineering 9:467-508.
- Aoki MR,Haggerty JS (1987) Analysis and modeling of the ultrasonic dispersion technique Adv Ceram Mater 2:209-212.
- Roca M, Pandya NH, Nath S, Haes AJ (2010) Linear assembly of gold nanoparticle clusters via centrifugation. Langmuir26: 2035-2041.[Crossref]
- Yadav AMMS,SHete AS,Sfurti S (2011) Stability Aspects of Liposomes Indian.Journal of Pharmaceutical Education and Research 45:402-413.
- Arechabala B, Coiffard C, Rivalland P, Coiffard LJ, de Roeck-Holtzhauer Y (1999) Comparison of cytotoxicity of various surfactants tested on normal human fibroblast cultures using the neutral red test. MTT assay and LDH release Journal of applied toxicology: JAT19:163-165
- Bozzuto G, Molinari A (2015) Liposomes as nanomedical devices. Int J Nanomedicine 10: 975-999.[Crossref]
- Wang H, Liu J, Tao S, Chai G, Wang J, et al. (2015) Tetracycline-grafted PLGA nanoparticles as bone-targeting drug delivery system.Int J Nanomedicine 10:5671-5685.[Crossref]
- Du R, Zhong T, Zhang WQ, Song P, Song WD, et al. (2014) Antitumor effect of iRGD-modified liposomes containing conjugated linoleic acid-paclitaxel (CLA-PTX) on B16-F10 melanoma.Int J Nanomedicine9:3091-3105. [Crossref]
- Sandra A, Pagano RE (1979) Liposome-cell interactions. Studies of lipid transfer using isotopically asymmetric vesicles. The Journal of biological chemistry254:2244-2249.
- Tocris (2016) G-1 Safety Data Sheet www.tocris.com
- Panwar P, Pandey B, Lakhera PC, Singh KP (2010) Preparation, characterization, and in vitro release study of albendazole-encapsulated nanosize liposomes.Int J Nanomedicine5:101-108.[Crossref]
- Wischke C, Schwendeman SP (2008) Principles of encapsulating hydrophobic drugs in PLA/PLGA microparticles. Int J Pharm364:298-327. [Crossref]


