Abstract
Lipidomics (a lipid-targeted metabolomics) aims at global analysis of lipids in biological systems. Recently, lipidomics research has received increased attention due to the well- recognized role of lipids in numerous human diseases. For instance, altered lipid pathways in the primary visual cortex and the anterior cingulate have been demonstrated in Parkinson’s disease (PD) by analyzing post-mortem tissues from patients in advanced neuronal degeneration stage. Such an approach, however, hinders the identification of the first neuronal changes. Skin fibroblasts have been recently proposed as a useful model of primary human cells, capable of reflecting the chronological and biological aging of the patients, according to their polygenic predisposition and environmental etiopathology. Here, hydrophilic interaction liquid chromatography coupled to electrospray ionization-Fourier- transform mass spectrometry was developed to characterize polar lipids occurring in human skin fibroblasts. Different lipid extraction protocols were tested, and Bligh Dyer strategy was selected as the most informative in terms of lipid extracted. Thus, single and tandem MS measurements were performed on a hybrid quadrupole-Orbitrap mass spectrometer for the characterization of fibroblast membrane lipids with the aim to apply this strategy for successive biomarker discover in PD patients.
Keywords
lipid extraction, HILIC, tandem MS, fibroblasts lipid biomarkers
Introduction
Lipids play multiple important roles being involved in energy pool, ensuring structural integrity of cellular membranes, regulation of membrane trafficking and signal transduction [1,2]. The study of the role of lipids has been complicated by their heterogeneity; they are so numerous in terms of fatty acyls and classes: glycerolipids, glycerophospholipids (GP), sphingolipids, sterol lipids, prenol lipids, saccharolipids and polyketides [3]. The number of theoretically possible structures is impressive also in view of the existence of double bond positional isomers, sn-positional isomers, different double bond stereochemistry and different chirality. Overall, mammalian cells may contain about 1000 to 2000 lipid species, not including oxidized or damaged lipids as well [4]. Lipidomics, a branch of metabolomics, aims at the full characterization of lipids in biological samples as fluids, tissues, cells with goals such as: (i) finding of specific biomarkers for risk and disease diagnosis on a large scale, (ii) elucidation of altered lipid pathways indicative of disease, environmental perturbations or response to diet, drugs and toxins as well as genetics [5]. The above mentioned structural diversity of lipids signifies a serious challenge in the field of analytical chemistry. Fortunately, recent advancements in mass spectrometry (MS) soft ionization methods, such as MALDI and ESI with related instrumentation have greatly facilitated lipidomics studies and their fall out in understanding complex lipid functions. ESI-MS, and especially its coupling with chromatographic separations, is the most widely used technique in lipidomics. The MS analysis of lipids in biological samples has provided abundant data for clinical clarifications of many diseases. For instance, it is nowadays clear that important neurological disorders involve dysregulation in lipid metabolism [6]. Parkinson's disease (PD) is a chronic, progressive neuropsychiatric disease which affects the dopaminergic nigrostriatal pathway [7,8]. PD patients begin to manifest primary symptoms when 50%-80% of the nigrostriatum has degenerated [9], resulting in late treatments and ineffective prognosis. Molecular studies on the genes responsible for familial PD including α-synuclein (PARK1), Parkin (PARK2), and PINK1 (PARK6) [10,11] showed a strong connection between PD and mitochondria, pointing out that mitochondrial dysfunctions and resulting oxidative cellular stress may be crucial to PD pathogenesis [12,13]. More recent accumulated evidences demonstrated that altered cerebral lipid homeostasis had a significant effect on neurodegenerative pathways in PD. Genetic deficit of α-synuclein in mice results in increased levels of neutral lipids like cholesterol, cholesteryl esters and triacylglycerols [14]; changes in phospholipids levels have been observed in old transgenic mice expressing human α-synuclein [15]. Other studies have suggested changes in cerebral cholesterol, oxysterols, and cholesterol hydroperoxides during PD progression [16] or substantial changes in sphingolipid and glycerophospholipid biosynthetic pathways in the visual cortex of PD patients [17].
Currently, direct evidence of these pathological processes can be obtained prevalently in postmortem brain tissues. Numerous studies have been carried out in peripheral cells as lymphomonocytes, platelets, red blood cells but results have been often contradictory and, in most cases, strongly biased by pharmacological treatments [18]. Fibroblasts share the same genetic complexity of neurons and can represent an easily available substrate to investigate PD mechanisms [19,20]. However, there are still some limitations about current methods and the development of novel methodology for better understanding of lipid molecular species is still a hot topic [21]. The goal of this study was, therefore, to develop a lipidomics study on primary dermal fibroblasts derived from healthy controls with the final aim to apply this strategy to Parkinson's disease patients to find early biomarkers associated with neurodegeneration in familial PD.
Materials and Methods
Chemicals
Water, acetonitrile, methanol, chloroform, formic acid, methyl-tert-butyl- ether (MTBE), and ammonium acetate were obtained from Sigma-Aldrich (Milan, Italy). Normal human dermal fibroblasts (NHDF) from adult persons were purchased from Carlo Erba (Milano, Italy). Standard lipids were purchased from Spectra 2000 SRL (Rome, Italy). All solvents used were LC-MS grade except for CHCl3 and MTBE (HPLC grade). Calibrating solution containing caffeine, methionine-arginine-phenylalanine-alanine peptide and Ultramark, a mixture of fluorinated phosphazines, for positive and negative calibrations were purchased from Thermo Scientific (Waltham, Massachusetts, United States).
Sample Preparation
Cell growth
Age-matched adult normal human dermal fibroblasts (NHDF) were used as healthy controls. The cells were washed in PBS (phosfate buffered saline) and then centrifuged at 500 × g for 4 min at 25°C. The pellet was resuspended in the culture medium for subsequent lipid extraction.
Lipid extraction
Because the efficiency of simultaneously extracting various categories of lipids differs among methods, four protocols described in the following, were tested on human fibroblasts.
- Bligh Dyer protocol: Following the Bligh &Dyer protocol [22], 3 mL of methanol/chloroform (2:1, v/v) were added to 50 µL of fibroblast (FB) sample homogenate diluted with 750 µL of water and the mixture was left one hour at room temperature. Then, 1 mL of chloroform was added, and the mixture was vortexed for 30 s. Finally, upon adding 1 mL of water the solution was shaken before being centrifuged for 10 min at 2000 rpm. The lower phase containing lipids was dried under nitrogen; the residue was dissolved in 50 µL of methanol and then analyzed by LC-MS.
- Methanol/chloroform/MTBE: Recently, Pellegrino et al. [23] proposed a one-phase extraction (OPE) method based on a mixture of methanol/chloroform/MTBE (MMC) in 1.33/1/1 (v/v/v) ratio for the extraction of lipid classes from human serum. Following this OPE protocol, 50 μL of FB sample homogenate were incubated with 1 mL of the solvents mixture, then vortexed, shaken for 20 minutes before being centrifuged for 5 min at 3000 rpm. The organic phase was collected, dried and resuspended in 50 µL of methanol and then analyzed by LC-MS.
- 2-methoxy-2-methylpropane (MBTE): Lipids were extracted according to 2-methoxy-2- methylpropane (also known as methyl-tert-butyl-ether, MTBE) protocol [24] by adding 200 µL of chloroform and 400 µL of methanol to 50 µL of FB sample and vortex mixing for 5 min. Afterwards, 200 µL of chloroform were added followed by vortex mixing for 30 s. Finally, 200 µL of water were added and the solution centrifuged for 5 min at 1000 rpm. The final biphasic system could separate into two layers and the lower phase was collected. The lipid extract was dried, and the residue was dissolved in 50 µL of methanol.
- Butan-1-ol (BuOH) extraction procedure: In this procedure proposed by Baker et al. [25], 50 µL of FB cell homogenate were diluted with 450 µL of water and mixed with 60 µL of buffer containing 200 mM citric acid and 270 mM disodium hydrogenphosphate (pH= 4). Extraction was performed with 1 mL of 1-butanol and 500 µL of water-saturated butan-1-ol. The recovered butanol phase was evaporated to dryness under reduced pressure. The residue was dissolved back in 50 µL of ethanol.
HILIC-ESI-MS instrumentation and operating conditions
HILIC-ESI-FTMS measurements were performed using an LC-MS apparatus consisting in an UHPLC system. Ultimate 3000 and a hybrid Q-Exactive mass spectrometer (Thermo Scientific, Waltham, MA, USA), equipped with a heated electrospray ionization (HESI) source and a higher collisional energy dissociation (HCD) cell for tandem MS analyses. Chromatographic separations were run at ambient temperature (22 ± 1°C) on a narrow-bore Ascentis Express HILIC column (150 × 2.1 mm ID, 2.7 μm particle size) equipped with an Ascentis Express HILIC (5 × 2.1 mm ID) security guard cartridge (Supelco, Bellefonte, PA, USA) using a flow rate of 0.3 mL min-1. A volume of 5 μL of FB lipid extract was injected into the column using a RS Autosampler (Thermo Scientific, Waltham, MA, USA). The adjusted binary elution program, based on water and 2.5 mmol l-1 (solvent A) and acetonitrile (solvent B), both containing 0.1% (v/v) of formic acid, was adopted: 0-5 min, linear gradient from 97 to 88% solvent B; 5-10 min, isocratic at 88% solvent B; 10-11 min, linear gradient from 88 to 81% solvent B; 11-20 min, linear gradient from 81 to 70% solvent B; 20-22 min, linear gradient from 70 to 50% solvent B; 22-28 isocratic at 50% solvent B; 28-30 min, return to the initial composition, followed by a 5 min equilibration time.
The column effluent was transferred into the qExactive spectrometer through the HESI source. The main ESI and ion optic parameters were the following: sheath gas flow rate, 35 (arbitrary units); auxiliary gas flow rate, 15 (arbitrary units); spray voltage, 3.5 kV (positive) and -2.5 kV in negative polarity; capillary temperature, 320°C; S-lens radio frequency level, 100 (arbitrary units). Negative and positive MS full-scan spectra were acquired in the m/z range 130-2000, after setting a mass resolving power of 140 000 (at m/z 200). During MS measurements, the Orbitrap fill time was set to 200 ms and the automatic gain control (AGC) level to 3 × 10⁶. The Q Exactive spectrometer was daily calibrated and mass accuracies ranged between 0.10 and 0.17 ppm in positive polarity and between 0.40 and 0.45 ppm in negative polarity.
To recover more structural information on lipid classes, additional MS acquisitions were concurrently performed adopting the so-called MS/AIF/NL dd-MS2 workflow implemented in the qExactive instrumentation. In this sequence, a high-resolution MS full scan is first performed, followed by an all ion fragmentation (AIF) scan, i.e., a scan of product ions generated in the HCD cell from all the ions coming from the HESI source. Spectra obtained from these two events are rapidly compared by software, and when a user-defined m/z neutral loss (NL) is found (tolerance 10 ppm), the corresponding precursor ion is subjected to data dependent MS/MS acquisition. AIF measurements were performed at 35% normalized collision energy (NCE) at a resolving power of 70000 (at m/z 200), using an Orbitrap fill time of 200 ms and setting the automatic gain control level to 3 × 10⁶. In some cases, the confirmation of lipid species individuated after elaborating MS/AIF/NL dd-MS2 data was obtained performing further LC-MS runs using targeted-MS2 acquisitions. In this modality, the m/z values of the selected precursor ions were introduced into an inclusion list, each with a tolerance of 10 ppm. MS/MS measurements were performed, in both positive and negative polarities, using a and a 1 m/z unit wide window, a resolving power of 70 000 (at m/z 200), a fill time of 100 ms and AGC of 2 × 10⁵. The control of the LC-MS instrumentation and the first processing of data were performed by the Xcalibur software, version 3.0.63 (Thermo Scientific). The post analyses data processing was performed by using SigmaPlot 11.0 to graph final mass spectra while ChemDraw Pro 8.0.3 (CambridgeSoft Corporation, Cambridge, MA, USA) was employed to draw chemical structures.
Results and Discussion
Standard PL Analysis by LC-ESI-MS/MS
The application of high performance liquid chromatography-mass spectrometry (HPLC–MS) in phospholipids (PLs) analysis by using normal phase (NP) or reverse phase chromatography (RPC) has been widely reported, though the results were not always directly comparable due to different experimental conditions employed. Generally, the mobile phases used for NPC such as chloroform or hexane lack compatibility with electrospray ionization (ESI) technique and are difficult to handle because of their toxicity and volatility [26]. Contrary, RPC guarantees the use of well compatible solvents even if the separation of lipids based on their lipophilicity (alkyl chain length and/or degree of saturation), does not show class distinction leading to very complex chromatograms. Due to the limitations of these methods a relatively novel hydrophilic liquid chromatography (HILIC) has been proposed for the separation of amphiphilic compounds such as phospholipids [27]. HILIC is considered a variant of NPC that uses a hydrophilic stationary phase and organic aqueous solvents as mobile phase to avoid the disadvantages of the NP mode, such as the toxicity and volatility of solvents. The presence of more than 80% acetonitrile in HILIC mobile phase, provides more efficient mobile phase desolvation and compound ionization improving the ESI analysis; moreover, a separation based on the lipid’s head group polarity simplifies the chromatograms of very complex samples. Different applications of HILIC in lipids analysis have been reported in various food or biological matrices [27–33].
In this study the separation method was developed using a fused-core HILIC narrow- bore (150 × 2.1 mm ID) column. The fused core columns offers a thin porous shell of high-purity silica neighbouring a solid silica core. This particle design displays high column efficiency due to the narrow diffusion paths in the 0.5-micron thick porous shell and the small total particle size of 2.7 microns. The addition of 2.5 mM/L ammonium acetate containing 0.1% formic acid to the mobile phase contributes to improve the ionization of PLs in ESI Ms. In the current study, the retention time window of diverse lipid classes was firstly stated by appropriate lipid standards. PLs with head groups of choline (PC), ethanolamine (PE), serine (PS), inositol (PI) and sphingomyelin (SM) were selected. Figure 1 shows the total ion chromatogram (TIC) of the mixture of seven lipids namely PI (16:0/16:0), PE (16:0/18;1), PS (16:0/16:0), PC (12:0/12:0), PC (18:0/18:1), SM (42:2) and LPC (18:1/0:0) obtained in negative (A) and positive (B) ion mode.
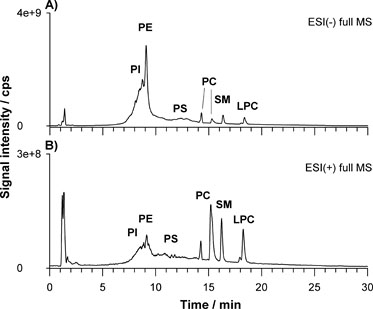
Figure 1. Total ion chromatogram (TIC) of the mixture of seven lipids namely PI (16:0/16:0), PE (16:0/18;1), PS (16:0/16:0), PC (12:0/12:0), PC (18:0/18:1), SM (42:2) and LPC (18:1/0:0) obtained in negative (A) and positive (B) ion mode.
Applying the gradient elution program described in the experimental section, the separation of each lipid class was achieved in approximately in 20 min. The elution order, reflecting the increasing polarity, is: PI, PE, PS, PC (36:1), PC (24:0), SM and LPC. As expected, since LPC have only one acyl chain with the other acyl chain replaced by a hydroxyl group in sn-1 or sn-2 position, it elutes as the last species being the most polar. It can be noted that the separation of PS remains challenging probably due to the complexity of its retention mechanism in HILIC originating from a combined effect of hydrophilic and electrostatic (ionic) interactions caused by the amino acid on the polar head. PS elutes as a broad band starting around 13 minutes and continuing until 25 minutes. It is likely that at the beginning of the gradient the charged PS species interacts more with weakly acidic ionized silanols of the bare silica. This interaction decreases during gradient due to the competing formate ions originating from the increasing ammonium formate in aqueous mobile phase (at 13 minutes water reached around 20%) making possible a partitioning between the layer of water on the surface and the bulk organic enriched mobile phase [34]. From the TIC profile it is also clear a separation in the PC subclass with elution order depending on the type of fatty acids esterified at the glycerol backbone. The comparison among the two ionization modalities highlights that PCs, SM and LPCs were detected more easily in positive ion mode while PE, PI and PS were ionized preferentially in negative ion mode. However, in our case, PCs, SMs and LPCs were also well detected in negative ion mode as formate ([M+HCOO]−), acetate ([M+CH3COO]−), or demethylated ([M-CH3]−) adducts. Indeed, a preliminary source-induced fragmentation (sid) was applied at 40 eV of collisional energy to enhance the generation of [M-CH3]− ions diagnostic of these PLs bearing a choline moiety in the polar head.
Comparison of lipid extraction protocols
The most broadly used protocols for lipid extraction are those of Folch et al. [35] and Bligh and Dyer [22] often in somewhat modified versions [36,37]. However, new alternative methods have been recently proposed with the main scope to reduce the use of toxic and carcinogenic halogenated solvents (e.g., chloroform). Granafei et al. [38] demonstrated that an extraction protocol based on MTBE (2- methoxy-2-methylpropane) provides similar recoveries to Bligh Dyer for all major lipid classes from fish brain tissue. The MTBE-based protocol has also been applied for PL study in plasma [24] and human occipital cortex [39]. However, MTBE could not be able to dissolve highly polar lipids and its low flash point requires additional attention for solvent handling [38]. Other two protocols based on butanol [25] or single phase MMC [23] were useful for the analysis of lipids in human plasma and serum showing a better extraction of phosphatidic acid (PA) or PG [25] or neutral lipids [23], respectively. We examined these four protocols on FB cells with the aim to understand which one can allow a more comprehensive extraction in terms of number of lipids using the previous optimized LC-ESI MS/MS. The FB cell homogenate sample was extracted in triplicate using each protocol (see experimental section) and Figure 2 summarizes TICs of FB lipid extract relevant to MTBE (A), BuOH (B), MMC (C) and BD (D) protocol. The elution order observed for PL classes reflects the separation attained using standard lipids being PI, PE, PS, PC and SM the main classes retrieved. A snapshot about the lipid composition of a given PL class can be obtained looking at the MS spectrum averaged over the entire HILIC band related to that class. Figure 3 reports the spectra relevant to PC (A) and SM (B) in positive ion mode, PI (C) and PE (D) in negative ion mode averaged under the chromatographic bands of BD extract. As can be seen, very similar results were obtained in the total number of extracted lipids comparing the four protocols. However, even if all the lipid species were retrieved under each spectrum significant differences were related to the presence of interfering compounds (overall for MMC protocol) not recognized as lipid species from the database search. The presence of co-eluting interfering peaks can represent a problem for a reliable quantification of specific compounds. A method to estimate the contribution of subspecies from different classes to the peak shape can be the calculation of tailing factor (TF). The TF values should normally fall between 1.0 and 1.5 for an optimized method [34]. We calculated TF for each protocol by using the eXtracted Ion Current (XIC) trace on the most abundant PC at 760.585 m/z (± 2.5 ppm) reported in Figure 4. The TF was obtained with the following formula: TF =?/2β where ? is the peak width at 5% peak height and β is the difference between the retention time at the beginning of the peak (at 5% peak height) and the retention time at the peak maximum. The value of TF was acceptable for MTBE (1.4) and BD (1.5) protocols while it was higher for BuOH (1.8) and MMC (2.1). However, MTBE protocol originates chromatograms with lower S/N ratio, so the BD protocol was selected for further extractions.
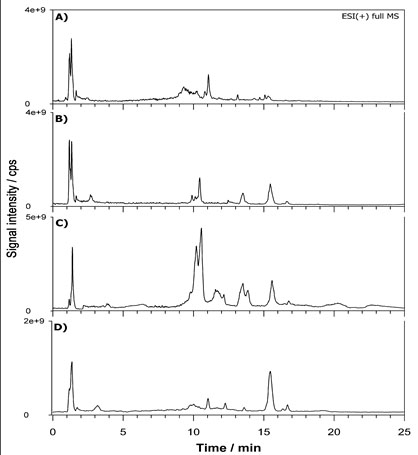
Figure 2. Total ion chromatograms (TICs) of fibroblast lipid extract relevant to MTBE (A), BuOH (B), MMC (C) and BD (D) protocol.
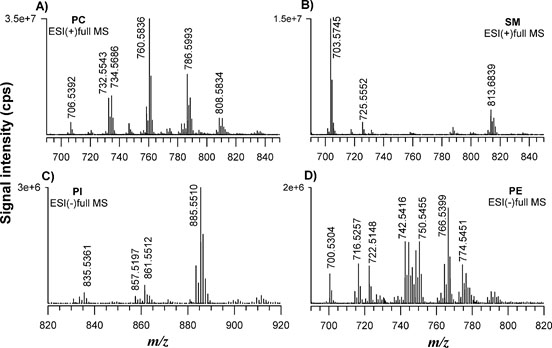
Figure 3. FTMS spectra relevant to PC (A) and SM (B) in positive ion mode, PI (C) and PE (D) in negative ion mode averaged under the chromatographic bands of Bligh Dyer extract.
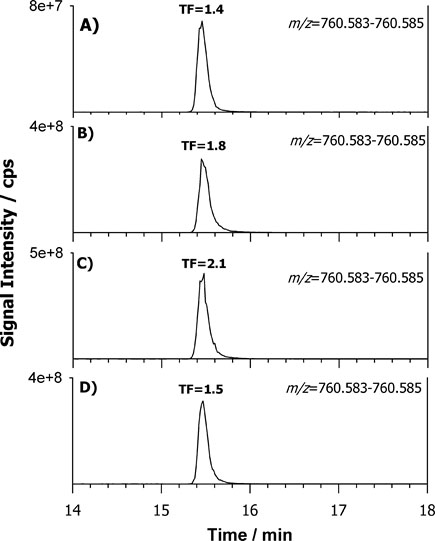
Figure 4. Extracted Ion Current (XIC) traces on the most abundant PC at 760.585 m/z (± 2.5 ppm) obtained by HILIC-ESI(−)-FTMS of the MTBE (A), BuOH (B), MMC (C) and BD (D) lipid extracts.
Characterization of lipid species in FB extract
The characterization of the lipid species detected under each band was carried out. Besides the accurate m/z value we utilized the already mentioned AIF signal acquisition approach, provided by FTMS instrumentation, that helped in the recognition of the main PL classes thanks to the generation of specific class- related product ions without the necessity to isolate and fragment certain precursor ions. By exploiting the high collisional energies provided by the HCD cell, the informative fragment ions generated from the head group were used to identify the lipid class of interest.
For example, the XIC obtained for the BD lipid extract using AIF acquisition is reported in Figure 5 for negative (A) and positive polarity (B). The first ion extracted at m/z 196.0375 (±0.0015) corresponds to the molecular formula [C5H11NO5P]− (structure reported in the inset of Figure 5A) related to a product ion obtained from PLs bearing a phosphoethanolamine head. The ion extracted at m/z 184.0733 (±0.0015) corresponds to the exclusive fragment of phosphocholine (structure reported in the inset of Figure 5B) belonging both to PC and SM. The extremely narrow window chosen led to the elimination of any interference due to contaminant ions. By following this approach 266 lipid species with various regiochemistry were identified from main lipid classes and molecular formulas are presented in Table 1. From the analysis of the spectra collected we noticed that very few lysoPLs (LPL) were retrieved. Usually these species can be clinically important potential biomarkers of pathology since they are mostly produced by the enzymatic reaction of phospholipases, involved in signalling mechanisms and in the pathway of disease development [40,41]. Therefore, the determination of LPLs can be of interest to establish the relationship of diseases and the changes in composition and concentration also in fibroblasts. However, attention should be paid on this point since LPL can be also markers of sample storage and handling procedures as recently reported for fish brain [38]. To this aim we decided to re-extract and re-analyzed lipids from FB cells after storing samples for three months at -20ºC. Figure 6 reports the XIC for LPC 18:1 at m/z 522. 325 (±0,025 m/z) for fresh (A) and old (B) sample and LPE 18:0 at m/z 502. 295 (±0,025 m/z) for fresh (C) and old (D) sample. The absolute signal intensity but also the ratio to the main PC and PE (data not shown) demonstrate that the level of LPLs was increased of almost two orders of magnitude on old sample thus confirming that the sample age greatly influences LPL/PL ratio. The XIC of the selected LPC shows two contributions labelled as a and b in Figure 6. The chosen gradient allowed to separate LPC regioisomers which differs by the position of the acyl chain attached to the glycerol carbon. The relevant MS/MS on the protonated compound [M+H]+ were subjected to HCD-MS/MS examination and results are reported in Figure 7A and 7B. The regiochemistry of LPC species can be easily assessed exploiting the presence of the ion at m/z 104.11 assigned to the choline ion that is reported to be more intense for sn1 position [42]. In this way it was also possible to assign the compound as LPC (0:0/18:1) for peak a and LPC (18:1/0:0) for peak b.
Table 1. Overview of phospholipids identified in fibroblast cells by HILIC-ESI-FTMS in negative ion mode.
| | Experimental m/z | Formula | Adduct | Attribution |
PC_1 | 660.4609 | C35H67NO8P | [M-CH3]− | 12:0_16:1 |
PC_2 | 662.513 | C35H67NO8P | [M-CH3]− | 12:0_16:0; 14:0/14:0 |
PC_3 | 674.4766 | C36H69NO8P | [M-CH3]− | 15:0_14:1; 15:1_14:0; |
PC_4 | 690.5078 | C37H73NO8P | [M-CH3]− | 14:0/16:0; 15:0/15:0 |
PC_5 | 700.4922 | C38H71NO8P | [M-CH3]− | 17:1_14:0; 16:0_15:1; |
PC_6 | 700.5079 | C38H73NO8P | [M-CH3]− | 15:1/16:0 |
PC_7 | 702.5079 | C38H73NO8P | [M-CH3]− | 16:1_15:0 |
PC_8 | 704.5235 | C38H75NO8P | [M-CH3]− | 15:0/16:0; 14:0-17:0 |
PC_9 | 714.5079 | C39H73NO8P | [M-CH3]− | 16:1/16:1; 18:2_14:0 |
| | | | | 16:2_16:0; 18:1_14:1 |
PC_10 | 716.5235 | C39H75NO8P | [M-CH3]− | 16:0/16:1; 18:1_14:0 |
PC_11 | 718.5392 | C39H77NO8P | [M-CH3]− | 16:0/16:0; 18:0_14:0 |
PC_12 | 728.5235 | C40H75NO8P | [M-CH3]− | 17:1/16:1; 15:1-18:1; 15:0-18:2; |
| | | | | 17:0-16:2; 17:1-16:1; 14:0-19:2 |
PC_13 | 730.5392 | C40H77NO8P | [M-CH3]− | 16:0_17:1; 16:1_17:0; 18:1_15:0 |
PC_14 | 732.5548 | C40H79NO8P | [M-CH3]− | 16:0/17:0 |
PC_15 | 738.5079 | C41H73NO8P | [M-CH3]− | 20:3-14:1; 18:2-16:2; 16:1-18:3; 14:0-20:4 |
PC_16 | 742.5392 | C41H77NO8P | [M-CH3]− | 16:1/18:1;16:0_18:2 |
PC_17 | 744.556 | C41H79NO8P | [M-CH3]− | 16:0/18:1 |
PC_18 | 746.5705 | C41H81NO8P | [M-CH3]− | 16:0/18:0 |
PC_19 | 748.5142 | C39H75NO10P | [M+HCOO]− | 14:0/16:1 |
PC_20 | 750.5303 | C39H77NO10P | [M+HCOO]− | 14:0/16:0 |
PC_21 | 752.536 | C41H73NO8P | [M-CH3]− | 14:0/20:4 |
PC_22 | 756.5549 | C42H79NO8P | [M+HCOO]− | 18:1/17:1; 16:0-19:2; 18:1-17:1; 16:1-19:1 |
PC_23 | 758.5705 | C42H81NO8P | [M-CH3]− | 17:0/18:1; 17:1_18:0; 16:0_19:1 |
PC_24 | 764.5235 | C43H75NO8P | [M-CH3]− | 18:1_20:4; 16:0_22:5 |
PC_25 | 770.5705 | C43H81NO8P | [M-CH3]− | 18:1/18:1 |
PC_26 | 772.5861 | C43H83NO8P | [M-CH3]− | 18:0_18:1 |
PC_27 | 774.5297 | C41H77NO10P | [M+HCOO]− | 16:1/16:1 |
PC_28 | 776.5459 | C41H79NO10P | [M+HCOO]− | 16:0/16:1; 18:1_14:1; 15:0/17:1 |
PC_29 | 778.5612 | C41H81NO10P | [M+HCOO]− | 15:0/17:0; 16:0/16:0 |
PC_30 | 782.5705 | C44H81NO8P | [M-CH3]− | 17:0_20:3 |
PC_31 | 784.5861 | C44H83NO8P | [M-CH3]− | 19:1_18:1; 18:2_19:0; 18:0_19:2 |
PC_32 | 788.5811 | C43H83NO9P | [M-CH3]− | 16:1/18:1; 18:1/16:1 |
PC_33 | 792.5548 | C45H79NO8P | [M-CH3]− | 16:0-22:5; 18:2-20:3; 18:1-20:4; 16:1-22:4 |
PC_34 | 794.5705 | C45H81NO8P | [M-CH3]− | 18:1-20:3; 18:0-20:4; 16:0-22:4 |
PC_35 | 796.5861 | C45H83NO8P | [M-CH3]− | 18:0-20:3; 18:1-20:2; 18:2-20:1 |
| | | | | 16:0-22:3; 16:1-22:2 |
PC_36 | 798.6018 | C45H85NO8P | [M-CH3]− | 18:1/20:1; 18:0/20:2; 16:2_22:0 |
PC_37 | 804.576 | C43H83NO10P | [M+HCOO]− | 16:0/18:1 |
PC_38 | 810.6018 | C46H85NO8P | [M-CH3]− | 18:0_21:3 |
PC_39 | 816.5548 | C47H79NO8P | [M-CH3]− | 18:1-22:6; 18:2-22:5; 20:3-20:4 |
PC_40 | 818.5705 | C47H81NO8P | [M-CH3]− | 18:1-22:5; 18:0-22:6; 18:2-22:4 |
| | | | | 20:3-20:3; 20:2-20:4 |
PC_41 | 820.5861 | C47H83NO8P | [M-CH3]− | 18:0-22:5; 18:1-22:4; 20:2-20:3; 20:4-20:1 |
PC_42 | 826.5621 | C45H81NO10P | [M+HCOO]− | 16:0/20:4 |
PC_43 | 830.5924 | C45H85NO10P | [M+HCOO]− | 18:1/18:1; 18:0_18:2; 16:0_20:2 |
PC_44 | 832.6073 | C45H87NO10P | [M+HCOO]− | 18:0/18:1; 19:0_16:1 |
PC_45 | 846.6229 | C46H89NO10P | [M+HCOO]− | 18:1/19:0; 19:1_18:0; 20:0_17:1 |
PC_46 | 854.5922 | C47H85NO10P | [M+HCOO]− | 18:0/20:4; 18:1/20:3; 16:0_22:4 |
| | | | | |
PE_1 | 688.4922 | C37H71NO8P | [M-H]− | 16:0/16:1; 18:1/14:0 |
PE_2 | 716.5235 | C39H75NO8P | [M-H]− | 16:0/18:1; 18:1/16:0 |
PE_3 | 736.4922 | C41H71NO8P | [M-H]− | 16:1/20:4; 16:0_20:5; 14:0_22:5 |
PE_4 | 738.5079 | C41H73NO8P | [M-H]− | 16:0_20:4; 16:1_20:3 |
PE_5 | 740.5235 | C41H75NO8P | [M-H]− | 18:1/18:2; |
PE_6 | 742.5417 | C41H77NO8P | [M-H]− | 18:1/18:1; 18:0/18:3 |
PE_7 | 744.5548 | C41H79NO8P | [M-H]− | 18:0/18:1 |
PE_8 | 752.5235 | C42H75NO8P | [M-H]− | 17:1/20:3; 17:0_20:4 |
PE_9 | 762.5079 | C43H73NO8P | [M-H]− | 18:1/20:5; 16:0_22:6; 16:1_22:5 |
PE_10 | 764.5245 | C43H75NO8P | [M-H]− | 18:1/20:4 |
PE_11 | 766.539 | C43H77NO8P | [M-H]− | 18:0/20:4; 18:1_20:3 |
PE_12 | 768.5548 | C43H79NO8P | [M-H]− | 18:0/20:3; 18:1/20:2 |
PE_13 | 770.5705 | C43H81NO8P | [M-H]− | 18:0/22:0 |
PE_14 | 776.5235 | C44H75NO8P | [M-H]− | 17:1/22:5 |
PE_15 | 790.5395 | C45H77NO8P | [M-H]− | 18:0/22:6 |
PE_16 | 792.5548 | C45H79NO8P | [M-H]− | 18:0/22:5; 18:1_22:4 |
| | | | | |
LPC_1 | 452.2782 | C21H43NO7P | [M-CH3]− | 14:0/0:0 |
LPC_2 | 466.2938 | C22H45NO7P | [M-CH3]− | 15:0/0:0 |
LPC_3 | 478.2938 | C23H45NO7P | [M-CH3]− | 0:0/16:1 |
LPC_4 | 480.3095 | C23H47NO7P | [M-CH3]− | 0:0/16:0 |
LPC_5 | 492.3095 | C24H47NO7P | [M-CH3]− | 17:1/0:0 |
LPC_6 | 494.3251 | C24H49NO7P | [M-CH3]− | 17:0/0:0 |
LPC_7 | 504.3095 | C25H47NO7P | [M-CH3]− | 0:0/18:2 |
LPC_8 | 506.3251 | C25H49NO7P | [M-CH3]− | 0:0/18:1 |
LPC_9 | 508.3408 | C25H51NO7P | [M-CH3]− | 0:0/18:0 |
LPC_10 | 526.2938 | C27H45NO7P | [M-CH3]− | 0:0/20:5 |
LPC_11 | 534.3564 | C27H53NO7P | [M-CH3]− | 0:0/20:1 |
LPC_12 | 536.3721 | C27H55NO7P | [M-CH3]− | 0:0/20:0 |
LPC_13 | 618.3776 | C33H65NO7P | [M-CH3]− | 0:0/26:1 |
LPC_14 | 620.466 | C33H67NO7P | [M-CH3]− | 0:0/26:0 |
| | | | | |
LPE_1 | 452.2782 | C21H43NO7P | [M-H]− | 16:0 |
LPE_2 | 480.3095 | C23H47NO7P | [M-H]− | 18:0 |
LPE_ 3 | 498.264 | C25H41NO7P | [M-H]− | 20:5 |
LPE_4 | 506.3262 | C25H49NO7P | [M-H]− | 20:1 |
LPE_5 | 526.2939 | C27H45NO7P | [M-H]− | 22:5 |
LPE_6 | 528.3095 | C27H47NO7P | [M-H]− | 22:4 |
LPE_7 | 536.3721 | C27H55NO7P | [M-H]− | 22:0 |
LPE_8 | 562.3878 | C29H57NO7P | [M-H]− | 24:1 |
| | | | | |
PI_1 | 807.5092 | C41H76O13P | [M-H]− | 16:0/16:1; 18:1_14:0; 18:0_14:1 |
PI_2 | 819.5206 | C42H76O13P | [M-H]− | 18:1/15:1; 16:1_17:1 |
PI_3 | 831.5029 | C43H76O13P | [M-H]− | 18:1/16:2; 16:1_18:2; 16:0_18:3 |
PI_4 | 833.5185 | C43H78O13P | [M-H]− | 18:1/16:1; 16:0_18:2; 18:0_16:2 |
PI_5 | 835.5342 | C43H80O13P | [M-H]− | 18:1/16:0; 16:1_18:0 |
PI_6 | 847.5342 | C44H80O13P | [M-H]− | 18:1/17:1; 16:1_19:1; 18:0_17:2; 18:2_17:0; |
| | | | | 16:0_19:2 |
PI_7 | 849.5498 | C44H82O13P | [M-H]− | 18:1/17:0;1 7:1_18:0; 16:0_19:1; 16:1/19:0 |
PI_8 | 857.5183 | C45H78O13P | [M-H]− | 16:0/20:4; 20:3-16:1; 18:1-18:3; 18:2-18:2 |
PI_9 | 859.5342 | C45H80O13P | [M-H]− | 18:1/18:2; 18:0_18:3; 16:0-20:3; 20:2-16:1 |
PI_10 | 861.5498 | C45H82O13P | [M-H]− | 18:1/18:1; 18:0_18:2; 16:0_20:2 |
PI_11 | 863.5655 | C45H84O13P | [M-H]− | 18:1/18:0 |
PI_12 | 871.5342 | C46H80O13P | [M-H]− | 17:0/20:4; 20:3_17:1 |
| | | | | 19:3_18:1; 18:0_19:4; 21:3_16:1 |
PI_13 | 873.5498 | C46H82O13P | [M-H]− | 19:3/18:0; 18:1_19:2 |
| | | | | 17:0_20:3; 20:2/17:1; 16:0/21:3 |
PI_14 | 881.5185 | C47H78O13P | [M-H]− | 18:1/20:5; 20:4_18:2; 16:0/22:6; 22:5/16:1 |
PI_15 | 883.3342 | C47H80O13P | [M-H]− | 20:4/18:1; 20:3_18:2; 18:0_20:5; 16:0_22:5 |
PI_16 | 885.5498 | C47H82O13P | [M-H]− | 18:0/20:4; 20:3_18:1; 16:0_22:4 |
PI_17 | 887.5655 | C47H84O13P | [M-H]− | 18:0/20:3; 18:1-20:2 |
PI_18 | 897.5498 | C48H82O13P | [M-H]− | 18:1/21:4; 21:3_18:2; 18:0_21:5; 17:1_22:4; |
| | | | | 19:1_20:4; 20:3_19:2; 19:0_20:5 |
PI_19 | 899.5655 | C48H84O13P | [M-H]− | 21:3/18:1; 18:0_21:4; 19:1_20:3; 20:4_19:0; |
| | | | | 19:2_20:2; 17:1_22:3 |
PI_20 | 907.5342 | C49H80O13P | [M-H]− | 18:1/22:6; 18:2-22:5; 20:4-20:3 |
PI_21 | 909.5502 | C49H82O13P | [M-H]− | 18:1/22:5; 18:0_22:6; 18:2_22:4 |
PI_22 | 911.5648 | C49H84O13P | [M-H]− | 18:0/22:5; 20:1_20:4; 18:1_22:4 |
PI_23 | 913.5811 | C49H86O13P | [M-H]− | 18:0/22:4; 18:1_22:3; 20:1_20:3; 20:2_20:2; |
SM_1 | 685.5302 | C39H79N2O6P | [M-CH3]− | Cer d18:1/16:0; Cer d18:0/16:1 |
SM_2 | 687.5454 | C39H81N2O6P | [M-CH3]− | Cer d18:1/16:0 |
SM_3 | 689.5504 | C39H81N2O6P | [M-CH3]− | Cer d18:0/16:1;Cer d18:1/16:0 |
SM_4 | 701.5604 | C41H83N2O6P | [M-CH3]− | Cer d18:1/17:0;Cer d19:1/16:0 |
| | 747.5672 | C41H83N2O6P | [M+HCOO]− | Cer d18:1/17:0; Cer d19:1/16:0 |
SM_5 | 713.5609 | C41H83N2O6P | [M-CH3]− | Cer d18:2/18:0; Cer d18:1/18:1 |
SM_6 | 715.577 | C41H85N2O6P | [M-CH3]− | Cer d18:0/18:1 |
SM_7 | 729.593 | C42H85N2O6P | [M-CH3]− | Cer d18:1/19:0; Cer d19:1/18:0; |
| | | | | Cer d19:0/18:1; Cer d17:1/20:0 |
SM_8 | 741.5935 | C43H85N2O6P | [M-CH3]− | Cer d18:2/20:0; Cer d18:1/20:1 |
SM_9 | 769.6241 | C45H89N2O6P | [M-CH3]− | Cer d18:1/22:1; Cer d18:2/22:0 |
SM_10 | 771.6398 | C45H91N2O6P | [M-CH3]− | Cer d18:1/22:0; Cer d22:0/18:1 |
SM_11 | 783.6405 | C46H91N2O6P | [M-CH3]− | Cer d18:1/23:1; Cer d17:1/24:1 |
SM_12 | 797.6556 | C47H93N2O6P | [M-CH3]− | Cer d18:1/24:1; Cer d18:2/24:0 |
| | 857.6766 | C47H93N2O6P | [M+CH3COO]− | Cer d18:1/24:1; Cer d18:2/24:0 |
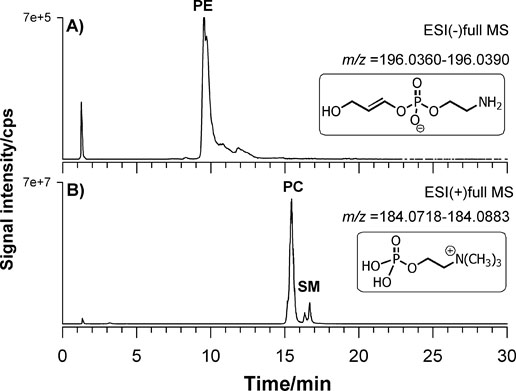
Figure 5. Extracted Ion Current (XIC) traces obtained for the BD lipid extract using AIF acquisition is reported in Figure 5 for negative (A) and positive polarity (B). The first ion extracted at m/z 196.0375 (±0.0015) is diagnostic of PE class while the ion at m/z 184.0733 (±0.0015) is diagnostic for PC, SM, and LPC. Some possible structures of these ions are given in the insets.
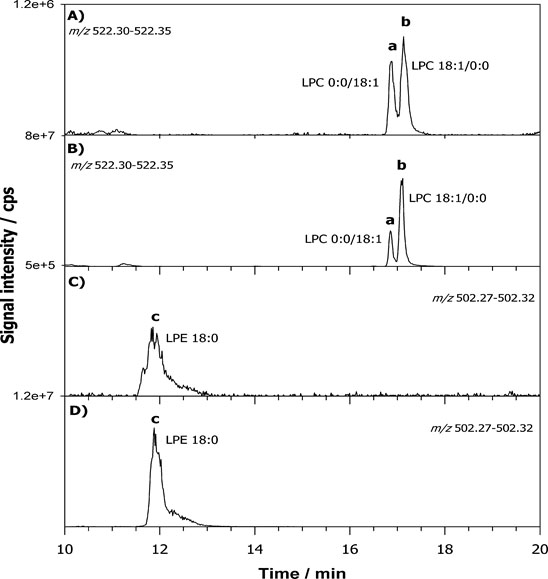
Figure 6. XIC chromatograms for LPC 18:1 centered at m/z 522. 325 (±0.025 m/z) for fresh (A) and stored (B) sample and LPE 18:0 at m/z 502. 295 (±0,025 m/z) for fresh (C) and stored (D) sample.
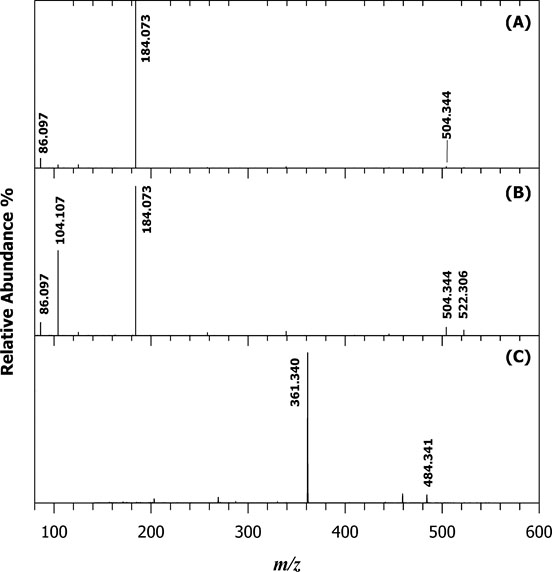
Figure 7. Tandem MS spectra of the proton adducts ([M+H]+) of regioisomeric LPC 0:0/18:1 (A) and 18:1/0:0 (B) at m/z 522.325 and LPE 18:0 (C) with m/z 502.295.
For LPE only one peak was detected in the chromatogram and it was assigned as LPE 18:0 (Figure 7C) but without assessing the regiochemistry. The LPLs identified in old samples were assigned as listed in Table 1. This last point highlights that the strategy developed could be easily applied to fibroblast cells for Parkinson patients provided that the collection, treatment and analysis of the cells are carried out simultaneously for the two samples typology.
Conclusions
The approach here proposed, shoots for overcoming the limits of conventional research approach in the field of neurodegenerative diseases where analyses are usually performed on postmortem brain tissues. To this aim, the peripheral fibroblasts have been studied as target samples since they can represent an accessible source of cells that share the same genetic information of neurons. After selecting the Bligh Dyer protocol as the most informative, HILIC- ESI-FTMS analyses, complemented by AIF MS2 experiments, performed at higher collisional dissociation energy regimes, have enabled the characterization of phospholipids in fibroblast cells. Here, for the first time, 266 main phospholipids were identified namely 104 PC, 28 PE, 14 LPC, 8 LPE, 84 PI and 28 SM. In the future minor lipids will be characterized after using specific sample pre-treatments. The overview of all lipids in whole cells is the starting point for a targeted lipidomics approach (characterization and quantification) that will be performed also in fibroblasts from skin biopsies of patients with Parkinson's disease.
Acknowledgments
This work was supported by Fondazione Puglia in the framework of the project entitled “Sviluppo ed uso di tecniche avanzate di spettrometria di massa per la caratterizzazione del profilo lipidomico cellulare e mitocondriale in fibroblasti controllo e di pazienti affetti da morbo di Parkinson”.
References
- Yeagle PL (1989) Lipid regulation of cell membrane structure and function. FASEB J 3: 1833-1842. [Crossref]
- Spector AA, Yorek MA (1985) Membrane lipid composition and cellular function. J Lipid Res 26: 1015-1035. [Crossref]
- Fahy E, Subramaniam S, Brown HA, Glass CK, Merrill AH Jr, et al. (2005) A comprehensive classification system for lipids. J Lipid Res 46: 839-861. [Crossref]
- Hannun YA, Luberto C, Argraves KM (2001) Enzymes of sphingolipid metabolism: from modular to integrative signaling. Biochemistry 40: 4893-4903. [Crossref]
- Wiest MM, Watkins SM (2007) Biomarker discovery using high-dimensional lipid analysis. Curr Opin Lipidol 18: 181-186. [Crossref]
- Wenk MR (2005) The emerging field of lipidomics. Nat Rev Drug Discov 4: 594-610. [Crossref]
- Klockgether T (2004) Parkinson's disease: clinical aspects. Cell Tissue Res 318: 115-120. [Crossref]
- Menza M, Dobkin RD, Marin H (2006) Treatment of depression in Parkinson's disease. Curr Psychiatry Rep 8: 234-240. [Crossref]
- Bernheimer H, Birkmayer W, Hornykiewicz O, Jellinger K, Seitelberger F (1973) Brain dopamine and the syndromes of Parkinson and Huntington. Clinical, morphological and neurochemical correlations. J Neurol Sci 20: 415-455. [Crossref]
- Hoang QQ (2014) Pathway for Parkinson disease. Proc Natl Acad Sci U S A 111: 2402-2403. [Crossref]
- Corti O1, Lesage S, Brice A (2011) What genetics tells us about the causes and mechanisms of Parkinson's disease. Physiol Rev 91: 1161-1218. [Crossref]
- Chaturvedi RK1, Beal MF (2013) Mitochondria targeted therapeutic approaches in Parkinson's and Huntington's diseases. Mol Cell Neurosci 55: 101-114. [Crossref]
- Papa S1, Sardanelli AM, Capitanio N, Piccoli C (2009) Mitochondrial respiratory dysfunction and mutations in mitochondrial DNA in PINK1 familial parkinsonism. J Bioenerg Biomembr 41: 509-516. [Crossref]
- Shamim A, Mahmood T, Ahsan F, Kumar A, Bagga P (2018) Lipids: An insight into the neurodegenerative disorders. Clin Nutr Exp 20: 1-19.
- Rappley I, Myers DS, Milne SB, Ivanova PT, Lavoie MJ, et al. (2009) Lipidomic profiling in mouse brain reveals differences between ages and genders, with smaller changes associated with alpha-synuclein genotype. J Neurochem 111: 15-25. [Crossref]
- Bar-On P, Crews L, Koob AO, Mizuno H, Adame A, et al. (2008) Statins reduce neuronal alpha-synuclein aggregation in in vitro models of Parkinson's disease. J Neurochem 105: 1656-1667. [Crossref]
- Cheng D, Jenner AM, Shui G, Cheong WF, Mitchell TW, et al. (2011) Lipid pathway alterations in Parkinson's disease primary visual cortex. PLoS One 6: e17299. [Crossref]
- Gerlach M, Maetzler W, Broich K, Hampel H, Rems L, et al. (2012) Biomarker candidates of neurodegeneration in Parkinson's disease for the evaluation of disease-modifying therapeutics. J Neural Transm (Vienna) 119: 39-52. [Crossref]
- Romaní-Aumedes J, Canal M, Martín-Flores N, Sun X, Pérez-Fernández V, et al. (2014) Parkin loss of function contributes to RTP801 elevation and neurodegeneration in Parkinson's disease. Cell Death Dis 5: e1364. [Crossref]
- Auburger G, Klinkenberg M, Drost J, Marcus K, Morales-Gordo B, et al. (2012) Primary skin fibroblasts as a model of Parkinson's disease. Mol Neurobiol 46: 20-27. [Crossref]
- Calvano CD, Palmisano F, Cataldi TR (2018) Understanding neurodegenerative disorders by MS-based lipidomics. Bioanalysis 10: 787-790. [Crossref]
- BLIGH EG, DYER WJ (1959) A rapid method of total lipid extraction and purification. Can J Biochem Physiol 37: 911-917. [Crossref]
- Pellegrino RM, Di Veroli A, Valeri A, Goracci L, Cruciani G (2014) LC/MS lipid profiling from human serum: a new method for global lipid extraction. Anal Bioanal Chem 406: 7937-7948. [Crossref]
- Matyash V, Liebisch G, Kurzchalia TV, Shevchenko A, Schwudke D (2008) Lipid extraction by methyl-tert-butyl ether for high-throughput lipidomics. J Lipid Res 49: 1137-1146. [Crossref]
- Baker DL, Desiderio DM, Miller DD, Tolley B, Tigyi GJ (2001) Direct quantitative analysis of lysophosphatidic acid molecular species by stable isotope dilution electrospray ionization liquid chromatography-mass spectrometry. Anal Biochem 292: 287-295. [Crossref]
- Henderson MA, McIndoe JS (2006) Ionic liquids enable electrospray ionisation mass spectrometry in hexane. Chem Commun (Camb) : 2872-2874. [Crossref]
- Losito I, Patruno R, Conte E, Cataldi TR, Megli FM, et al. (2013) Phospholipidomics of human blood microparticles. Anal Chem 85: 6405-6413. [Crossref]
- Bang DY, Byeon SK, Moon MH (2014) Rapid and simple extraction of lipids from blood plasma and urine for liquid chromatography-tandem mass spectrometry. J Chromatogr A 1331: 19-26. [Crossref]
- Craige Trenerry V, Akbaridoust G, Plozza T, Rochfort S, Wales WJ, et al. (2013) Ultra-high-performance liquid chromatography-ion trap mass spectrometry characterisation of milk polar lipids from dairy cows fed different diets. Food Chem 141: 1451-1460. [Crossref]
- Calvano CD, Glaciale M, Palmisano F, Cataldi TRI (2018) Glycosphingolipidomics of donkey milk by hydrophilic interaction liquid chromatography coupled to ESI and multistage MS. Electrophoresis 39: 1634-1644. [Crossref]
- Ali AH, Zou X, Huang J, Abed SM, Tao G, et al. (2017) Profiling of phospholipids molecular species from different mammalian milk powders by using ultra-performance liquid chromatography-electrospray ionization-quadrupole-time of flight-mass spectrometry. Food Compos Anal 62: 143-154.
- Viidanoja J (2015) Analysis of phospholipids in bio-oils and fats by hydrophilic interaction liquid chromatography-tandem mass spectrometry. J Chromatogr B Analyt Technol Biomed Life Sci 1001: 140-149. [Crossref]
- Facchini L, Losito I, Cataldi TR, Palmisano F (2016) Ceramide lipids in alive and thermally stressed mussels: an investigation by hydrophilic interaction liquid chromatography-electrospray ionization Fourier transform mass spectrometry. J Mass Spectrom 51: 768-781. [Crossref]
- Zhu C, Dane A, Spijksma G, Wang M, van der Greef J, et al. (2012) An efficient hydrophilic interaction liquid chromatography separation of 7 phospholipid classes based on a diol column. J Chromatogr A 1220: 26-34. [Crossref]
- Folch J, Lees M, Sloane Stanley GH (1957) A simple method for the isolation and purification of total lipides from animal tissues. J Biol Chem 226: 497-509. [Crossref]
- Lloyd JV, Nishizawa EE, Haldar J, Mustard JF (1972) Changes in 32 p-labelling of platelet phospholipids in response to ADP. Br J Haematol 23: 571-585. [Crossref]
- Honeyman TW, Strohsnitter W, Scheid CR, Schimmel RJ (1983) Phosphatidic acid and phosphatidylinositol labelling in adipose tissue. Relationship to the metabolic effects of insulin and insulin-like agents. Biochem J 212: 489-498. [Crossref]
- Granafei S, Liebisch G, Palmisano F, Carlucci R, Lionetti A, et al. (2017) Effect of Storage and Extraction Protocols on the Lipid and Fatty Acid Profiles of Dicentrarchus labrax Brain. Food Anal Methods 10: 4003-4012.
- Abbott SK, Jenner AM, Mitchell TW, Brown SH, Halliday GM, et al. (2013) An improved high-throughput lipid extraction method for the analysis of human brain lipids. Lipids 48: 307-318. [Crossref]
- van Eijk HM, Bloemen JG, Dejong CH (2009) Application of liquid chromatography-mass spectrometry to measure short chain fatty acids in blood. J Chromatogr B Analyt Technol Biomed Life Sci 877: 719-724. [Crossref]
- Barroso B, Bischoff R (2005) LC-MS analysis of phospholipids and lysophospholipids in human bronchoalveolar lavage fluid. J Chromatogr B Analyt Technol Biomed Life Sci 814: 21-28. [Crossref]
- Granafei S, Losito I, Palmisano F, Cataldi TR (2015) Identification of isobaric lyso-phosphatidylcholines in lipid extracts of gilthead sea bream (Sparus aurata) fillets by hydrophilic interaction liquid chromatography coupled to high-resolution Fourier-transform mass spectrometry. Anal Bioanal Chem 407: 6391-6404. [Crossref]