Biological therapeutic proteins can induce the production of anti-drug antibodies (ADA), including neutralizing antibodies (NAb), and consequently result in unwanted immune response in recipients. Although both ligand binding assay and cell-based assay have been used to measure NAb activity, the Food and Drug Administration (FDA) regulations recommend using a cell-based bioassay format for detecting NAb. In this report, a cell-based assay was developed using luciferase reporter-gene bioassays and validated for the detection of NAb activity which was produced by rhesus monkeys after injection of Aflibercept. Twelve serum samples of rhesus monkeys with positive ADA were tested for NAb by the cell-based bioassay. The results showed that all the samples were negative for NAb. However, the results of a competitive enzyme-linked immunosorbent assay (ELISA) based on Meso Scale Discovery (MSD) and electrochemiluminescence (ECL) showed all the samples were positive for NAb. The reason for this result was that the standard deviation of the cell-based assay is larger than that of the ECL ELISA, resulting in a higher cut-point of the cell-based assay and therefore low sensitivity. These basic studies will provide references for the determination of NAb in Aflibercept and even other anti- VEGF therapies in the future. However, the sensitivity in cell-based assay needs to be further improved.
anti-drug antibody, cell-based assay, electrochemiluminescent ELISA, immunogenicity, neutralizing antibody
Despite the fact that many therapeutic protein products have been successfully used to treating a variety of diseases, the implementation of therapeutic protein products are often plagued by their undesirable immunogenicity in patients [1-3]. Patient immune responses to therapeutic protein products have the potential to develop ADA, including NAb, resulting in affecting the safety and efficacy of the products [4-6]. Particularly, NAb can diminish therapeutic efficacy by either preventing the drug from binding to its target or inhibiting downstream signaling upon binding due to steric hindrance [7-9]. NAb can also cross-react and neutralize the biological activity of an endogenous counterpart in some cases, resulting in the impairment of an essential normal physiological function and life-threatening adverse effects [7,10]. Therefore, it is essential to monitor the potential NAb during biological drug development. NAb monitoring provides the key information that could allow interpretation of safety studies.
Currently, there are two major formats of assays, i.e. non-cell-based competitive ligand-binding assays (CLB) and cell-based bioassays that are commonly used to measure NAb activity [11-13]. When it comes to choosing between a CLB assay and cell-based assay, many factors need to be considered. For example, CLB assays are used when the drug's mechanism does not have a cell-based mechanism of action. Another case is when developing a sensitive or specific cell-based assay is failed [13,14]. Compared to CLB, cell-based assays tend to require a longer time for development and validation, but it is more suitable for biological therapeutic protein drugs. Food and Drug Administration (FDA) also recommends that neutralization assays may be more appropriate for using a cell-based bioassay format depending on the drug’s mechanism of action because, frequently, cell-based bioassays more closely reflect the in vivo situation and therefore provide more relevant information than ligand-binding assays [14]. Although the cell-based bioassay is complex and challenging, it is becoming the trend of development in the future for the detection of NAb. Here we developed a cell-based assay for the determination of Aflibercept NAb.
Aflibercept, also named as vascular endothelial growth factor (VEGF) Trap-eye, is approved for treating wet age-related macular degeneration (AMD) and considered to be a promising clinically proven anti-VEGF agent because its long duration of action and high binding affinity [15-19]. Like all biopharmaceuticals, Aflibercept also has the potential to cause immunogenicity. Currently there is no report on the cell-based bioassays for the detection of Aflibercept NAb.
The cell-based assay developed in this research used luciferase reporter-gene bioassays. The luciferase-based bioassays for the determination of anti-VEGF therapeutic antibodies have been validated before [20]. Based on that, we developed and validated a cell-based luciferase reporter gene assays for the detection of Aflibercept’s NAb. The cell-based bioassay in this report was based on the following experimental principles: Aflibercept binds to VEGF165 specifically, preventing it from binding to vascular endothelial growth factor receptor 2 (VEGFR-2) on HEK293 cells. Thus, it inhibits the activation of nuclear factor activated T (NFAT) signaling pathway in HEK293 cells by VEGF165, and then inhibits the expression of downstream luciferase, resulting in decrease of bioluminescence ability. Therefore, when the reaction system contains NAb, the bioluminescence value would be increased. In the ECL ELISA, VEGF165 was coated onto a 96-well plate. Serum samples and Aflibercept were mixed and then pipetted into the plate. If the serum contained in the reaction system affects the binding of Aflibercept and VEGF165, the ECL value will decrease, indicating that the serum sample contains NAb.
Reagents
GloResponse NFAT-RE-luc2P/KDR HEK293 Cells (HEK293) and Bio-GloTM Luciferase Assay System (G7941) were purchased from Promega. DMEM, fetal bovine serum (FBS), 0.25% Trypsin-EDTA, G-418 sulfate and hygromycin B were ordered from Gibco/Life Technology. Recombinant human VEGF165 was from R&D. The neutralizing positive control antibody (mouse anti-Aflibercept monoclonal antibody) was purchased from Abgent. The Aflibercept was from Bayer and the Denosumab was from Amgen. In the ECL ELISA experiment, the read buffer T (4 ×) was from MSD.
Blank serum samples of 50 rhesus monkeys were obtained from Guangdong Landau Biotechnology Co. Ltd, China. Blank serum samples of 50 rhesus monkeys were mixed as negative control (NC). Twelve serum samples of rhesus monkeys positive for ADA were obtained from National Chengdu Center for Safety Evaluation of Drugs, China.
Cell culture
The HEK293 cell was expanded in vented cap cell culture flasks at 37 °C, 5% CO2 and 95% relative humidity (RH). The growth medium was DMEM with 10% FBS, 250 μg/ml G-418 sulfate and 150 μg/ml hygromycin B. The cell lines grow relatively stable and possibly be split 1:8 at approximately 2 day intervals. The cells were resuspended in assay medium which was DMEM with 1% FBS.
Bioassay for detecting neutralizing activity
In assay medium the cells suspension was diluted to a density of 8 × 10⁵ cells/ml and plated in a white 96-well plate at a volume of 50 μl/well, containing 40000 cells per well. The white 96-well plate was incubated for 1 hour, then 50 μl of the reaction solution was added. After another 5 ± 0.5 hours of incubation, pipette 75 μl/well Bio-GloTM Luciferase Assay reagent into the cell plate. Bioluminescence value was finally detected using a microplate reader (TECAN Infinite M200 Pro, equipped with a bioluminescent module). Neutralizing positive control antibody standard curve was obtained (Figure 1).
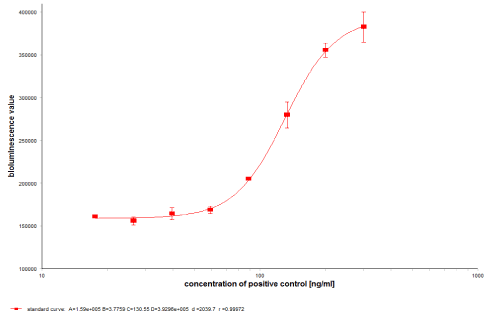
Figure 1. Neutralizing positive control antibody standard curve was obtained. The reaction system contained 20% blank serum, 20 ng/ml VEGF and 35 ng/ml Aflibercept. The concentration of positive control in standard curve was 300, 200, 133, 89, 59, 40, 26 and 18 ng/ml. Positive control with concentration of 200, 100, 70 ng/ml was used as HQC, MQC and LQC to determine the recovery rate of standard curve and the acceptance standard is 70%-130%.
Cut-point
The cut-point of the bioassay is the level of response of the assay that defines the sample response as positive or negative [14]. The NAb increases the assay response in the cell-based assay, it was positive when it was higher than the cut-point. The assay cut-point was established by testing serum from 50 healthy rhesus monkeys by three analysts, then the signal-to-noise response ratios (S/N) was calculated according to the test results. After excluding the outliers, 99% one-sided confidence interval of the test results was selected to calculate the cut-point.
Assay validation
Sensitivity: Sensitivity, or limit of detection, represents the lowest concentration at which the antibody causes either a positive result or readout equal to the cut-point determined for the NAb assay [14]. Six independent curves were used to determine the sensitivity of the assay. The curve was obtained by eight dilutions of anti-Aflibercept antibody with series concentration in pooled rhesus monkey serum matrix (Figure 1). The sensitivity of the NAb assay was established by determining the concentration of the anti-Aflibercept antibody at the cut-point using the curves.
Precision: The precision provides a measure of the variability in a series of measurements for the same material run within and between assays. To ensure adequate precision, results should be reproducible in the assay runs. Intra- and inter-assay precision was evaluated by the analysis of six independent preparations of the high, medium, low and negative control (HQC, MQC, LQC and NC) in duplicate on plates. According to the mean and standard deviation of the respective control signals, intra- and inter-assay precision (%CV) was calculated. A coefficient of variance (%CV) no greater than 20% should be acceptable.
Drug tolerance: One of the major interfering agents in a NAb assay is the drug itself. The drug interferes with the ability of the assay to detect NAb, causing false negative or false positive results. The drug tolerance of the assay was evaluated to establish the maximum amount of Aflibercept that could be present in the serum without leading to a false negative result. To determine the drug tolerance, the HQC and LQC were spiked with concentrations of Aflibercept ranging from 39.06 ng/ml to 1.22 ng/ml. The drug tolerance level in the assay was defined as the highest amount of Aflibercept that resulted in a positive response for the LQC and HQC.
Specificity and Selectivity: Specificity and selectivity refers to the ability of the method to detect NAb in a matrix that probably contains potential interfering substances. For evaluating the specificity and selectivity, 1000 ng/ml Denosumab was added to HQC and LQC. The acceptance criterion for the recovery range of the positive control antibody in sample matrix was 70% ~130%.
Determination of NAb with ECL ELISA
For NAb determination with ECL ELISA, VEGF165 was coated (0.25 μg/ml in PBS, 50 μl/well) onto the MSD standard 96-well plate overnight at 4 °C. Wash plate three times with PBST, which is PBS with Tween 20. Each well was blocked with 150 μl PBS/1% BSA for 2h and again washed three times. PBS/1% BSA solution contained 50 ng/ml sulfo-tag Aflibercept as the sample diluent. The serum samples were diluted 5 times with the diluent and 50 μl of the mixture was then pipetted into the plate. After 0.5 h incubation, the plate was washed three times. The read buffer T (2 ×) was added to the MSD standard 96-well plate at 150 μL per well, and the ECL value of the 96-well plate was read by MSD at 620nm wavelength.
Detection the samples of NAb
Twelve serum samples positive for ADA were tested by the cell-based assay and ECL ELISA to determine whether there were NAb in the samples.
Cut-point
Individual samples showing a mean response above the 75th Percentile + 1.5 × (75th Percentile − 25th Percentile), or below the 25th Percentile 1.5 × (75th Percentile − 25th Percentile) were removed from the three assay runs [21]. After exclusion of biological outliers, analytical outliers were removed from the individual runs in an identical manner. The distribution and symmetry of all three runs were assessed using the Shapiro–Wilk normality test and skewness test [21-23]. In the cell-based assay the results showed that the data were normally distributed. Consequently the cut-point was calculated using a parametric approach (one sided, 99% confidence level) and the cut-point was calculated to be 1.27 (cut-point=Mean + 2.326 × SD, Table 1). Therefore, test sample with S/N greater than 1.27 was considered as positive in the cell-based assay. In the ECL ELISA, the NAb decreased the assay response, therefore the cut-point was calculated to be 0.87 according to: cut-point =Mean − 2.326 × SD.
Table 1. Cut point for cell-based assay to determine NAb in rhesus serum
blank serum |
S/N |
blank serum |
S/N |
lot 1 |
lot 2 |
lot 3 |
lot 1 |
lot 2 |
lot 3 |
1 |
0.92 |
1.06 |
1.04 |
26 |
1.42 |
1.28 |
1.08 |
2 |
1.05 |
0.94 |
1.21 |
27 |
1.29 |
NA1 |
1.11 |
3 |
1.10 |
0.91 |
1.11 |
28 |
1.30 |
1.22 |
1.07 |
4 |
0.99 |
0.98 |
1.06 |
29 |
1.33 |
1.20 |
1.16 |
5 |
0.68 |
0.92 |
1.19 |
30 |
0.83 |
0.81 |
0.74 |
6 |
0.83 |
1.17 |
1.16 |
31 |
1.23 |
1.03 |
1.04 |
7 |
1.09 |
0.94 |
NA1 |
32 |
0.83 |
0.73 |
0.66 |
8 |
0.82 |
1.11 |
1.30 |
33 |
1.05 |
1.16 |
1.02 |
9 |
1.11 |
0.81 |
NA1 |
34 |
1.26 |
0.94 |
0.86 |
10 |
1.07 |
1.02 |
0.72 |
35 |
1.14 |
0.92 |
0.87 |
11 |
0.95 |
1.11 |
1.05 |
36 |
1.09 |
0.85 |
0.73 |
12 |
1.06 |
1.02 |
1.16 |
37 |
0.97 |
0.96 |
0.77 |
13 |
1.03 |
0.99 |
1.12 |
38 |
1.05 |
0.98 |
0.85 |
14 |
0.92 |
1.30 |
1.07 |
39 |
0.92 |
1.06 |
0.92 |
15 |
1.14 |
0.93 |
1.35 |
40 |
0.82 |
0.97 |
0.90 |
16 |
1.08 |
1.02 |
1.11 |
41 |
1.18 |
1.25 |
0.94 |
17 |
1.01 |
NA1 |
1.22 |
42 |
1.32 |
0.98 |
0.93 |
18 |
0.91 |
0.96 |
NA1 |
43 |
0.85 |
1.12 |
1.00 |
19 |
0.65 |
1.04 |
1.27 |
44 |
0.75 |
1.16 |
1.07 |
20 |
0.87 |
1.03 |
1.00 |
45 |
0.76 |
1.00 |
0.93 |
21 |
0.64 |
1.10 |
1.02 |
46 |
0.82 |
0.72 |
0.68 |
22 |
0.82 |
0.93 |
1.02 |
47 |
0.80 |
0.67 |
0.74 |
23 |
0.92 |
0.83 |
0.93 |
48 |
1.00 |
0.81 |
0.87 |
24 |
0.77 |
0.95 |
0.86 |
49 |
0.79 |
0.71 |
0.90 |
25 |
0.90 |
0.95 |
0.93 |
50 |
0.78 |
0.71 |
0.88 |
Maen |
0.99 |
SD |
0.12 |
cut-point |
1.27 |
NA1 represents that the data was outlier
Validation results
Sensitivity: The sensitivity of the cell-based assay was defined as the mean of sensitivity of six independent batches in the verification process. The sensitivity in neat serum was estimated to be 432.60 ng/ml (86.52 ng/ml in the 20% serum content detection system multiplied by dilution factor 5) for the NAb assay (Table 2).
Table 2. Sensitivity of cell-based assay to determine NAb in rhesus serum
standard curve(ng/ml) |
S/N |
Run 1 |
Run 2 |
Run 3 |
Run 4 |
Run 5 |
Run 6 |
300 |
3.50 |
2.51 |
2.81 |
2.69 |
2.61 |
2.12 |
200 |
3.09 |
2.27 |
2.61 |
2.38 |
2.22 |
1.83 |
133.33 |
2.74 |
1.81 |
2.05 |
2.06 |
1.89 |
1.49 |
88.89 |
1.91 |
1.40 |
1.51 |
1.51 |
1.39 |
1.24 |
59.26 |
1.33 |
1.21 |
1.24 |
1.30 |
1.21 |
1.07 |
39.51 |
1.17 |
1.11 |
1.21 |
1.21 |
1.16 |
1.02 |
26.34 |
1.16 |
1.11 |
1.14 |
1.11 |
1.08 |
0.99 |
17.56 |
1.06 |
1.08 |
1.18 |
1.14 |
1.12 |
0.97 |
sensitivity |
59.26 |
88.89 |
88.89 |
59.26 |
88.89 |
133.33 |
mean sensitivity |
86.52 |
Precision: After detecting six independent preparations of the HQC, MQC, LQC and NC, the S/N of HQC, MQC, LQC and NC were calculated and intra- and inter-precision were obtained (Table 3). The results showed that the %CV was less than 20%, which indicated that the precision of the NAb assay was in compliance with the requirements.
Table 3. Precision
positive control |
Intra-assay precision (CV %) |
Inter-assay precision (CV %) |
run 1 |
run 2 |
run 3 |
run 4 |
run 5 |
run 6 |
HQC |
3.88 |
8.38 |
2.47 |
5.12 |
7.27 |
2.12 |
16.71 |
MQC |
4.03 |
5.00 |
3.27 |
7.00 |
10.44 |
6.04 |
18.90 |
LQC |
3.20 |
7.85 |
3.64 |
6.59 |
10.91 |
7.25 |
7.23 |
NC |
5.99 |
4.31 |
5.67 |
3.15 |
5.30 |
2.05 |
15.49 |
HQC= high positive control, MQC= medium positive control, LQC=low positive control, NC= negative control
Drug tolerance: As shown in Table 4, in the reaction system with HQC, the S/N was less than the cut-point of 1.27 when the concentration of Aflibercept was 39.06 ng/ml. The S/N was greater than the cut-point when the concentration of Aflibercept was 19.53 ng/ml. That indicated the HQC reaction system can tolerate up to 19.53 ng/ml of Aflibercept. Similarly, the LQC reaction system can tolerate up to 4.88 ng/ml of Aflibercept. Therefore, the drug tolerance was 24.40 ng/ml in LQC and 97.65 ng/ml in HQC (in the 20% serum content detection system multiplied by dilution factor 5).
Table 4. Drug tolerance
concentration of Aflibercept (ng/ml) |
S/N |
HQC |
LQC |
39.06 |
0.91 |
1.02 |
19.53 |
1.23 |
1.09 |
9.77 |
1.86 |
1.14 |
4.88 |
2.00 |
1.19 |
2.44 |
2.29 |
1.21 |
1.22 |
2.38 |
1.29 |
HQC= high positive control, LQC=low positive control
Specificity and Selectivity: When the reaction system contains 1000 ng/ml Denosumab, the recovery rates of HQC and LQC were 85.80% and 85.87% respectively, while the recovery rates of HQC and LQC without Denosumab were 98.66% and 93.18% respectively. Although the recovery rate of positive control points was lower with the presence of Denosumab than that without Denosumab, it was still in the range of 70%-130%, demonstrating that the reaction system containing Denosumab has no obvious interference with the assay and the NAb assay has good specificity and selectivity.
Sample test result
The cell-based assay was used to detect NAb in serum samples. The results showed that the S/N of all samples was less than the cut-point (1.27), indicating that all the samples tested were negative for NAb (Table 5). ECL ELISA results showed that the S/N of samples was lower than the cut-point (the NAb reduces the assay response in the ECL ELISA, it was positive when it was lower than the cut-point, cut-point=Mean − 2.326 × SD), indicating that the samples were positive for NAb (Table 5).
Table 5. Comparison of cell-based assay and ECL ELISA
assay format |
sensitivity |
serum samples |
S/N |
cut-point |
results |
cell-based assay |
432.10 ng/ml |
1 |
0.84 |
1.27 |
negative |
2 |
0.72 |
negative |
3 |
1.01 |
negative |
4 |
1.09 |
negative |
5 |
1.11 |
negative |
6 |
1.12 |
negative |
7 |
1.25 |
negative |
8 |
0.96 |
negative |
9 |
1.20 |
negative |
10 |
1.23 |
negative |
11 |
1.19 |
negative |
12 |
1.20 |
negative |
ECL ELISA |
312.5 ng/ml |
1 |
0.61 |
0.87 |
positive |
2 |
0.51 |
positive |
3 |
0.58 |
positive |
4 |
0.42 |
positive |
5 |
0.51 |
positive |
6 |
0.36 |
positive |
7 |
0.10 |
positive |
8 |
0.45 |
positive |
9 |
0.18 |
positive |
10 |
0.12 |
positive |
11 |
0.21 |
positive |
12 |
0.31 |
positive |
In the cell-based assay, the detection value of samples was less than cut-point, which meant that NAb was not detected in the serum samples. In NAb determination with competitive ECL ELISA, the S/N of the samples was lower than the cut-point, indicating that the samples were NAb positive.
With the increased use of biopharmaceuticals there is an expanding need for validated cell-based assays that provide accurate NAb testing for preclinical and clinical studies. The NAb assessment of Aflibercept is preferentially performed using the cell-based assay, as they more closely resemble the in vivo situation when compared with CLB assay. Currently, the NAb study of Aflibercept has rarely been reported. Here, a cell-based luciferase reporter gene assay for measuring NAb to Aflibercept was preliminary developed and validated to meet the current requirement.
According to the FDA guidance, it is recommended to use a cut-point approach that is based on a more robust statistical evaluation. The cut-point is statistically determined with a sample size of at least 50 untreated individuals. In our research, 50 serum samples from healthy rhesus monkeys were used to detect cut-point. We discovered that the standard deviation (SD) of the results based on the cell-based assay was greater than the SD of the ECL ELISA. This may be caused by differences in the state of the cells, the binding to receptors on the cell surface and the cellular responses to binding. Therefore, the calculation of the cut-point (cut-point=Mean + 2.326 × SD) was also fully taken into account in this variation, ensuring that only truly NAb positive samples were confirmed. Higher cut-point in cell-based assay leaded to low sensitivity. Therefore, the results of the cell-based assay showed that all the samples were negative for NAb, whereas the ECL ELISA results were positive.
The results in this paper suggested that we should further improve the sensitivity of the cell-based assay to detect NAb, such as reducing the SD in the cut-point calculation process. This could be achieved by selecting representative samples to reduce individual differences or to ensure parallelism in different batches of the test. From another perspective, it is also necessary to find a positive control with stronger neutralizing activity to further improve the sensitivity of the assay. In addition, the results of the study indicated that when evaluating the immunogenicity of biopharmaceuticals, the determination format of NAb must be taken with caution, otherwise real results might not be obtained.
In conclusion, the cell-based assay for the detection of NAb of Aflibercept was developed and validated to comply with the requirements of the regulatory authority, which could closely reflect the in vivo situation and provide more relevant information than ligand-binding assays. These basic studies will provide references for the determination of NAb in Aflibercept and even other anti- VEGF therapies in the future.
This work was supported by National Natural Science Foundation of China (81773679).
The authors declare that they have no conflicts of interest.
- Carter PJ (2011) Introduction to current and future protein therapeutics: a protein engineering perspective. Exp Cell Res 317: 1261-1269. [Crossref]
- Kimchi-Sarfaty C, Schiller T, Hamasaki-Katagiri N, Khan MA, Yanover C, et al. (2013) Building better drugs: developing and regulating engineered therapeutic proteins. Trends in pharmacol sci 34: 534-548. [Crossref]
- Jani M, Dixon WG (2018) Drug safety and immunogenicity of tumour necrosis factor inhibitors: the story so far. Rheumatology (Oxford) 57: 1896-1907. [Crossref]
- Goodin DS, Frohman EM, Hurwitz B, O'Connor PW, Oger JJ, et al. (2007) Neutralizing antibodies to interferon beta: assessment of their clinical and radiographic impact: an evidence report: report of the Therapeutics and Technology Assessment Subcommittee of the American Academy of Neurology. Neurology 68: 977-984. [Crossref]
- Rosenberg AS, Sauna ZE (2017) Immunogenicity assessment during the development of protein therapeutics. Journal of Pharm Pharmacol 70: 584-594. [Crossref]
- Sauna ZE, Lagassé D, Pedras-Vasconcelos J, Golding B, Rosenberg AS (2018) Evaluating and Mitigating the Immunogenicity of Therapeutic Proteins. Trends Biotechnol 36: 1068-1084. [Crossref]
- Xu W, Jiang H, Titsch C, Haulenbeek JR, Pillutla RC, et al. (2015) Development and characterization of a pre-treatment procedure to eliminate human monoclonal antibody therapeutic drug and matrix interference in cell-based functional neutralizing antibody assays. J Immunol Methods 416: 94-104. [Crossref]
- Schellekens H, Casadevall N (2004) Immunogenicity of recombinant human proteins: causes and consequences. J Neurol 251 Suppl 2: II4-9. [Crossref]
- Boehncke WH, Brembilla NC (2018) Immunogenicity of biologic therapies: causes and consequences. Expert Rev Clin Immunol 14: 513-523. [Crossref]
- Casadevall N, Nataf J, Viron B, Kolta A, Kiladjian JJ, et al. (2002) Pure red-cell aplasia and antierythropoietin antibodies in patients treated with recombinant erythropoietin. The New England journal of medicine 346: 469-475.
- Civoli F, Kroenke MA, Reynhardt K, Zhuang Y, Kaliyaperumal A, et al. (2012) Development and optimization of neutralizing antibody assays to monitor clinical immunogenicity. Bioanalysis 4: 2725-2735.
- Murdaca G, Spanò F, Contatore M, Guastalla A, Penza E, et al. (2016) Immunogenicity of infliximab and adalimumab: what is its role in hypersensitivity and modulation of therapeutic efficacy and safety? Expert Opin Drug Saf 15: 43-52. [Crossref]
- Finco D, Baltrukonis D, Clements-Egan A, Delaria K, Gunn GR 3rd, et al. (2011) Comparison of competitive ligand-binding assay and bioassay formats for the measurement of neutralizing antibodies to protein therapeutics. Journal of pharmaceutical and biomedical analysis 54: 351-358.
- FDA (2019) Guidance for Industry: Immunogenicity Testing of Therapeutic Protein Products -Developing and Validating Assays for Anti-Drug Antibody Detection.
- Stewart MW (2012) Clinical and differential utility of VEGF inhibitors in wet age-related macular degeneration: focus on aflibercept. Clinical ophthalmology 6: 1175-1186. [Crossref]
- Semeraro F, Morescalchi F, Duse S, Parmeggiani F, Gambicorti E, et al. (2013) Aflibercept in wet AMD: specific role and optimal use. Drug Des Devel Ther 7: 711-722. [Crossref]
- Matsumoto H, Hiroe T, Morimoto M, Mimura K, Ito A, et al. (2018) Efficacy of treat-and-extend regimen with aflibercept for pachychoroid neovasculopathy and Type 1 neovascular age-related macular degeneration. Jpn J Ophthalmol 62: 144-150. [Crossref]
- Minami S, Nagai N (2018) Benefits of aflibercept treatment for age-related macular degeneration patients with good best-corrected visual acuity at baseline. Sci Rep 8: 58. [Crossref]
- Adrian ML, Vassilev ZP, Westborg I (2019) Baseline visual acuity as a prognostic factor for visual outcomes in patients treated with aflibercept for wet age-related macular degeneration: data from the INSIGHT study using the Swedish Macula Register. Acta Ophthalmol 97: 91-98.
- Wang L, Xu GL, Gao K, Wilkinson J, Zhang F, et al. (2016) Development of a robust reporter-based assay for the bioactivity determination of anti-VEGF therapeutic antibodies. Journal of pharmaceutical and biomedical analysis 125: 212-218. [Crossref]
- Devanarayan V, Smith WC, Brunelle RL, Seger ME, Krug K, et al. (2017) Recommendations for Systematic Statistical Computation of Immunogenicity Cut Points. The AAPS journal 19: 1487-1498. [Crossref]
- Zhang L, Zhang JJ, Kubiak RJ, Yang H (2013) Statistical methods and tool for cut point analysis in immunogenicity assays. J Immunol Methods 389: 79-87. [Crossref]
- Schaarschmidt F, Hofmann M, Jaki T, Grün B, Hothorn LA (2015) Statistical approaches for the determination of cut points in anti-drug antibody bioassays. J Immunol Methods 418: 84-100. [Crossref]