Abstract
Introduction: Muscle weakness is frequent in patients with rheumatoid arthritis but electromyographic activity of masticatory muscles in these patients remains unclear. The aim of this study is to evaluate the differences of Root Mean Square activity in patients with and without rheumatoid arthritis during a 30 seconds period using a longitudinal approach.
Material and methods: We performed a cross-sectional study and measured bilateral electromyographic activity (EMG) of masseter muscles for 30 seconds in maximum intercuspation. We measured EMG by using a digital electromyograph, developed by our group (Hardware and software) to determine µV every 0.001 seconds and root medium square (RMS) values were recorded. Patients were treated at the Department and Physiology Laboratory in the UNAM in 2017. We performed a descriptive, bivariate analysis and a random effects linear regression model for repeated measurements adjusted by confounders.
Results: We analyzed the information of 60 patients. Mean age was 43.9 years (±15.9), and 33.3% of the participants were males. As result of the multivariate analysis we identified that in patients with rheumatoid arthritis the RMS increased by 52.3 µV (95%CI 11.7; 85.73, p= 0.012) compared to patients without rheumatoid arthritis, but over a 30 second period RMS mean activity decreased at a rate of -0.44 µV per second (95%CI -0.48; -0.38, p< 0.001).
Conclusion: EMG in patients with rheumatoid arthritis had higher mean values of RMS but a decreased activity over the evaluated period. More research is needed to clarify the electromyographic activity in patients with rheumatoid arthritis.
Key words
rheumatoid, arthritis, surface, electromyography, EMG, root square mean, masseter
Introduction
Rheumatoid Arthritis prevalence is less than 1% [1,2]. However, it is estimated that over 50 million adults worldwide are affected [3]. Joints, tendons, muscle and fibrous tissues are the most frequently affected. Previous research has described that pain, inflammation and some drugs in patients with rheumatoid arthritis reduce muscle and joint activity [3,4,5,6,7] increase muscle weakness with inactivity, as has been described in other diseases such as myositis and vasculitis [1,3,4,7]. Normalization of muscular activity has been related with a decrease of pain and inflammation and consequently an increase of joint mobility and recovery of bone density [3,4,5,6,7]. Monitoring electromyographic activity has been used as a screening tool and some authors have proposed electromyographic biofeedback as therapy to recover muscular strength, reduce pain and increase functional ability.
Muscular alterations are frequently described in patients with temporomandibular disorders [8,9] and have been related to alterations in facial growth in young patients [10,11,12]. Muscular activity is important for several procedures in dentistry, but few studies included electromyography examination (EMG) [4,13,14] most used radiographs [4, 8,15, 9, 16] CT scans [4, 17, 8, 10] surface thermography [4] and inflammatory markers [10,12, 18] to evaluated rheumatoid arthritis characteristics. Alterations in muscular activity were described by using root mean square (RMS) voltage of the EMG examination of masticatory muscles in patients with rheumatoid arthritis [4, 13,14].
Although alteration in the RMS voltage has been described as an overall parameter of muscular activity in patients with rheumatoid arthritis [4] to our knowledge muscular trend over a period of time has not been previously described. Therefore, the aim of this study was to evaluate the EMG activity differences between patients with and without rheumatoid arthritis. To evaluate EMG differences, we measured EMG activity by using a low-cost surface electromyography device [19,13,14] and software [19, 13,14] that permitted the analysis of overall RMS and RMS mean activity each millisecond over a thirty second period.
Materials and methods
Study population
We conducted a cross-sectional study and used an on-line sample size calculator [20] with the option for an a priori sample as well as multiple regression to determine that with a sample size of 60 we would be able to identify a value of 0.30 or less of anticipated effect size (f2), which is considered as a medium effect. Considering an alpha of 0.05 with a power of 0.80 using 8 or less predictors.
We randomly selected 60 records of adult patients evaluated between 2016-2017 at the laboratory of physiology at the Postgraduate and Research Unit in the National Authonomous University of Mexico (UNAM). All patients signed an informed consent previous to enrollment. Electromyography was a routine study in all patients, procedures are described elsewhere [19,13,14]. Patients from the admission department were referred to the Laboratory of physiology at the Postgraduate and Research Unit, by any of the undergraduate or graduate clinical services of the Faculty of Dentistry at the UNAM. Surface electromyography is considered a non-invasive evaluation method and the study is considered less than minimum risk research according to the Mexican laws [21].
Subjects were selected based on the following inclusion criteria: 1) 18 years of age or older at the initial record time and 2) with no evidence of craniofacial abnormalities. For the exclusion criterion:1) patients with incomplete records and 2) with severe temporomandibular disorders or acute orofacial pain.
Clinical records
All patients were evaluated by a clinician at the Laboratory of physiology. Sociodemographic and clinical information was registered electronically during the initial evaluation. Records included family history and individual information of previous temporomandibular disorders (TMD). Helkimo index was performed to assess the presence of TMD before electromyography evaluation as described in other studies [22,23]. Presence of rheumatoid arthritis, bruxism and clicking or popping jaw were self-reported during the interview or assessed by a clinician before the EMG evaluation.
Surface electromyography evaluation
Electromyography evaluation was performed only for the superficial masseter muscle by using an electromyogram developed by our research groupThe electromyogram characteristics have been previously described. The electrical activity was recorded in microvolts (µV) for each 0.001 second during a total period of 30 seconds. The results were obtained by a quadratic transformation followed by a square root transformation to obtain only positive values and a continuous one-sided variation.The software presents a single graph for both right and left muscular activity by using a regression equation with a constant and a regression coefficient value for every time unit, a root mean square (RMS) value and, finally a correlation coefficient as a proxy for symmetrical muscular activity between right and left massetersFor the aim of this study we only evaluated the constant and regression coefficient value obtained from the linear regression and the RMS value.
Outcome variable
Root Mean Square (RMS). The RMS value represents the mean activity over the 30 second period and represents the level of muscular activity [19,Normal activity will range between 150 to 250 µV as reported by Cruz-Hervert et alValues above and below this range were considered with high or low muscular activity. Electromyographic evaluation was performed by a single operator (JMG), with 0.96 infraclass coefficient value for intra-operator reliability.
Data analysis
We described sociodemographic and clinical characteristic of our study sample. We reported mean, standard deviation and median, interquartile range, minimum and maximum for continuous variables and frequency and percentages for categorical variables.
We calculated the RMS value for every 0.001 seconds within the 30 second period for patients with and without rheumatoid arthritis. The mean activity during the 30 second period is depicted in an overlay line graph. To evaluate univariate differences between groups, we estimate the constant value and regression coefficient for RMS activity as well as their 95% confidence intervals by using a univariate random effects regression model for repeated measurements. We also used univariate random effects regression model for repeated measurements to explore the univariate associations between all other clinical covariates or potential confounders.
Finally, by using a multivariate random effects regression model for repeated measurements we evaluate the association between rheumatoid arthritis and all three outcome variables adjusting by sex, age, body mass index, bruxism, and clicking or popping jaw. Univariate and multivariate methods considered individuals as cluster effect units to adjust for covariance of right and left muscular activity. All statistical analyses were performed using STATA V13.1.
Results
We analyzed 60 records of which 66% (40/60) were women and overall 33.3% (20/60) were selected for our study sample. The mean age was 43.9 years (Standard deviation [S.D] 15.9). 80.0% (95%CI 67.6%-88.4%) presented bruxism and 5.0% (95%CI 1.6%-14.8%) clicking or popping jaw. According to the body mass index category 26/57 (45.6%) were classified as normal weight, 45.6% (26/57) as overweight and obese, no patients from our sample were identified as underweight. (Table 1)
33.3% (95 confidence interval [95%CI] 22.3%-46.5%) of our sample presented rheumatoid arthritis. We compared the clinical differences between patients with and without arthritis and identified that patients with rheumatoid arthritis were almost 8 years older than patients without (49.5 vs 41.1; p>0.001). No other clinical differences (p>0.05) were found between groups as shown in Table 1.
We graphed the overall Root Mean Squared (RMS) electromyographic activity (µV) for both patients with and without rheumatoid arthritis as shown in Figure 1.
Table 1. Sociodemographic and clinical characteristics of the sample
Characteristic |
Total |
With arthritis |
Without arthritis |
p value* |
Age (years) (mean, S.D.) † |
43.9 (15.9) |
49.5 (13.8) |
41.1 (16.2) |
<0.001 |
Male |
20/60 (33.3) |
16/20 (80.0) |
25/40 (62.5) |
0.170 |
Body mass index |
Underweight (<18.0) |
0/57 (0.0) |
0/19 (0.0) |
0/38 (0.0) |
0.132§ |
Normal weight (≥18.0-<25.0) |
26/57 (45.6) |
6/19 (31.6) |
20/38 (52.6) |
Overweight (≥25.0) |
31/57 (54.4) |
13/19 (68.4) |
18/38 (47.4) |
TMD symptoms |
Bruxism |
48/60 (80.0) |
17/20 (85.0) |
31/40 (77.5) |
0.494 |
Clicking or popping jaw |
3/60 (5.0) |
1/20 (5.0) |
2/40 (5.0) |
1.000 |
*p value= Chi square test, † S.D.= Standard deviation, ‡ Student's t-test, § Chi square test
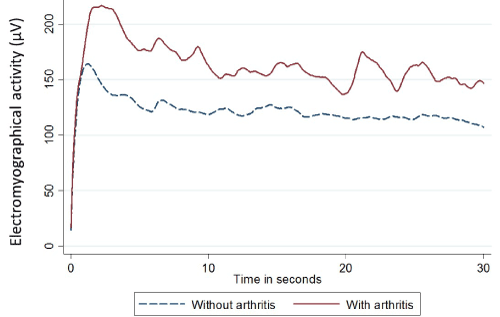
Figure 1. Line graph of mean RMS electromyography activity in patients with or without rheumatoid arthritis during a 30 second period. This graph was calculated using the mean value of RMS for every 0.001 seconds during the 30 second periods and stratified by arthritis group.
We used univariate random effects models for repeated measures to search for associations between clinical characteristics and RMS values. Patients with Rheumatoid arthritis had 42.95 µV (95%CI 0.17-85.73; p= 0.049) greater values than the RMS values of patients without rheumatoid arthritis. Clicking or popping jaw was also associated with an increased RMS mean of 233.8 µV (95%CI 148.7-318.9; p<0.001). In contrast, we identified that RMS mean decreases in a rate of -0.98 µV (IC95% -1.0; -0.9, p<0.001) over the 30 second period. Also, we observed that as the age increases the RMS mean decreases by -1.75 µV (95%CI -3.0;0.5, p=0.006) per year of age (Table1). Body mass index category, Bruxism, sex and evaluated masseter muscle had no significant association (p>0.05) to RMS mean activity.
Table 3 shows results from the multivariate random effects models for repeated measures. We identified that patients with rheumatoid arthritis increased by 52.3 µV (95%CI 11.7; 85.73, p= 0.012) compared to patients without rheumatoid arthritis, but we also observed that RMS mean activity decreased over a 30 second period in a rate of -0.44 µV per second (95%CI -0.48; -0.38, p< 0.001) besides the overall decreased rate of RMS of -0.82 µV (95%CI -0.85; -0.79, p< 0.001) observed for both groups. The multivariate model is adjusted by body mass index category, bruxism, clicking or popping jaw, age, sex and evaluated masseter muscle. However, only clicking or popping jaw (Regression coefficient [Coef.] 233.8, 95%CI 148.7; -318.9, p<0.001) and age (Coef. -1.55, 95%CI -2.9; -0.2, p=0.025) were associated with an increase or decrease in RMS mean, respectively. According to R-squared values we evaluated the goodness of fit which was high for overall effect (0.295) and between rheumatoid arthritis groups (0.323) but low within individual variations (0.043). [24].
Table 3. Results of the multivariate random effects models
Root Mean square value (RMS) |
Coef. * |
95% Confidence interval |
p-Value† |
Lower limit |
Upper limit |
With arthritis |
52.34 |
11.73 |
92.95 |
0.012 |
Time (second/100) |
-0.82 |
-0.85 |
-0.79 |
<0.001 |
Interaction between time in patients with arthritis |
-0.44 |
-0.48 |
-0.39 |
<0.001 |
Body mass index category |
Normal weight |
Reference category |
Overweight and obesity |
29.99 |
-8.3 |
68.29 |
0.125 |
TMD symptoms |
Bruxism |
44.19 |
-4.22 |
92.62 |
0.074 |
Clicking or popping jaw |
233.82 |
148.72 |
318.93 |
<0.001 |
Clinical characteristics |
Age in years |
-1.55 |
-2.91 |
-0.19 |
0.025 |
Male |
8.01 |
-34.25 |
50.25 |
0.711 |
Right masseter muscle |
0.87 |
-35.09 |
36.83 |
0.962 |
Constant |
128.64 |
58.16 |
199.11 |
<0.001 |
*Coef.= Univariate regression coefficient calculated by random effect model for repeated measures, † p value was calculated by random effect model for repeated measures
Discussion
The data presented in this cross-sectional study shows that patients with rheumatoid arthritis have an increased RMS mean value. Using an electromyography device, we were able to describe the trend in patients with rheumatoid arthritis in which the RMS mean rate decreases over the evaluated period of time.
To our knowledge there are no previous studies that describe an increase in masseter activity of patients with rheumatoid arthritis. However, previous studies report muscular weakness as a frequent characteristic in patients with rheumatoid arthritis [4,8,15,7,11) Pain [5,17,6,10,9,22) and trigeminal motor neuropathy [4] are the principal factors associated to masticatory muscle weakness. Notwithstanding, previous findings have also reported severe signs of condylar head alterations observed by CT- scan that could indicate a higher degree of severity of rheumatoid arthritis as well as a longer time with the disease [4,12]. Our sample represents adults between 20 to 60 years of age with non-severe rheumatoid arthritis or non-severe temporomandibular symptoms related to severe rheumatoid arthritis. We consider that the increase in RMS activity in patients with rheumatoid arthritis could be observed in patients with non-severe symptoms or as an onset of muscular disturbance, and muscular hyperactivity could be a first sign before a chronic muscular disturbance takes place [7, 2, 25, 9]. Our results show a decreased rate of muscular activity with age and a decreased rate during the evaluated period in rheumatic patients. This could be interpreted as a sing of fatigue or disturbance which could explain the decrease of RMS activity as the chronicity or severity of the disease increases over the years [8]. Acute and chronic inflammation factors are present in rheumatoid arthritis, chronic inflammation factors are related to severe arthritis signs and symptoms, but we considered that early or acute inflammation factors could be associated with a muscular hyperactivity in patients with non-severe arthritis or recently diagnosed cases.
Strengths and limitations of the study
The strengths of our study include the following: (1) random sample selection; (2) we calculated sample size in order to address our aim, the majority of previous studies use less than 30 patients [4, 17, 7]. (3) multivariate analysis that controlled for relevant confounders, thus permitting a reduction in bias in the estimated regression coefficient which narrows the detection of negative outcomes including relapse and recurrence; and (4) our goodness of fit was considered to have a high effect size considering the overall R-square value [24,26]. Our approach therefore overcomes many of the limitations of previous studies because we analyzed the RMS mean values every 0.001 seconds over a 30 second period not only the overall RMS mean value.
One limitation is that we do not have information about time elapsed between onset of symptoms or diagnosis and severity of rheumatoid arthritis that could support our hypothesis of higher RMS mean values in patients with less time rheumatoid arthritis. We have non-cephalometric information of these patients and we were unable to evaluate the association of posterior mandibular height, condylar neck height, and total mandibular length that have been associated with the RMS mean described as mandibulofacial or masticatory muscular adaptations [27, 25]. However, few studies [4, 17,7] have used electromyographic evaluation and more research on this topic is needed in order to clarify or identify electromyographic activity patterns that could suggest the onset of muscular activity disturbance and at the same time present different patterns according to the severity of rheumatoid arthritis.
Conclusions
Electromyography mean activity is higher in patients with arthritis, but these patients also present a higher decrease in muscular activity rate, related to fatigue. Extensive research should be performed in other to support these findings.
Footnotes
Contributors
LPCH, DEV, LAGE, MYL, CCL and FAM participated in the study design, data management, data analysis and wrote the manuscript. NPG, JMG and CIRC contributed to the study design, implementation and data management. All authors had full access to all of the data and analysis results and can take responsibility for the integrity of the data and the accuracy of the data analysis. LPCH is the guarantor.
Funding
This work was supported by the Support Program for Research Projects and Technological Innovation (PAPIIT) of National Autonomous University of Mexico (No. IT201817-DGAPA). The funding agencies did not participate in the study design; in the collection, analysis and interpretation of data; in the writing of the report; and in the decision to submit the article for publication.
Competing interests
We have read and understood Mouth and Teeth policy on declaration of interests and declare the following interests: “All authors but MYL and LCC had financial support from PAPIIT for the submitted work; no financial relationships with any organizations that might have an interest in the submitted work in the previous three years; no other relationships or activities that could appear to have influenced the submitted work and we declared that DEV, LAGE, NPG, JMG and FAM have a patent ownership for the electromyographic device and software used in this and previous research.”
References
- Silman AJ, Pearson JE (2002) Epidemiology and genetics of rheumatoid arthritis. Arthritis Res 4 Suppl 3: S265-272. [Crossref]
- Tobon GJ, Youinou P, Saraux A (2010) The environment, geo-epidemiology, and autoimmune disease: Rheumatoid arthritis. J Autoimmun, 35, 10-4. [Crossref]
- Barbour KE HC, Boring MA, Brady TJ (2017) Vital signs: prevalence of doctor-diagnosed arthritis and arthritis-attributable activity limitation — United States, 2013—2015. Morb Mortal Wkly Rep, March, In Press.
- Al-Azzawi TR, Hamdan FB, Ali AK (2008) Neurophysiologic evaluation of the temporomandibular joint and related masticatory muscles in rheumatoid arthritis patients. Neurosciences (Riyadh), 13, 253-258. [Crossref]
- Alstergren P, Fredriksson L, Kopp S (2008) Temporomandibular joint pressure pain threshold is systemically modulated in rheumatoid arthritis. J Orofac Pain, 22, 231-238. [Crossref]
- Fredriksson L, Alstergren P, Kopp S (2003) Pressure pain thresholds in the craniofacial region of female patients with rheumatoid arthritis. J Orofac Pain, 17, 326-32. [Crossref]
- Grassi W, De Angelis R, Lamanna G, Cervini C (1998) The clinical features of rheumatoid arthritis. Eur J Radiol 27 Suppl 1: S18-24. [Crossref]
- Ettala-Ylitalo UM, Syrjänen S, Halonen P (1987) Functional disturbances of the masticatory system related to temporomandibular joint involvement by rheumatoid arthritis. J Oral Rehabil, 14, 415-27. [Crossref]
- Kurtoglu C, Kurkcu M, Sertdemir Y, Ozbek S, Gürbüz CC (2016) Temporomandibular disorders in patients with rheumatoid arthritis: A clinical study. Niger J Clin Pract 19: 715-720. [Crossref]
- Gynther GW, Holmlund AB, Reinholt FP, Lindblad S (1997) Temporomandibular joint involvement in generalized osteoarthritis and rheumatoid arthritis: a clinical, arthroscopic, histologic, and immunohistochemical study. Int J Oral Maxillofac Surg, 26, 10-16. [Crossref]
- Kreiborg S, Bakke M, Kirkeby S, Michler L, Vedtofte P, et al. (1990) Facial growth and oral function in a case of juvenile rheumatoid arthritis during an 8-year period. Eur J Orthod, 12, 119-134. [Crossref]
- Kreiborg S, Bakke M, Kirkeby S, Michler L, Vedtofte P, et al. (2008) Reduced mandibular growth in experimental arthritis in the temporomandibular joint treated with intra-articular corticosteroid. Eur J Orthod, 30, 111-9. [Crossref]
- Rodríguez-Castañeda CI, M.-G. J., Cruz-Hervert LP, Angeles-Medina F, Llamosas-Hernández E, Pacheco-Guerrero N, Elias-Viñas D, García-Espinosa LA 2017. Changes of EMG Activity During Orthodontic Treatment: Cohort Study. In: IADR (ed.) 95th General Session International Association of Dental Resaarch San Francisco, California.
- Rodríguez Castañeda CI, C. H. L., Llamosas Hernández E, Elías Viñas D, García Espinosa LA, Pacheco-Guerrero N, Morales González J, Ángeles-Medina F. 2017. Cambios de la actividad electromiográfica durante las diferentes fases del tratamiento de ortodoncia: resultados de una prueba piloto. Revista Mexicana de Ortodoncia, 5, In press.
- Gleissner C, Kaesser U, Dehne F, Bolten WW, Willershausen B (2003) Temporomandibular joint function in patients with longstanding rheumatoid arthritis - I. Role of periodontal status and prosthetic care - a clinical study. Eur J Med Res, 8, 98-108. [Crossref]
- Lin YC, Hsu ML, Yang JS, Liang TH, Chou SL, et al. (2007) Temporomandibular joint disorders in patients with rheumatoid arthritis. J Chin Med Assoc 70: 527-534. [Crossref]
- Bessa-Nogueira RV, Vasconcelos BC, Duarte AP, Góes PS, Bezerra TP (2008) Targeted assessment of the temporomandibular joint in patients with rheumatoid arthritis. J Oral Maxillofac Surg 66: 1804-1811. [Crossref]
- Suenaga S, Ogura T, Matsuda T, Noikura T (2000) Severity of synovium and bone marrow abnormalities of the temporomandibular joint in early rheumatoid arthritis: role of gadolinium-enhanced fat-suppressed T1-weighted spin echo MRI. J Comput Assist Tomogr, 24, 461-465. [Crossref]
- Cruz-Hervert LP, R. C. C., Llamosas-Hernández E, Morales González J, Pacheco-Guerrero N, Verónica-Rodríguez O, Montoya-Guzmán D, Cruz-Chávez L, Ángeles-Medina F (2018) Principios básicos e interpretación electromiográfica en ortodoncia. In: ÁNGELES-MEDINA F, R. R. M. (ed.) Dolor orofacial. Editorial Trillas.
- Soper, DS (2017) A-priori Sample Size Calculator for Multiple Regression.
- Mexicanos, SDSDLEU (2012) NORMA Oficial Mexicana NOM-012-SSA3-2012, Que establece los criterios para la ejecución de proyectos de investigación para la salud en seres humanos. Diario Oficial de la Federación.
- Su N, Liu Y, Yang X, Shen J, Wang H (2016) Correlation between oral health-related quality of life and clinical dysfunction index in patients with temporomandibular joint osteoarthritis. J Oral Sci, 58, 483-490. [Crossref]
- Witulski S, Vogl TJ, Rehart S, Ottl P (2014) Evaluation of the TMJ by means of clinical TMD examination and MRI diagnostics in patients with rheumatoid arthritis. Biomed Res Int 2014: 328560. [Crossref]
- Hamilton DF, Ghert M, Simpson AH (2015) Interpreting regression models in clinical outcome studies. Bone Joint Res 4: 152-153. [Crossref]
- Tavakkoli-Jou, M, Miller AJ, Kapila S (1999) Mandibulofacial adaptations in a juvenile animal model of temporomandibular joint arthritis. J Dent Res, 78, 1426-1435. [Crossref]
- Ware JH (1993) Analysis of longitudinal data: choosing and interpreting regression models. Eur Respir J 6: 325-327. [Crossref]
- Kjellberg H (1995) Juvenile chronic arthritis. Dentofacial morphology, growth, mandibular function and orthodontic treatment. Swed Dent J Suppl, 109, 1-56. [Crossref]