Abstract
This research aimed to study the effect of laser irradiation on bee honey (Seder) physical and chemical properties. Four honey samples were used in this study with 250 g of each; three of them were irradiated by He-Ne laser with output powers 1 mW, 1.5 mW and 2 mW for 5 minutes for each sample. Analysis included measuring of some honey physical and chemical properties for the irradiated and no irradiated samples particularly electrical conductivity, refractive index, density, viscosity, moisture, Ashes, wax, monocular sugars, total sugars, glucose, fructose, maltose, sucrose and acidity, it also included estimation of some elements like Na, Ca, K, Fe, Mg. The results show that irradiation by He-Ne lead to upward effect for some physical and chemical properties like electrical conductivity, monocular sugars and density, and it lead to downward effect for ashes, wax, sucrose and density, while it lead to no significant differences (P>0.05) on refractive index, viscosity.
Key words
acidity, elements, fructose, laser honey interaction, maltose, moisture, total sugars.
Introduction
There are various chemical and physical changes caused when materials exposed to electromagnetic radiation [1]. The field of laser matter interaction may be with metal, tissue or food. Honey is the natural sweet substance produced by honey bees from the Nectar of blossoms or from secretions of living parts of plants or excretions of Plant sucking insects on the living parts of plants, which honey bees, collect, Transform and combine with specific substances of their own, store and leave In the honey comb to ripen and mature [2]. Honey consists essentially of different sugars, predominantly glucose and Fructose. The color of honey varies from nearly colorless to dark brown. The consistency can be fluid, viscous or partly to entirely crystallized. The Flavor and aroma vary, but usually derive from the plant origin [2]. In a few cases the geographical origin can be established by the presence of characteristic pollens which are limited to a certain region. More often the Presence of certain pollen combinations (honey types) allows a determination of the region in which the honey was produced. The pollen spectrum of a Honey is a result of the floral, agricultural and forest conditions of the region in which the honey was produced. The determination of the botanical origin of bee honey is based on the identification of the pollen Grains and other constituents of the sediment and on the frequencies of the different microscopic elements [3].
The conductivity is a good criterion of the botanical origin of honey and thus is very often used in routine honey quality control and purity. Honey contains organic acids and mineral salts, compounds which chemically are called “ionizable” that is when in solution, they have the property to conduct electric current. The electrical conductivity of honey is defined as that of a 20% (w/v) weight in solution at 20° C ± 0.5, where the 20% refers to anhydrous honey and express in mill Siemens per centimeter (mS.cm-1 ) [4]. Honey may be designated according to floral or plant source if it comes wholly or mainly from that particular source and has the oregano lactic, Physiochemical and microscopic properties corresponding with that origin. Honey consists fundamentally of different sugars (such as fructose and glucose), proteins,minerals, organic acids, enzymes as well as other substances and solid particles derived from honey collection. Bee honey is a valuable food that contains a combination of necessary nutrients. The honey types produced in a certain country or area represent the floral or nectar sources in that place, whose presence solely depends on the climate, topography and agricultural pattern of that area. Different kinds of bee honey vary considerably in their physical, chemical and oregano lactic properties [5].
The main target of this research was to study the effect of laser on honey as well as to determine honey properties before and after exposing by laser with different output powers for fixed time (five minutes).
Materials and methods
Materials
Crude honey Seder was brought from Cabom region South Darfur, Sudan; its weight in one Kilo gram and it was divided into four samples 250 grams for each one.
The main devices used in this research include Helium-Neon Laser (at 632.8 nm), Viscometer (HAAKE Viscometer 6 plus and 7 plus), Atomic Absorption Spectrophotometer (Perkin-Elmer 2380), Refractometer, DiST4 meters, CARBOLITE, ACCU- meter (JENWAY, UK 3505).
Methods
The irradiate: The first sample (S1) was not exposed to laser as control, the second sample (S2) was exposed to laser with output power 1mW, the third sample (S3) was exposed to a laser output power of 1.5 mW and the fourth sample S4 was exposed to a laser output power of 2 mW. He Ne laser (λ=632.8 nm) utilized with 60 pulses per second for five minutes for each sample.
Viscosity 50 ml of each samples was drawn into the upper bulb by suction, then allowed to flow down through the capillary into the lower bulb. Sample volume was measured and the time required for the test liquid to flow through a capillary of a known diameter of a certain factor between two marked points is measured. By multiplying the time taken by the factor of the viscometer, the kinematic viscosity was obtained.
Density: In order to identify honey density; the equation below was used:
Density = weight of honey/size of honey.
Conductivity: Electrical conductivity was determined by measuring 20 g dry matter of honey in 100 ml of ultra pure water. This was thoroughly mixed to form a solution. The electrical conductivity cell was immersed at 20°C, while the reading was expressed in milliSiemens per centimeter (mS.cm-1 ) (A.O.A.C, 1990).
Refractive index: Refractive index of the test sample was determined by refractometer at a constant temperature (20°C).
Wax: Ten grams of honey sample added to distilled water cool and well mixed then the sample was filtered by paper by information weight and dry paper and store after 3 hours with an oven temperature of 100 degrees centigrade.
Ashes: The ash content was determined according to A.O.A.C (1984) using muffle furnace. Two grams of honey sample gently heated in a muffle furnace until the samples became black and dry. The samples were ignited at 550°C to constant weight. Then ash was determined.
Monocular Sugar: The reducing sugars (invert sugars) were determined by the method of Lane and Eynon [6].
Total sugar: The total sugars were determined according to Walker (1917) inversion method [7].
Sucrose: The following formula is used to determine the apparent sucrose in honey sample, and the results are expressed as g apparent sucrose/100g honey [7]. Apparent sucrose content% = (invert sugar after inversion-invert sugar before inversion) × 0.95.
Fructose: The fructose in honey sample obtained after determined dextrose by iodometrically method, and reducing sugars by copper reduction method [8]. Fructose % = Reducing sugars %-Dextrose %.
Acidity: The acidity of honey is the content of all free acids, expressed in milliequivalents/kg honey. The acidity was determined as described by pearson [8].
Metal: Weighed three grams of the sample is burned in the smelter and incineration process have temperature 550-600 degrees centigrade for two hours, cool and add to it 10% Hcl and put me a water bath for an hour to nominate and be sized to 100% of the reading on the device atomic .
All these measurements were performed in triplicate, and then the average values were taken.
Results
Table 1. and figures 1-15. show the results of the physical and chemical properties of the as obtained honey sample and those irradiated by He.Ne laser with different powers.
Table 1. Results of physical and chemical properties of honey
Properties |
S1(Reference) |
S2 |
S3 |
S4 |
Conductivity (mS/cm) |
0.0143 |
0.0211333 |
0.042666 |
0.058433 |
Refractive Index |
1.42265 |
1.4303166 |
1.43065333 |
1.4394333 |
Density g/cm3 |
1.32366 |
1.444666 |
1.337666 |
1.265333 |
Viscosity Pa.s |
400.47 |
400.76 |
400.5 |
400.3033333 |
Ashes % |
0.28666 |
0.22 |
0.1933333 |
0.18333 |
Moisture % |
18.48333 |
18.41333 |
19.00333 |
18.196666 |
Wax% |
0.060666 |
0.0746666 |
0.048 |
0.027333 |
Sugars Monocular% |
69.226666 |
69.65 |
70.176666 |
70.95333 |
Total sugars% |
72.7133333 |
70.56 |
71.0833 |
72.63666 |
Glucose % |
32.1 |
32.606666 |
32.8333 |
34.67666 |
Fructose % |
37.35 |
39.143333 |
37.21333 |
38.31666 |
Sucrose % |
3.4866666 |
1.5033 |
0.9066 |
1.6833 |
Maltose % |
7.31 |
6.97333 |
6.9733 |
7.15 |
Na/ ppm |
4.593333 |
4.48 |
4.70333 |
5.43 |
Ca /ppm |
6.493333 |
6.163 |
4.95 |
4.74 |
K /ppm |
61.39 |
60.503333 |
59.69333 |
57.68333 |
Fe/ ppm |
0.3933 |
0.41 |
0.42666 |
0.3833333 |
Mg/ ppm |
2.303333 |
2.056666 |
2.05 |
2.19 |
Acidity |
36.61666 |
36.91333 |
35.78 |
36.02 |
Figure 1. illustrates the variation of the electrical conductivity of honey samples versus laser output irradiation power; it shows that the electrical conductivity of the as obtained honey (control or reference) sample was 0.0143 mS/cm, while the electrical conductivity of the irradiated samples increased proportional to the laser output power in the range from 0.0211333 mS/cm to 0.058433 mS/cm.
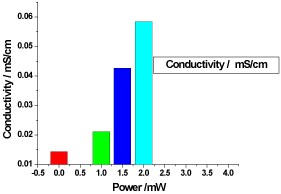
Figure 1. Variation of honey conductivity versus laser output irradiated powers
Figure 2. illustrates the variation of refractive index of honey samples versus laser output power; it shows that the refractive index of the reference sample was 1.42265, while there was no significant differences (P>0.05) in the irradiated samples refractive indices compared to the reference sample.
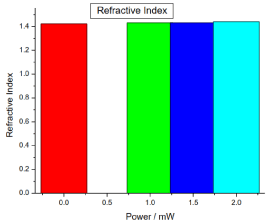
Figure .2 Variation of honey refractive index versus laser output irradiated powers
Figure 3. illustrates the variation of density of honey samples versus laser output power; it shows that the reference sample density was 1.32366 g/cm3 and the irradiated samples densities was increased in the lower dose sample to 1.444666 g/cm3, then decreased in the other two samples to 1.337666 g/cm3 and1.265333g/cm3.
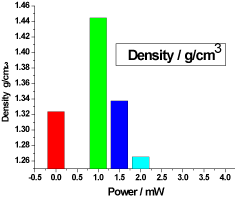
Figure 3. Variation of honey density versus laser output irradiated powers.
Figure 4. illustrates the variation of the viscosity of honey samples versus laser output power; it shows that the reference sample viscosity was 400.47 Pa.s and the irradiated samples viscosity were 400.76 Pa.s, 400.5 Pa.s and 400.3033333 Pa.s, there was no significant differences (P>0.05) in the irradiated samples viscosity compared to the reference sample.
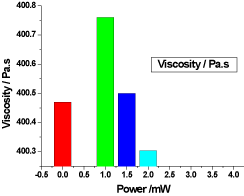
Figure 4. Variation of honey viscosity versus laser output irradiated powers.
Figure 5. illustrates the variation of the ashes of honey samples versus laser output power; it shows that the ashes of the reference sample was 0.28666%, while the irradiated samples ashes decrease proportional to the laser output power, the irradiated samples ashes percentages were 0.22%, 0.1933333% and 0.18333%.
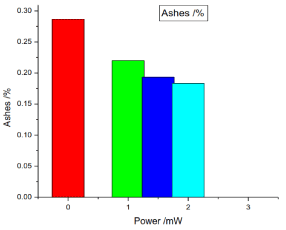
Figure 5. Variation of honey ashes versus laser output irradiated powers
Figure 6. illustrates the variation of the moisture of honey samples versus laser output power; it shows that the reference sample moisture was 18.48333% and the irradiated samples moisture percentages were 18.41333%, 19.00333% and 18.196666%, there was no significant differences (P>0.05) in the irradiated samples moisture compared to the reference sample.
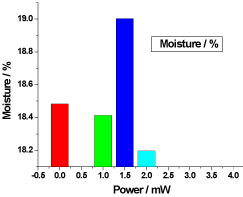
Figure 6. Variation of honey Moisture versus laser output irradiated powers
Figure 7. illustrates the variation of the wax of honey samples versus laser output power; it shows that the wax of the reference sample was 0.060666%, while the irradiated samples wax increased by the low power greater than the control wax, but it was decreased proportional to the laser output power, the irradiated samples wax percentages were 0.0746666%, 0.048% and 0.027333%.
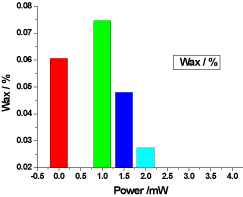
Figure 7. Variation of honey wax versus laser output irradiated powers
Figure 8. illustrates the variation of the total sugar of honey samples versus laser output power; it shows that the reference sample total sugar was 72.713333% and the irradiated samples total sugar percentages were 70.56%, 71.0833% and 72.63666%, there was no significant differences (P>0.05) in the irradiated samples total sugar compare with the reference sample.
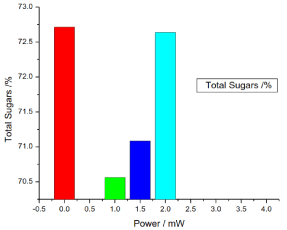
Figure 8. Variation of honey total sugar versus laser output irradiated powers
Figure 9. illustrates the variation of the monocular sugars of honey samples versus laser output power; it shows that the monocular sugars of the reference sample was 69.226666%, while the irradiated samples monocular sugars percentages were slightly increased proportional to the laser output power in the range from 69.65% to 70.95333%. This may be due to the breakup of the total sugar.
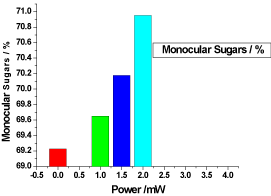
Figure 9. Variation of honey monocular sugars versus laser output irradiated powers
Figure 10. illustrates the variation of the glucose of honey samples versus laser output power; it shows that the glucose of the reference sample was 32.1%, while the irradiated samples glucose percentages were increased proportional to the laser output power in the range from 32.606666% to 34.67666%.
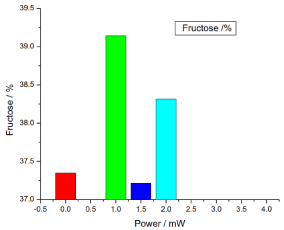
Figure 10. Variation of honey glucose versus laser output irradiated powers
Figure 11. illustrates the variation of the fructose of honey samples versus laser output power; it shows that the reference sample fructose was 37.35% and the irradiated samples fructose percentages were 39.143333%, 37.21333% and 38.316666%, there was no significant differences (P>0.05) in the irradiated samples fructose compared to the reference sample.

Figure 11. Variation of honey fructose versus laser output irradiated powers
Figure 12. illustrates the variation of the sucrose of honey samples versus laser output power; it shows that the sucrose of the reference sample was 3.4866666%, while the irradiated samples sucrose percentages were decreased less than the control sample, the irradiated samples sucrose was 1.5033%, 0.9066% and 1.6833%.
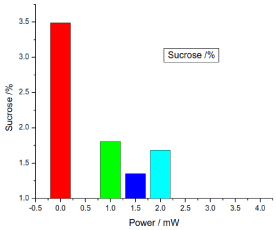
Figure 12. Variation of honey sucrose versus laser output irradiated powers
Figure 13. illustrates the variation of the maltose of honey samples versus laser output power; it shows that the reference sample) maltose was 7.31% and the irradiated samples maltose percentages were 6.97333%, 6.9733% and 7.15%, there was no significant differences (P>0.05) in the irradiated samples maltose compared to the reference sample.
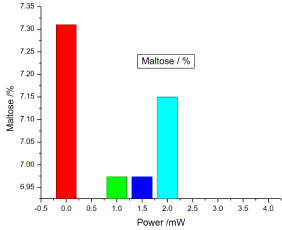
Figure 13. Variation of honey maltose versus laser output irradiated power
Figure 14. illustrates the variation of the acidity of honey samples versus laser output power; it shows that the reference sample acidity was 36.61666 and the irradiated samples acidity percentages were 36.91333, 35.78 and 36.02, there was no significant differences (P>0.05) in the irradiated samples acidity compared to the reference sample.
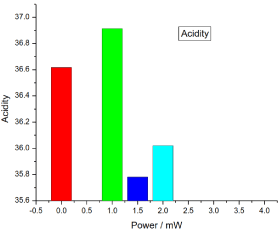
Figure 14. Variation of honey Acidity versus laser output irradiated powers
Figure 15. illustrates the amount of sodium (Na) in the different samples; it shows that the amount of sodium in the reference sample was 4.593333%, while in the irradiated samples sodium slightly increased proportional to the laser output power in the range from 4.48% to 5.43%.
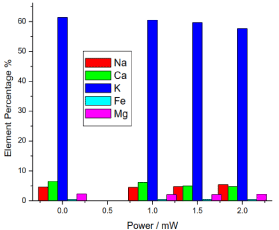
Figure 15. Variation of honey elements versus laser output irradiated powers
It also illustrates the amount of calcium (Ca) in the different samples; it shows that the amount of calcium in the reference sample was 6.493333%, while in the irradiated samples calcium increased by the lower power greater than in the control, then it decreased proportional to the laser output power, the irradiated samples calcium was 6.163%, 4.95% and 4.74%.
It also illustrates the amount of potassium (K) in the different samples; it shows that the amount of potassium in the reference sample was 61.39%, while the irradiated samples potassium decreased less than the reference sample, the irradiated samples potassium was 60.503333%, 59.69333% and 57.68333%.
It also illustrates the amount of Iron (Fe) in the different samples; it shows that the amount of Iron in the reference sample was 0.3933% and in the irradiated samples Iron values were 0.41%, 0.42666% and 0.3833333%, there was no significant differences (P>0.05) in the Iron of the irradiated samples compared to the reference sample.
It also illustrates the amount of magnesium (Mg) in the different samples; it shows that the amount of magnesium in the reference sample was 2.303333% and in the irradiated samples the magnesium values were 2.056666%, 2.05% and 2.19%, there was no significant differences (P>0.05) in the irradiated samples compared to the reference sample.
Discussion
The physicochemical properties of the different the samples of honey are reported in table 1 and figures 1-15, it show the effect of the interaction of the laser pulsed He-Ne laser with the molecules of honey.
Conductivity is the indication of ionizable acids and compounds in aqueous solution, According to the work it was found that the electrical conductivity of the irradiated sample increased proportional to the laser output power, this increase might be due to the photoelectric effect when laser photons interact with honey molecules and give off electrons [9].
The results showed that the refractive index of honey also increased proportional to the laser output power, ranged between 1.4303166-1.4394333 for the irradiated samples. This value is similar to those reported by Ndife et al. (2004) who obtained 1.41-1.44 of Nigerian honeys [10].
2021 Copyright OAT. All rights reserv
The glucose content of honeys under investigation ranged from 32.1% (reference sample) to 34.67666 also increased proportional to the laser output power, these values are within the range of 29.4-42.0% reported by [11].
Monocular sugars also increased proportional to the laser output power; this may be due to the degradation of the total sugar by laser pulses. The monocular sugar contents of the samples used in this study had average value of 70.0016655 ± 0.9516645, the values obtained in this study are similar to the values reported for honeys from Bangladesh [12].
Proportional inverse of ash content and sucrose was detected from the interaction of laser with honey. The ash contents of honey obtained in this study were all within the limits of <0.6 g/100 g specified by international norms [13]. The level of sucrose in honeys samples ranged from 3.4866666% to 0.9066%, these values were located within the range 0.14-11.49% recorded by Serrano et al. [14].
Other properties like total sugars, fructose, maltose, viscosity, density, wax, acidity and moisture affected greatly by temperature and water content [10] it didn’t affect by irradiation processes, because of heatless effect of pulsed laser. Total sugars represent the largest portion of honey. The level of total sugars in honeys samples ranged from 70.56% to 72.7133%, The values obtained in the present study were located within the range of 60.6-79.4% given by Ibrahim [15]. The level of fructose in honeys samples ranged from 37.21333% to 39.143333%, These values fall within the range of 33.0-48.4% obtained by Finola et al. [16]. The level of acidity of honeys samples ranged from 35.78 to 36.9133, these values were located within the range 17.6 and 39.8 recorded by Terrab et al. [17].
The mineral content in the four types of honeys samples were determined and the results were presented in table 1 and Figure 15. The predominating mineral element in honey is potassium [18,19]. Results of the elemental nutrient showed that potassium was the most abundant element in honey samples with the range value of 57.68333 to 61.39 ppm. Potassium followed by calcium, sodium, magnesium, and iron respectively in all samples. In general the amount of potassium was the highest one and Iron amount was the lowest one in all samples with no significant differences (P>0.05) in all elements.
Conclusion
As conclusion four honey bee samples were collected from Cabom region South Darfur. Three of them were irradiated by differ output power of He.Ne laser in the same time 5 minutes. These samples were subjected to some physical and chemical test to investigate. The investigated properties were electrical conductivity, refractive index, density, viscosity, Moisture, Ashes, Wax, Monocular Sugars, Total sugars, Glucose, Fructose, Maltose, Sucrose and acidity; it also included estimation of some elements like Na, Ca, K, Fe, and Mg.
The results of irradiation of honey by He-Ne Laser effect on some physical and chemical properties by increasing like conductivity, monocular sugar, glucose, density and it affect in other properties by decreasing like ashes, wax, sucrose, density and it didn't affect in some properties like refractive index, viscosity, moisture, total sugar, fructose, maltose and some elements like Na, Ca, K, Fe, Mg.
References
- Bhat NV, Nate MM, Bhat RM, Bhatt BC (2007) Effect of gamma-irradiation on polyvinyl alcohol films doped with some dyes and their use in dosimetric studies. IJPAP 45: 545-548.
- Gebremedhin G, Tadesse G, Kebede E (2013) Physiochemical characteristics of honey obtained from traditional and modern hive production systems in Tigray region, northern Ethiopia. MEJS 5: 115-128.
- Louveaux, J, Maurizio A, Vorwohl G (1978) Methods of melissopalynology. Bee world 59: 139-157.
- Yadata, D (2014) Detection of the electrical conductivity and acidity of honey from different areas of Tepi. Food Science and Technology 2: 59-63.
- Mohammed HME (2015) Chemical Properties and Antibacterial Activities of Different Kinds of Floral Bee Honeys (Doctoral dissertation, UOFK).
- Lane JH, Eynon L (1923) Sugar analysis. J Soc Chem Ind 42, 32 T, 143 T, 463 T.
- Walker HS, (1917) A Simplified Inversion Process for the Determination of Sucrose by Double Polarization. Ind Eng Chem 9: 490-492.
- Pearson SD (1976) The chemical analysis of food 7th edition. Churchill Livingstons.
- Steen WM, Mazumder J (2010) Laser Ablative Processes–Macro-and Micr omachining. In Laser Material Processing (pp. 371-387). Springer London.
- Ndife J, Abioye L, Dandago M (2014) Quality assessment of Nigerian honey sourced from different floral locations. Nigerian Food Journal 32: 48-55.
- Ouchemoukh S, Louaileche H, Schweitzer P (2007) Physicochemical characteristics and pollen spectrum of some Algerian honeys. Food control 18: 52-58.
- Khalil MI, Motalib MA, Anisuzzaman ASM, Sathi ZS, Hye MA, et al. (2001) Biochemical analysis of different brands of unifloral honey available at the north region of Bangladesh. Asian network for scientific Information 1: 385-388.
- Alimentarius C (2001) Revised codex standard for honey. Codex stan, 12: 1982.
- Serrano S, Villarejo M, Espejo R, Jodral M (2004) Chemical and physical parameters of Andalusian honey: classification of Citrus and Eucalyptus honeys by discriminant analysis. Food Chem 87: 619-625.
- Ibrahim AO (1985). Studies on Sudanese honeys. M. Sc. Thesis Faculty of Agriculture. University of Khartoum, Sudan.
- Finola MS, Lasagno MC, Marioli JM (2007) Microbiological and chemical characterization of honeys from central Argentina. Food Chem 100: 1649-1653.
- Terrab A, Recamales AF, Hernanz D, Heredia FJ (2004) Characterisation of Spanish thyme honeys by their physicochemical characteristics and mineral contents. Food Chem 88: 537-542.
- White JW, Rudyj ON (1978) The mineral content of honey. J Api Res 17: 234-238.
- Association of Official Analytical Chemists (1990) In; Helrich K (ed) Official Methods of Analysis, 15th ed., Arlington, VA USA, pp. 1025-1026, 1033-1034.


