Aim: The goal of this work was to find out if the variation in breathing flow pattern alone (without change in tidal volume and respiratory rate) changes the end-tidal CO2 tension (EtCO2) enough to affect the health of a patient. The influence of I:E ratio on EtCO2 was also investigated.
Method: Four breathing flow patterns belonging to different individuals diagnosed with COPD were collected from the literature. These were scaled to the same tidal volume, respiratory rate and I:E ratio, leaving shape as the only varying parameter. A programmable piston pump was used to reproduce the
breathing flow patterns in an anatomically correct adult upper airway model (3D printed in acrylic, Visijet Ex200). CO2 was simultaneously bled into the pump chamber at steady rate to mimic metabolic CO2 production, followed by the measurement of EtCO2 with and without 30 L/min of nasal high flow therapy.
Results: Breathing flow patterns varying in shape but not in tidal volume, respiratory rate and I:E ratio can produce statistically significant differences in EtCO2. The variability in EtCO2 was however found to be small (1 - 2%) and unlikely to be physiologically relevant. A 35% fall in I:E ratio corresponded
to a 2% rise in EtCO2. 30 L/min of NHF reduced EtCO2 by approximately 20%.
Conclusion: Shape alone can cause a statistically significant difference in EtCO2 however the difference in EtCO2 is small. A 35% reduction in I:E ratio results in a 2% rise in EtCO2.
end-tidal CO2 tension, nasal high flow therapy
Arterial CO2 tension modulates ventilation via a feedback mechanism. It is thus reasonable to hypothesise that each breathing pattern (though influenced by disease state) is optimized in terms of shape, amplitude and frequency to effect a specific change in CO2 tension. Previous studies have explored how tidal volume, dead space volume, respiratory frequency and metabolic CO2 rate influence EtCO2. In a study by Parot, et al. [1] the respiratory frequency and metabolic CO2 production in hypercapnic and non-hypercapnic COPD patients were found to be similar however the hypercapnic group showed a lower tidal volume. In hypercapnic individuals, the EtCO2 correlates well with the ratio of dead space volume to tidal volume [2,3]. EtCO2 has been reported to correlate well with arterial CO2
Tension [4].
Critically ill patients suffering from COPD benefit from nasal high flow (NHF) therapy, which is the administration of warmed and humidified air at flow rates up to 8 L/min in neonates [5-7] and 60 L/min in adults [8]. NHF reduces the physiological dead space and respiratory frequency, and improves gas exchange [9-12].
The capnogram of a COPD patient is modulated by the degree of obstruction of the airways [13-15]. This obstruction, which affects the breathing flow pattern and magnitude, causes the capnogram of COPD patients to have a ’shark fin shape’, [16] making them distinct from those of healthy individuals, which are more rectangular in shape [17]. Clinical studies on how a variation in the breathing flow pattern alone change EtCO2 are scarce due to the difficulty in simultaneously maintaining the same tidal volume, peak airflow and I:E ratio over several breaths. In this report, an in-vitro study of the effect of
breathing flow pattern, with and without NHF, on EtCO2 is presented. Also the influence of I:E ratio variation on EtCO2 is explored.
Waveform collection
Four breathing flow patterns obtained from COPD patients (age range = 17 - 77 years, FEV1% pred = 36 - 63%) were collected from the literature. In three of these flow patterns [18-20], flow rate was plotted against time. In the remainder [21], the flow pattern was presented as a plot of tidal volume versus time which was numerically integrated to yield flow rate versus time plot after acquisition. Together with a healthy adult breathing flow waveform, which was previously used by Van Hove, et al. [22] and Spence, et al. [23] five waveforms were used in all.
A plot of all the waveforms collected is shown in Figure 1a. Note that positive flow represent inspiration and negative flow, expiration. The four COPD waveforms are designated as WF1, WF2, WF3 and WF4 with the healthy waveform labelled as WF5 (unmarked solid line). The COPD flow waveforms have
a sharp concavity in the expiratory phase. It is noticeable that they vary in frequency and amplitude.
Normalization of waveforms
All the waveforms were normalized to the same tidal volume and respiratory rate via a linear rescaling of time axis followed by a linear rescaling of the flow rate axis using different scaling factors for inspiratory and expiratory phases. Also, the inspired volume was matched to the expired volume. Two groups of breathing flow waveforms were obtained by scaling each breathing flow to two different I:E ratios i.e. 0.67 (IE1-group) and 0.43 (IE2-group), which corresponded to inspiratory time fractions of 40% and 30%. The fall in I:E ratio from 0.67 to 0.43 equals 35%. This change of 35% in I:E ratio was hypothesized to be sufficient to produce a significant change in EtCO2. The breathing flow patterns
in the IE1-group and IE2-group are shown in Figures 1b and 1c respectively. Two different I:E ratios were needed to investigate the effect of I:E ratio on EtCO2. The choice of I:E ratios were not without justification as Tobin, et al. [24] reported an I:E ratio of 0.73 ± 0.03 for healthy adults and 0.53 ± 0.05
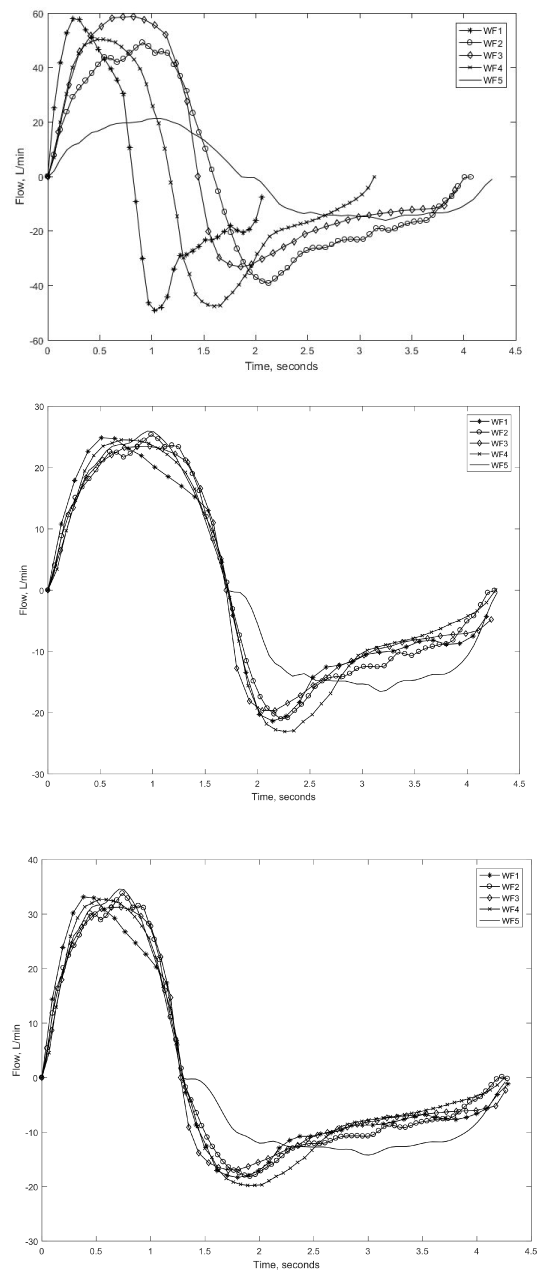
Figure 1. (a) All waveforms before scaling (b) IE1-group of flow waveforms (c) IE2-group of flow waveforms.
for adult COPD patients.
Experimental setup
The experimental set-up is shown in Figure 2b. In the setup, a rigid upper airway model (3D-printed in acrylic, Visijet EX200) - Figure 2a - of an anonymous 44 year male adult (previously used by Spence, et al. [25] and Van Hove, et al. [22]) was connected to a piston pump. A CO2 source was connected to
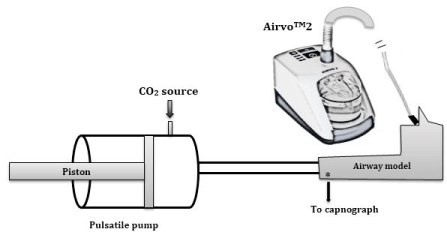
Figure 2. (a) Upper airway model (b) UAM is connected to the piston pump and AIRVOTM2 device. CO2 source is connected to piston pump for simulation of metabolic CO2 production. CO2 is sampled at the trachea during experiment.
the barrel of the piston pump via a rotameter. CO2 was sampled at the trachea using a 20 Hz capnograph (MiniMediCO2, manufactured by Oridion Medical Ltd., Israel). A mixing test conducted by placing a wire-gauze (to enhance mixing) at the entrance of the piston pump yielded no significant difference
in EtCO2 (< ± 3%). The volume of the piston chamber at the end of expiration (functional residual capacity) was maintained at 2500 ml for all experiments.
Experimental procedure
The pump forces the tracheal flow rate to follow the healthy waveform (WF5) in Figure 1b and Figure 1c. Metabolic CO2 production was simulated by bleeding CO2 at a flow rate of 98 scc/min (at a 20 KPa CO2 source pressure) into the barrel of the piston pump. The end-tidal (EtCO2) at this setting was 5.4% ± 0.3, which is comparable to the EtCO2 of a resting healthy adult. CO2 data was recorded before (zero-therapy, ZT) and during the application of 30 L/min of NHF (NHF30). An identical procedure was performed for all other waveforms with 6 repetitions for each.
The capnogram was recorded for 20 consecutive breathing cycles for each experimental repeat. The 20 cycles of capnogram in repeat one (for healthy waveform (WF5) in IE1-group) have been superimposed and cascaded with those of the other repetitions as shown in Figure 3a. The variations in EtCO2 from
cycle to cycle is due to mixing. Figure 3b shows the average of all 120 capnograms (20 cycles in each of the 6 repeats) for WF5 (in IE1-group) with and without NHF. An identical plot is shown in Figure 3c for WF4 (a COPD waveform). Note the characteristic ’shark fin’ shape of the COPD waveform (which is due to airway obstruction) [16].
The spontaneous breathing plots (for a no NHF condition) in Figure 3b and Figure 3c show a minimum CO2 concentration of about 0.2% which is due to rebreathing of dead space CO2 during inspiration. Note how this falls to 0.04% (atmospheric CO2 concentration) when NHF of 30 L/min is applied. This
indicates a reduction in re-inspired dead space CO2 by NHF, which is in line with findings by Spence, et al. [23] and Van Hove, et al. [22] that NHF promotes mixing and flushes dead space CO2. In Figure 3b and Figure 3c the EtCO2 falls by approximately 20% when NHF of 30 L/min is applied.
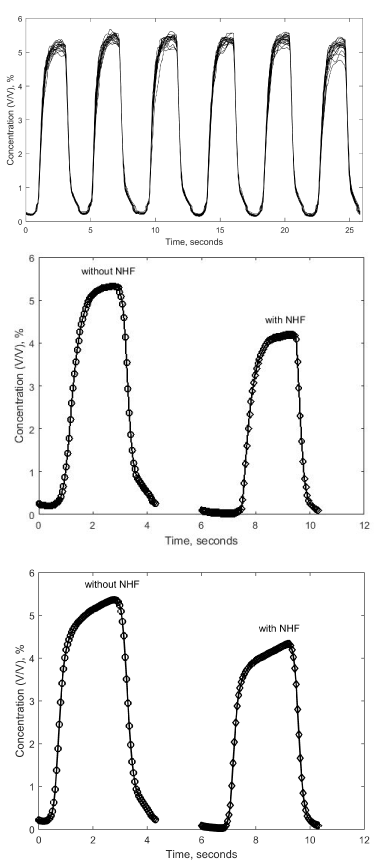
Figure 3. (a) A train of 6 capnograms for the healthy waveform (WF5) (b) Average of 120 capnograms for WF5 (c) Average of 120 capnograms for WF4..
The average EtCO2 (of 120 capnograms) for each waveforms (in both IE1-group and IE2-group) have been presented in Figure 4. The error bars represent two standard deviations in EtCO2. In Figure 4, the EtCO2 vary slightly between waveforms (e.g. see IE1-group waveforms) however the error bars overlap. Also pairs of plots belonging to the same waveform show some difference in EtCO2 though error bars overlap (e.g. for label WF4 in Figure 4, compare the IE1-group and IE2-group pair).
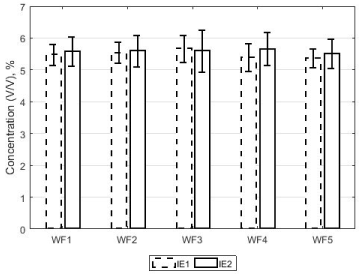
Figure 4. A plot of the average EtCO2 of 120 capnograms associated with flow waveforms in both groups (IE1-group and IE2-group). The errorbars represent two standard deviations in EtCO2 over the 120 capnograms.
The present finding shows that the characteristic shape of the COPD capnogram (’shark fin’) - due to airway obstruction - can be reproduced from the corresponding breathing flow pattern. This supports the clinical reports that the breathing flow pattern modifies the shape of the capnogram [16]. Though error bar overlaps in EtCO2 have been observed between and within the I:E ratio groups (IE-1 and IE-2) it is not conclusive if this means no statistically significant difference in EtCO2 exists. In what follows a test of statistical difference in EtCO2 is performed.
Test of statistical significance
A single factor ANOVA test was performed to find if the difference in EtCO2 was statistically significant between different waveforms of the same I:E ratio. Further, a two sample t-test (assuming unequal variances) on pairs of EtCO2 belonging to the same waveform but differing in I:E ratio was
performed. In both tests, the critical value to confirm the null hypothesis was set to 0.02 instead of 0.05 to indicate a strong evidence against the null hypothesis. The results are presented in Table I, which shows evidence of statistically significant difference in EtCO2 (p-value < 0.02) within the same group
of I:E ratio (single factor ANOVA test, Table 1). Except for WF4, I:E ratio made a statistically significant difference in EtCO2 (p-value < 0.02) in pairs belonging to the same I:E ratio (two-sample t-test, Table I). WF4 was not distinct in characteristics from the other waveforms.
Table 1. Results of a single factor ANOVA test and a two-sample t-test.
A single factor ANOVA Test.
Groups |
Sum of |
df |
Mean |
F |
P-value |
(IE1 and IE2) |
squares |
square |
IE1 |
259 |
4 |
65 |
20 |
0.0001 |
IE2 |
84 |
4 |
21 |
5 |
0.0006 |
Two-sample t-Test |
|
WF1 |
WF2 |
WF3 |
WF4 |
WF5 |
p-value |
0.003 |
0.0001 |
0.002 |
0.05 |
0.002 |
Another two-sample t-test was performed for each I:E ratio group to find the specific pairings of flow waveforms that showed statistically significant difference in EtCO2 as the single factor ANOVA test could not determine this. Note that 5 flow waveforms will yield 10 pairs. The results are presented
in Table 2 in which 7 pairs (70%) - in bold ink – show statistically significant difference in EtCO2 (p-value < 0.02) within the IE1-group. Only 4 pairs (40%) in the IE2 group have statistically significant differences in EtCO2.
It is concluded that the differences in EtCO2 of waveforms that are similar in all but pattern are statistically significant (p-value < 0.02) (a single factor ANOVA test, Table I). Also, EtCO2 is sensitive to I:E ratio as 4 out of 5 flow waveforms (WF1, WF2, WF3 and WF5 but not WF4) showed a statistically
significant difference in EtCO2 (p-value < 0.02) (two sample t-test, Table 1). Furthermore, it is deduced from Table 2 that though statistically significant disparities in EtCO2 was found in each group (Table 1), intragroup differences in EtCO2 in the higher I:E ratio group (IE1-group, I:E ratio = 0.67) were more frequent (70%) than in the lower I:E ratio group (IE2-group, I:E ration = 0.47) - only 40% of the pairs showed a significant difference in EtCO2.
Table 2. My caption.
p-value |
WF1/ |
WF1/ |
WF1/ |
WF1/ |
WF2/ |
WF2 |
WF3 |
WF4 |
WF5 |
WF3 |
IE1 |
0.068 |
0 |
0.048 |
0.017 |
0 |
IE2 |
0.03 |
0.105 |
0 |
0 |
0.32 |
p-value |
WF2/ |
WF2/ |
WF3/ |
WF3/ |
WF4/ |
WF4 |
WF5 |
WF4 |
WF5 |
WF5 |
IE1 |
0.08 |
0 |
0 |
0 |
0 |
IE2 |
0.036 |
0.031 |
0.015 |
0.013 |
0.49 |
Shape parameter and EtCO2
Harmonic distortion (Hd) describes the degree to which a periodic signal deviates from a sinusoid [26]. It is mathematically expressed as:

where Hn is the root-mean-square amplitude of the nth harmonic (found using Fourier decomposition) of the waveform. n = 25 was used as beyond this, changes in Hd was found to be insignificant. Hd was computed for the entire breathing cycle, for the inspiratory phase and then the expiratory phase. EtCO2 correlated better with a product of the inspiratory Hd and the peak inspiratory flow. This product is designated as IDf. The EtCO2 and their corresponding IDf are presented in Figure 5. The Spearman’s correlation coefficient (ρ) and error (2 standard deviations) in the measurement of EtCO2 are also shown in Figure 5. The coefficient of determination (R2) (0.75 and 0.88) and ρ (0.9 and 1) indicate a strong correlation between IDf and EtCO2 (Figure 5). It is not clear what implication this has for breathing.
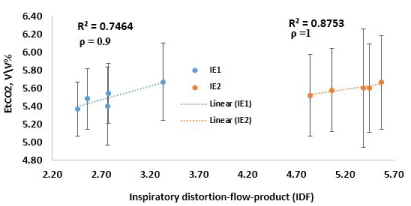
Figure 5. plot of EtCO2 against IDf.
In Equation 2, average[EtCO2]IE2 and average[EtCO2]IE1 are respectively, the average EtCO2 in the IE1-group and IE2-group. Using the formula in Equation 2 the average EtCO2 of the IE2-group was found to be 2% greater than that of the IE1-group. It is concluded that a 35% fall in I:E ratio (percentage
difference between the I:E ratio of 0.67 (IE1-group) and 0.43 (IE2-group)) produces a 2% rise in EtCO2.
2021 Copyright OAT. All rights reserv

The coefficient of variability, defined as the ratio of the standard deviation in EtCO2 within the group to the average EtCO2 was found to be 2% and 1% respectively for the IE1-group and IE2-group.
NHF reduces physiological dead space, respiratory frequency, and improves gas exchange [9-11]. The fall in EtCO2 (≈ 20%) upon the application of 30 L/min of NHF supports the report that NHF improves mixing and reduces the proportion of CO2 in re-inspired dead space air [9,22,23]. The present data suggests that breathing flow waveforms of different patterns, but similar in tidal volume, period and I:E ratio show statistically significant differences in EtCO2. Further, the results indicate that two breathing waveforms that differ only in I:E ratio can produce different EtCO2. If that tidal volume and respiratory rate are fixed, it is more probable to find a statistically significant difference in EtCO2 between a greater I:E ratio group than those of a lower I:E ratio.
To preserve tidal volume, a fall in I:E ratio (longer expiration, shorter inspiration) is matched by a rise in peak inspiratory breathing flow and a fall in peak expiratory breathing flow. In Figure 4, the EtCO2 corresponding to the lower I:E ratio i.e. 0.46 (IE2-group) tended to be greater. Tobin, et al. [24] observed that the inspiratory time (Ti) of 28 COPD subjects (mean age = 67.5 years) was 1 second less than that of healthy adults. Sorli, et al. [27] concluded that CO2 retention (marked by higher EtCO2) in COPD patients is due to shallow breathing, which arises from reduced Ti. This suggests the higher EtCO2 is due to less efficient purging of the dead space during inspiration, i.e. lower ratio of inspired volume to dead space volume resulting in less complete replacement of dead space gas with fresh air (residual volume of expired gas mixes with a smaller volume of fresh gas). This is in unison with the observation by Gorini, et al. [28] who found the highest arterial partial pressure of CO2 amongst COPD patients with the smallest Ti. IE1-group and IE2-group differed in Ti by 0.43 seconds. In the present data, a fall in I:E ratio by 35% (0.67 to 0.43) corresponded to 2% rise in EtCO2. Though the present results agrees qualitatively with findings in the literature [24,27,28] it is concluded that the fall in EtCO2 due to a fall in I:E ratio by 35% is small (2%). The variability in EtCO2 due to flow pattern difference is 1 - 2%. Though statistically significant, it is also small.
The product of inspiratory flow and inspiratory harmonic distortion (IDf) correlate well with EtCO2. The expiratory breathing flow has been reported to be modulated by the inspiratory flow pattern [26]. Inspiratory muscle dysfunction increases EtCO2. Begin, et al. [29] found that airway resistance correlated well with arterial CO2 tension, which also correlates well with EtCO2 [30]. In a study by Loveridge, et al. [31] healthy subjects were observed to show a greater variability in breathing pattern than COPD subjects. Since airway obstruction during COPD influences EtCO2 and the flow pattern, it is speculated that IDf is related to the ventilatory response to CO2 tension.
Limitations of this work
The piston chamber is rigid, unlike the human lung which is compliant (lung compliance is ≈ 200 mL/cmH2O for healthy young adults). Note that a constant bleed rate differs from the physiologically realistic system in which CO2 flow is distributed over time. Also, this work is limited by the number
of breathing flow patterns used.
Breathing patterns similar in tidal volume, respiratory rate, and I:E ratio but differing in shape can produce statistically significant difference in EtCO2 however the variability is small (1 - 2%). A 35% fall in I:E ratio of breathing waveforms with no change in tidal volume and respiratory rate produces
only a 2% rise in EtCO2. NHF of 30 L/min reduces EtCO2 by 20%.
The authors would like to thank the University of Canterbury for a Doctoral Scholarship, Fisher & Paykel Healthcare for the loan of equipment and advice, and MBIE Smart Ideas grant UOAX1403.
- Parot S, Saunier C, Gautier H, Milic-Emili J, Sadoul P (1980) Breathing pattern and hypercapnia in patients with obstructive pulmonary disease. American Review of Respiratory Disease 121: 985-991.
- Calverley PMA (2003) Respiratory failure in chronic obstructive pulmonary disease. European Respiratory Journal 22: 26s-30s.
- Blanch L, Romero PV, Lucangelo U (2006) Volumetric capnography in the mechanically ventilated patient. Minerva Anestesiol 72: 577-586. [Crossref]
- Nagler J, Krauss B (2009) Capnographic monitoring in respiratory emergencies. Clinical Pediatric Emergency Medicine 10: 82-89.
- Manley BJ, Owen LS, Doyle LW, Andersen CC, Cartwright DW, et al. (2013) High-flow nasal cannulae in very preterm infants after extubation. N Engl J Med 369: 1425-1433. [Crossref]
- Motojima Y, Ito M, Oka S, Uchiyama A, Tamura M, et al. (2016) Use of high-flow nasal cannula in neonates: Nationwide survey in Japan. Pediatr Int 58: 308-310. [Crossref]
- Ojha S, Gridley E, Dorling J (2013) Use of heated humidified high-flow nasal cannula oxygen in neonates: a UK wide survey. Acta Paediatr 102: 249-253. [Crossref]
- Ward JJ (2013) High-flow oxygen administration by nasal cannula for adult and perinatal patients. Respir Care 58: 98-122. [Crossref]
- Dysart K, Miller TL, Wolfson MR, Shaffer TH (2009) Research in high flow therapy: mechanisms of action. Respir Med 103: 1400-1405. [Crossref]
- Riera J, Pérez P, Cortés J, Roca O, Masclans JR, et al. (2013) Effect of high-flow nasal cannula and body position on end-expiratory lung volume: a cohort study using electrical impedance tomography. Respir Care 58: 589-596. [Crossref]
- Mündel T, Feng S, Tatkov S, Schneider H (2013) Mechanisms of nasal high flow on ventilation during wakefulness and sleep. J Appl Physiol (1985) 114: 1058-1065. [Crossref]
- Sztrymf B, Messika J, Bertrand F, Hurel D, Leon R, et al. (2011) Beneficial effects of humidified high flow nasal oxygen in critical care patients: a prospective pilot study. Intensive Care Med 37: 1780-1786. [Crossref]
- You B, Peslin R, Duvivier C, Vu VD, Grilliat JP (1994) Expiratory capnography in asthma: evaluation of various shape indices. Eur Respir J 7: 318-323. [Crossref]
- Krauss B, Hess DR (2007) Capnography for procedural sedation and analgesia in the emergency department. Ann Emerg Med 50: 172-181. [Crossref]
- Gluncic TJ, Basara L, Konecki L, Tomic S, Samarzija M, et al. (2015) Capnographic measurement as a screening method for respiratory obstructive diseases. European Respiratory Journal 46: 1039.
- Mieloszyk RJ, Verghese GC, Deitch K, Cooney B, Khalid A, et al. (2014) Automated quantitative analysis of capnogram shape for COPD-normal and COPD-CHF classification. IEEE Trans Biomed Eng 61: 2882-2890. [Crossref]
- Jaffe MB (2006) Volumetric capnography, the next advance in CO2 monitoring. Respironics Inc (Critical Care).
- Colasanti RL, Morris MJ, Madgwick RG, Sutton L, Williams EM (2004) Analysis of tidal breathing profiles in cystic fibrosis and COPD. Chest 125: 901-908. [Crossref]
- Williams EM, Powell T, Eriksen M, Neill P, Colasanti R (2014) A pilot study quantifying the shape of tidal breathing waveforms using centroids in health and COPD. J Clin Monit Comput 28: 67-74. [Crossref]
- Dellacà RL, Santus P, Aliverti A, Stevenson N, Centanni S, et al. (2004) Detection of expiratory flow limitation in COPD using the forced oscillation technique. European Respiratory Journal 23: 232-240.
- Dellacà RL, Pompilio PP, Walker PP, Duffy N, Pedotti A, et al. (2009) Effect of bronchodilation on expiratory flow limitation and resting lung mechanics in COPD. Eur Respir J 33: 1329-1337. [Crossref]
- Van Hove SC, Storey J, Adams C, Dey K, Geoghegan PH, et al. (2016) An experimental and numerical investigation of CO2 distribution in the upper airways during nasal high flow therapy. Ann Biomed Eng 44: 3007-3019. [Crossref]
- Spence CJT, Buchmann NA, Jermy MC (2012) Unsteady flow in the nasal cavity with high flow therapy measured by stereoscopic PIV. Experiments in Fluids 52: 569-579.
- Tobin MJ, Chadha TS, Jenouri G, Birch SJ, Gazeroglu HB, Sackner MA (1983) Breathing patterns. 2. diseased subjects. Chest 84: 286-294. [Crossref]
- Spence CJT, Buchmann NA, Jermy MC, Moore SM (2011) Stereoscopic PIV measurements of flow in the nasal cavity with high flow therapy. Experiments in Fluids 50: 1005-1017.
- Frey U, Silverman M, Suki B (2001) Analysis of the harmonic content of the tidal flow waveforms in infants. J Appl Physiol (1985) 91: 1687-1693. [Crossref]
- Sorli J, Grassino A, Lorange G, Milic-Emili J (1978) Control of breathing in patients with chronic obstructive lung disease. Clin Sci Mol Med 54: 295-304. [Crossref]
- Gorini M, Misuri G, Corrado A, Duranti R, Iandelli I, et al. (1996) Breathing pattern and carbon dioxide retention in severe chronic obstructive pulmonary disease. Thorax 51: 677-683. [Crossref]
- Begin P, Grassino A (1991) Inspiratory muscle dysfunction and chronic hypercapnia in chronic obstructive pulmonary disease. Am Rev Respir Dis 143: 905-912. [Crossref]
- McSwain SD, Hamel DS, Smith PB, Gentile MA, Srinivasan S, et al. (2010) End-tidal and arterial carbon dioxide measurements correlate across all levels of physiologic dead space. Respir Care 55: 288-293. [Crossref]
- Loveridge B, West P, Anthonisen NR, Kryger MH (1984) Breathing patterns in patients with chronic obstructive pulmonary disease. Am Rev Respir Dis 130: 730-733. [Crossref]


