Abstract
Statistics is an extremely useful tool in research. However, selection of an appropriate statistical procedure is a problem that is often encountered. In particular, selection of the appropriate statistical procedure for education research is different from basic research. This difference is due to independence of samples error, meaning that the data include effects of each population. In basic research, effects of each population are reduced in several ways. Accordingly, researchers analyze data of several samples obtained from each population. In education research, researchers often file to decrease effects of each population in some ways. If the sample data is includes differences between each population, there is hierarchy of data. There are a several statistical procedures relevant for the analysis of hierarchical data, such as the hierarchical linear modeling method. In this review, we demonstrated that analysis of data is different in basic research compared to education research, and evaluated the effectiveness of hierarchical linear modeling analysis.
Keywords
statistical procedure, education research, basic research, hierarchical data
Introduction
Recently, several obstacles have been encountered with regard to educating of basic subjects about the study of pharmacy in Japan. As such, several universities established a pharmaceutical education support center in the faculty of pharmaceutical science. In our university, the pharmaceutical education support center was established in the Department of Pharmacy at the School of Pharmacy and Pharmaceutical Science in 2014. We started teaching first and second year students in small-size classes from the 2014 academic year [1]. Several studies have previously demonstrated that reducing class size effectively enhances academic achievement [2,3].
The effects of class size on academic achievement were evaluated by statistical methods that were different from basic research like pharmacology. This is because we need to consider different population factors such as student ability, level of student, level of course, level of regular examination, and other factors in education research. In this review, we focused on different statistical procedures use in education research and basic research.
Procedure of the Reinforcement method in the Mukogawa Women’s University
Students were divided into two classes: the regular class (high proficiency class) and the basic class (low proficiency class), based on achievement in several basic prerequisite subjects related to the study of pharmacy. The staff in the Pharmaceutical Education Support Center reinforced what was taught to students in the basic class [1]. Using this reinforcement method of education, the class size was reduced to approximately 15 students, a quiz was given at the start of each lecture reviewing the previous lesson, and an additional five lectures were conducted, compared to the regular class that received 15 lectures in the 2014 academic year. We evaluated the effects of the reinforcement method of physiology education by recording achievement in pharmacology, a method of teaching that was conducted differently compared to the proficiency-dependent teaching method. The students in the basic class in physiology education were chosen based on achievement levels in anatomy. Achievement levels of pharmacology students in the basic class of physiology compared with students of the same achievement level in anatomy who were not taught using the reinforcement method in the 2013 academic year are summarized in Figure 1.
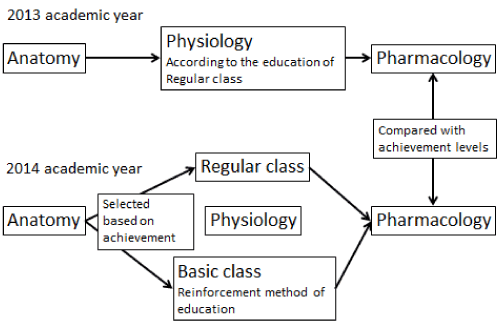
Figure 1: The Proficiency-dependent teaching methodology.
Considering the statistical methods to evaluate the effects of the reinforcement method
The goal of our study was to evaluate the effects of the reinforcement method with regard to academic achievement of subjects. Therefore, we needed to compare between the group of students with proficiency-dependent teaching physiology and the group of students without proficiency-dependent teaching physiology.
The t-test is a traditional statistical method that is typically used in determining statistical significance between two groups. The unpaired t-test can determine the statistical significance of a test should the following criteria be satisfied; 1) the data is sampled from a gauss distribution population, 2) each population has same dispersion or, same standard deviation, 3) the two group of populations are unpaired, 4) the data error is independent, meaning that separate experiments must be conducted in basic research. For example, it is not accurate if each data point is obtained from each well or each plate of a primary culture prepared in one experiment. In our case study, the population for each group had a gauss distribution, similar dispersion and the two groups were unpaired [1].
The unpaired t-test measures a difference in the average of each group. However, comparison of each average alone is not sufficient to evaluate the effects of the reinforcement method on achievement. Similarly, other statistical procedures analyzing differences in average are limitations in education research. We propose a case with a hypothetical achievement distribution graph (Figure 2). There is equalization of the average of groups A, B and C. This result indicates that achievement between each group is not statically different by the unpaired t-test method. However, it is important to focus on the difference in distribution in education research. The distribution of groups B and C show a shift toward students with high achievement, where low achievement students are evident compared with group A. This shift suggests that the reinforcement method teaching has an impact on low proficiency students. Therefore, it is necessary to evaluate data using statistical procedures based on differences in distribution such as the Kolmogorov-Smirnov test.
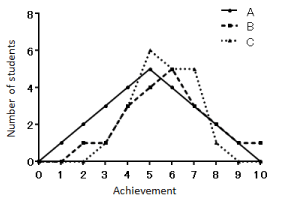
Figure 2: Achievement distribution of each group (dummy data).
Both statistical procedures require that the data error is independent. In our study, it is unclear if the error is independent. We were compared between the group of students in 2013 academic year and 2014 academic year. In this case, we also need to consider differences in regular examination level as it would affects all students in one group. Similarly, we also need to consider differences in student ability, level of student, level of course, and other factors.
Considering the effects of different factors on statistical methods
Organizing data into subgroups is often helpful to consider the effects of different factors. This method is commonly applied in clinical research. For example, Ridker, et al. investigated whether lowering LDL cholesterol would prevent heart disease in patients who did not have high LDL concentrations or a prior history of heart disease [4]. The study included almost 18,000 people where half received a statin drug to lower LDL cholesterol while the other half received a placebo drug. They compared the number of “end points” that occurred in the two groups, and then analyzed each of the “end points” separately. Separate analyses were done for men and women, old and young, smokers and nonsmokers, those with and without hypertension, those with and without a family history of heart disease. In each of the 25 subgroups, patients receiving the drug experienced fewer primary “end points” than those taking placebo, and all these effects were statistically significant. All the comparisons result in the same conclusion, that is people taking the drug experienced less cardiovascular disease than those on the placebo.
This method is an enticing yet difficult choice. This is because all analyses were planned and conducted and were taken into account when interpreting the results. In our study, we did not try different ways to separate the data into subgroups. Moreover, analyzing multiple subgroups of data is a form of multiple comparisons. Problems arising in the analysis of multiple subgroups have been previously reported [5]. A simulated study was planned such that a group of real patients with coronary artery disease were randomly divided into two groups. In the real study, they would give the two groups different treatments and compare survival. In this simulated study, they treated the subjects identically but analyzed the data as if the two random groups represented two distinct treatments. As expected, the survival of the two groups was indistinguishable. Next, the patients were divided into six groups depending on whether they had disease in one, two, or three coronary arteries, and whether the heart ventricle contracted normally. After analysis, a striking result was found among the sickest patients. However, this was not a real study, and the two “treatments” reflected only random assignment of patients. In this case, there was a 26% chance that one of six independent comparisons would have a P value less than 0.05, even if all null hypotheses are true. This simulated study indicated that the analysis of multiple subgroups is not defined in advance; it becomes a form of indetermination.
Considering the effectiveness of hierarchical linear modeling analysis in education research
Our data weaves the effects of students with effects of student ability, level of student; level of course, level of regular examination etc. This means that the data contains information on both the personal unit and group unit. This condition is known as the hierarchy of data. In basic research, effects of the group unit are as reduced as much as possible. For example, researchers use inbred strains of mouse, reagents from the same lot number, and conduct experiments at the same time each day. In education research, researchers are unable to use these avenues to minimize effects from such variables (Figure 3).
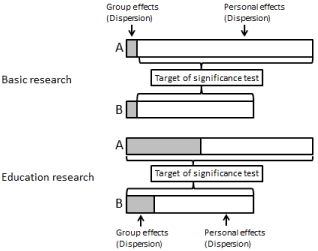
Figure 3: The differences between data of basic research and education research.
The hierarchical linear modeling analysis is one of several multilevel analyses that are suitable for analysis of hierarchical data [6]. Hierarchical data include important problems such as the error not being independent. Therefore, it is imperative that hierarchical data with the effects of both personal and group units are analyzed at once by the hierarchical linear modeling analysis. In our study, we checked whether the data was hierarchical by investigating intra-class correlation coefficient (ICC) dispersion of group unit / dispersion of whole data. If the ICC was low, we could select numerous statistical procedures from the “normal method”. An ICC of 0.066 was obtained from the analysis of achievement in pharmacology of the 2013 and 2014 academic year. This result indicated that the 6.6 % of difference in achievement in pharmacology between the group from 2013 and 2014 academic year depended on effects of the group unit. This ICC level could not be ignored and as such, our data was determined to be hierarchical data. The calculation of hierarchical linear modeling analysis is summarized in Eq. (1).
Achievement of pharmacology = Intercept (fixed-effects) + Regression coefficient (fixed-effects) × Achievement of anatomy + Intercept (random) + Regression coefficient (random) × Achievement of anatomy + Residual error Eq. (1)
The fixed-effects indicate an average. The random intercept and regression coefficient indicate the average effect of the whole sample and dispersion of effects of each group at once (Figure 4). Variable number added in Eq. (1) to investigate effects of reinforcement method education. The variable number was that reinforcement method education class was “1” and other class was “0”. The calculation of hierarchical linear modeling analysis is summarized in Eq. (2) after addition of the new variable number and correction.
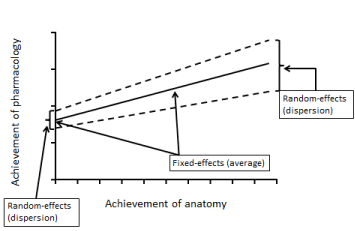
Figure 4: Hierarchical linear modeling graph (dummy data).
Achievement of pharmacology = Intercept (fixed-effects) + Regression coefficient (fixed-effects) × Achievement of anatomy + Intercept (correction) × variable number + Regression coefficient (correction) × Achievement of anatomy × variable number + Intercept (random) + Regression coefficient (random) × Achievement of anatomy + Residual error Eq.(2)
We propose a case of a hypothetical graph of results of hierarchical linear modeling analysis in Figure 5. This hypothetical result suggests that the reinforcement method improves the academic achievement of pharmacology in students with a low proficiency of anatomy.
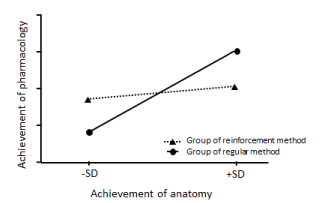
Figure 5: Hierarchical linear modeling graph after correction (dummy data).
Conclusion
We demonstrated that the largest difference between data of basic research and education research is whether the error is independent of error or not. This difference is critical in determining selection of statistical methodology. In education research, this problem is often encountered and it is highly likely that basic researchers will also encounter a similar problem in the future. Statistics is an extremely useful tool for research. However, careful selection of appropriate statistical tools is imperative for "if you torture your data long enough, they will tell you whatever you want to hear
References
2021 Copyright OAT. All rights reserv
- Kitayama T, Kagota S, Yoshikawa N, Kawai N, Nishimura K, et al. (2016) Effects of reinforcement method of dissection physiology education on the achievement in pharmacology. Yakugaku Zasshi 136: 1651-1656. [CrossRef]
- Kokkelenberg EC, Dillon M, Christy SM (2008) The effects of class size on student grades at a public university. Econom Educ Rev 27: 221-233.
- Nye B, Hedges LV, Konstantopoulos S (1999) The long-term effects of small classes: A five-year follow-up of the tennessee class size experiment. Educ Eval Policy Anal 21: 127-142.
- Ridker PM, Danielson E, Fonseca FA, Genest J, Gotto AM Jr, et al. (2008) Rosuvastatin to prevent vascular events in men and women with elevated C-reactive protein. N Engl J Med 359: 2195-2207. [CrossRef]
- Lee KL, McNeer JF, Starmer CF, Harris PJ, Rosati RA (1980) Clinical judgment and statistics. Lessons from a simulated randomized trial in coronary artery disease. Circulation 61: 508-515. [CrossRef]
- Raudenbush SW, Bryk AS (2002) Hierarchical linear model: Applications and data analysis methods, 2nd ed., SAGA Publications, Inc., Thousand Oaks.
- Mills JL (1993) Data torturing. N Engl J Med 329: 1196-1199. [CrossRef]


