Background: In patients with hepatitis, it is important to identify drug-induced metabolic effects to improve diagnosis and treatment. Therefore, in this study, we aimed to determine the effects of sofosbuvir-based therapy on the metabolic status of patients with chronic hepatitis C virus (HCV) infection.
Materials and Methods: In this observational before-after study, a total of 128 consecutive patients with chronic HCV infection, presenting to the Middle East Liver Disease Center (MELD) in Tehran, Iran, were enrolled. Metabolic indices, including triglyceride, total cholesterol, low-density lipoprotein (LDL), high-density lipoprotein (HDL), and fasting blood sugar (FBS), were determined before and after sofosbuvir-based therapy.
Results: The mean FBS level was 108.3±33.8 and 106.2±36.4 mg/dL before and after treatment, respectively (P>0.05). Also, the mean triglyceride level was 101.8±46.4 and 110.5±54.8 mg/dL before and after treatment, respectively (P=0.03). The findings showed that the mean total cholesterol level was 150.9±34.9 and 168.0±40 mg/dL before and after treatment, respectively (P=0.001). Also, the mean LDL-cholesterol level was 82.4±27.5 and 95.8±31.6 mg/dL before and after treatment (P=0.001), and the mean HDL-cholesterol was 44.1±13.1 and 46.9±13.4 mg/dL before and after treatment, respectively (P=0.01).
Conclusion: According to the results, it can be concluded that sofosbuvir-based therapy has effects on some metabolic parameters (lipid profile and blood glucose) of chronic HCV patients. Therefore, development of preventive strategies to reduce the burden of this disease seems necessary.
metabolic status, hepatitis C, sofosbuvir, lipid level, fasting serum glucose, hepatitis, treatment
Hepatitis C virus (HCV) infection is a common infectious disease, affecting 71 million people worldwide. The prevalence of HCV infection is increasing globally, despite differences in the prevalence rates reported from different regions [1,2]. Evidence shows that HCV has infected around 1.6% of the world population [3]. In Iran, the seroprevalence of HCV infection varies considerably in different provinces, ranging from 0.08% to 1.6% [4]. The prevalence of HCV antibody is estimated at 0.5% in the general population of Iran, and HCV genotype 1 is recognized as the most common circulating genotype in the country [5,6].
Treatment of HCV infection has significantly changed in recent years. With the introduction of direct-acting antiviral agents (DAAs) in 2011, contribution of pegylated interferon (Peg-IFN) and ribavirin (RBV) decreased in HCV antiviral regimens [7-11]. Sofosbuvir is generally an HCV NS5B polymerase inhibitor and a nucleotide analog active against all HCV genotypes. On the other hand, ledipasvir, an HCV NS5A inhibitor, is mostly active against HCV-1 and HCV-4.
The 12-week SOF/LDV regimen showed more than 95% efficacy in most HCV patients, especially those without cirrhosis and/or history of treatment [11]. This regimen was efficacious and safe in the treatment of chronic HCV infection in Iranian patients, and the generic form of the regimen could be used as an alternative to the brand-name drug (SOF/LDV), with the same rate of response [11].
Despite some therapeutic advances, chronic HCV is the main cause of liver disease and transplantation [10]. HCV may result in some alterations in insulin resistance and dyslipidemia [12,13]. It is also accompanied by glucose intolerance and diabetes progression [14-16]. The association between HCV and insulin resistance is multifactorial, especially due to cytokine upregulation and direct interactions between viral particles and return pathways [17-21]. It is also associated with steatosis of unknown etiology [22], which may be attributed to the use of LDL by the virus for contamination of hepatocytes; also, other lipid secretion mechanisms can result in viral replication [14].
Some proteins, such as seipine and HCV core protein, alter the production of free fatty acids, resulting in fatty liver by changes in lipid secretion [23,24]. Hypercholesterolemia is another condition, which seems to be related to HCV replication. Overall, identification of drug-induced metabolic effects is important to improve the diagnosis and treatment of patients with HCV [27-31]. Therefore, in this study, we aimed to determine the effects of sofosbuvir-based therapy on lipid profile and blood glucose of HCV patients.
In this historical cohort study, a total of 823 consecutive patients with HCV, presenting to the Middle East Liver Disease Center (MELD) of Tehran, Iran, were enrolled within 2016 - 2018. 128 patients out of 823 patients were included in this study. The exclusion criteria were diagnosis of HIV, hemochromatosis, Wilson's disease, alcoholic liver disease and other comorbid hepatitis infections. The study protocol was approved by the local ethics committee of Iran University of Medical Sciences. The ethic approval code was IR.IUMS.FMD.REC 1397.086.
Metabolic parameters, including triglyceride, total cholesterol, low-density lipoprotein (LDL), high-density lipoprotein (HDL), and fasting blood sugar (FBS), were determined before and after sofosbuvir-based therapy.
FBS closest to starting day of HCV therapy (up to 2 months pre and post therapy) were included in our analysis. Patients with diabetes mellitus type 2, prior to starting HCV therapy, during therapy, and up to 2 months post therapy were reviewed, looking for adjustments of medications that could have altered FBS. Those patients who started a medication or had an adjustment of baseline treatment were removed from the analysis. Patients that was on stable doses of oral hypoglycemic medications or insulin regimens during the study period were included.
Lipid profile closest to the starting and end dates of therapy (up to 2 months pre and post therapy) were included. Patients on stable doses of lipid-lowering medications were included, while patients started on new medications or with adjustments during the study period were excluded from the analysis.
Basic demographic information was collected for all patients, including age, gender, body-mass index (BMI), and specific HCV anti-viral therapy used. Pre-therapy Hepatitis C genotype we also included.
After data collection, statistical analysis was performed in SPSS version 23.0. In this study, frequency and rate were reported for categorical variables and mean and standard deviation for numerical variables. Paired sample t-test, Chi-square, and ANOVA tests were also used for statistical analysis, and P-value less than 0.05 was considered statistically significant.
Eighty-three (64.8%) participants were male in this study. The mean age of the participants was 54.89±10.81 years, ranging from 24 to 77 years. Cirrhosis was reported in 70 (54.7%) participants. The mean total BMI was 26±4.7 kg/m², and the prevalence of overweight, obesity, and morbid obesity was 24.2%, 12.5%, and 3.9%, respectively. The frequency of HCV genotypes is shown in Table 1. Genotype 1a was the most common genotype in this study (Table 1).
Table 1. Frequency of various HCV genotypes in patients
Genotype |
Frequency |
Percentage |
None |
7 |
5.5 |
1a |
54 |
42.2 |
1b |
11 |
8.6 |
1a/b |
26 |
20.3 |
3a |
27 |
21.1 |
4a |
3 |
2.3 |
Total |
128 |
100.0 |
According to the results of Chi-square test, HCV genotype was not associated with cirrhosis (P>0.05). Also, the frequency of genotypes was not associated with gender (P>0.05) (Figure 1). Moreover, the frequency distribution of cirrhosis was not significant in terms of gender.
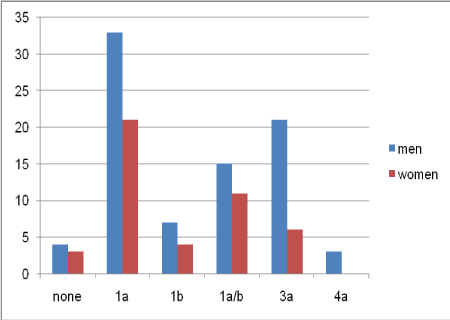
Figure 1. Frequency of HCV genotypes in terms of gender
As shown in Figure 2, the mean FBS was 108.3±33.8 and 106.2±36.4 mg/dL before and after treatment, respectively (P>0.05). Also, the mean triglyceride level was 101.8 ±46.4 and 110.5±54.8 mg/dL before and after treatment, respectively (P=0.03). The mean total cholesterol level was 150.9±34.9 and 168.02±40.2 mg/dL before and after treatment, respectively (P=0.001). Moreover, the mean LDL-cholesterol level was 82.4±27.5 and 95.8±31.6 mg/dL before and after treatment, respectively (P=0.001). The results also showed that the mean HDL-cholesterol level was 44.1±13.1 and 46.9±13.4 mg/dL before and after treatment, respectively (P=0.01).
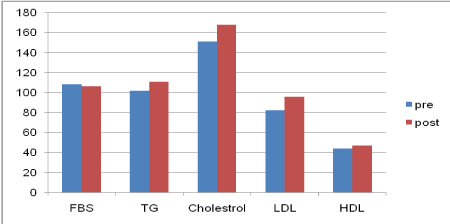
Figure 2. Metabolic status before and after treatment
Figure 3 presents the mean metabolic status before and after treatment in cirrhotic and non-cirrhotic HCV patients. The mean FBS in cirrhotic and non-cirrhotic patients before and after treatment as stated in the Figure 3, respectively (P>0.05). The mean total cholesterol and LDL in cirrhotic and non-cirrhotic patients before and after treatment as stated in the Figure 3, respectively (P=0.001). Moreover, the mean TG level in non-cirrhotic patients was 98.08±39.2 and 118.50±63.2 before and after treatment, respectively (P=0.002). Also, the mean HDL in cirrhotic patients was 43.21±10.8 and 47.17±12.8 before and after treatment, respectively (P=0.01).
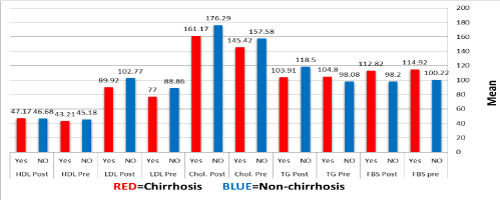
Figure 3. Metabolic status before and after treatment with respect to cirrhosis
The findings showed that HCV genotypes and BMI were not correlated (P>0.05). Similarly, FBS and metabolic alterations were not correlated (P>0.05), whereas in some BMI groups, the lipid profile significantly changed by treatment with regard to BMI (Table 2).
Table 2. Metabolic alterations in terms of BMI
BMI (kg/m2) |
|
Mean |
Standard deviation |
P-value |
|
20-25 |
TG before |
97.39 |
44.57 |
0.013 |
TG after |
111.60 |
52.16 |
|
|
20-25 |
Chol. before |
146.92 |
37.07 |
0.000 |
Chol. after |
166.79 |
45.55 |
|
|
26-30 |
Chol. before |
156.29 |
31.19 |
0.001 |
Chol. after |
171.32 |
34.80 |
|
|
31-35 |
Chol. before |
149.50 |
26.19 |
0.000 |
Chol. after |
170.18 |
29.36 |
|
|
20-25 |
LDL before |
80.22 |
29.36 |
0.000 |
LDL after |
92.66 |
35.65 |
|
|
26-30 |
LDL before |
86.06 |
24.08 |
0.000 |
LDL after |
105.41 |
26.95 |
|
|
31-35 |
LDL before |
82.62 |
18.72 |
0.000 |
LDL after |
97.12 |
20.98 |
|
|
20-25 |
HDL before |
43.46 |
11.59 |
0.014 |
HDL after |
46.80 |
12.78 |
|
TG: Triglyceride, Chol: Cholestrol, LDL: Low density lipoprotein, HDL: High density lipoprotein
Evaluation of drug-induced metabolic alterations in patients with HCV infection can help decrease the burden of disease in patients under sofosbuvir-based therapy. Based on our findings, FBS showed no significant change, while lipid profiles exhibited significant alterations, which were more evident by controlling for some variables, such as BMI. In this regard, Kawaguchi et al. [32] reported that HCV is accompanied by insulin resistance, dyslipidemia, fatty liver disease, and iron overload.
Morales et al. [33], in a study on 234 patients with HCV under sofosbuvir-based therapy, showed that dyslipidemia developed after treatment, and changes occurred in total and LDL cholesterol levels, besides some minimal changes in HbA1C. The levels of LDL and cholesterol were also different in our study, while no FBS changes were observed. In addition, Vespasiani-Gentilucci et al. [34] in a review study reported that there are different mechanisms involved in metabolic alterations following the use of sofosbuvir. Considering these differences, major changes occurred in multiple metabolic factors in our study. Additionally, a before-after study by Doyle et al. [35] on 24 patients with HCV showed that sofosbuvir and ribavirin caused alterations in the lipid profile, but not FBS or insulin resistance, as reported in our study.
Consistent with our research, a cohort study by Inoue et al. [36] on 170 patients with HCV showed that total and LDL cholesterols increased after sofosbuvir-based therapy. Furthermore, Kanda et al. [37] in their review study reported that sofosbuvir-containing regimens could result in an increase in the lipid profile of HCV patients, especially LDL and total cholesterol. A cohort study by Endo et al. [38] among 276 patients also indicated a similar significant increase in LDL and total cholesterol.
Furthermore, Mauss et al. [39] assessed 250 HCV patients and reported that IFN regimens led to a triglyceride increase, while sofosbuvir regimens led to an increase in total and LDL cholesterol levels; however, HDL showed no significant alterations. On the other hand, in our study, HDL-cholesterol level changed. In this regard, El Sagheer et al. [40] assessed 80 patients with HCV and found that sofosbuvir induced a reduction in triglyceride and FBS levels and increased the levels of LDL and total cholesterol. Nevertheless, in the present study, the level of triglyceride increased. Our findings also showed that FBS decreased, although it was of no statistical significance.
According to the results of the present study, sofosbuvir-based therapy can have unfavorable effects on the metabolic status of HCV patients; therefore, we must consider the lipid profile, blood sugar level, and cardiovascular status of these patients before treatment. Also, development of preventive strategies to reduce the burden of this disease seems necessary. However, further studies with a larger sample size and multi-center sampling can present more definite results in this area.
In this study there were at least two limitations. The first limitation was that it was performed in only one center and the second limitation was the number of patients who were enrolled in this study.
The authors express their gratitude to the staff of MELD center.
Authors’ contributions:
Study concept and design: Mitra Ranjbar and Ahmad Hezarjaribi; acquisition of data: all authors; statistical analysis and interpretation of data: Ahmad Hezarjaribi; drafting of the manuscript: Ahmad Hezarjaribi; critical revision of the manuscript for important intellectual content: Seyed Moayed Alavian, Mitra Ranjbar, and Ahmad Hezarjaribi; and study supervision: Seyed Moayed Alavian and Mitra Ranjbar. All authors read and approved the final version of the manuscript.
Funding/support:
This study was funded and supported by Iran University of Medical Sciences.
Conflict of interest:
The authors declare no conflicts of interest regarding the publication of this study.
- Global Burden of Hepatitis C Working Group (2004) Global burden of disease (GBD) for hepatitis C. J Clin Pharmacol 44: 20-29. [Crossref]
- Bellentani S, Miglioli L, Bedogni G, Croce LS, Tiribelli C (2005) Epidemiology of hepatitis C virus infection. Minerva Gastroenterol Dietol 51: 15-29.
- Gower E, Estes C, Blach S, Razavi-Shearer K, Razavi H (2014) Global epidemiology and genotype distribution of the hepatitis C virus infection. J Hepatol 61: S45-57.
- Mirminachi B, Mohammadi Z, Merat S, Neishabouri A, Sharifi AH, et al. (2017) Update on the prevalence of hepatitis C virus infection among iranian general population: A systematic review and meta-analysis. Hepat Mon 17: e42291.
- Ghaderi-Zefrehi H, Gholami-Fesharaki M, Sharafi H, Sadeghi F, Alavian SM (2016) The distribution of hepatitis c virus genotypes in Middle Eastern countries: A systematic review and meta-analysis. Hepat Mon 16: e40357.
- Hesamizadeh K, Alavian SM, Najafi Tireh Shabankareh A, Sharafi H (2016) Molecular tracing of hepatitis C virus genotype 1 isolates in Iran: A NS5B phylogenetic analysis with systematic review. Hepat Mon 16: e42938.
- Wang CC, Krantz E, Klarquist J, Krows M, McBride L, et al. (2007) Acute hepatitis C in a contemporary US cohort: modes of acquisition and factors influencing viral clearance. J Infect Dis 196: 1474-82.
- Basseri B, Yamini D, Chee G, Enayati PD, Tran T, et al. (2010) Comorbidities associated with the increasing burden of hepatitis C infection. Liver Int 30: 1012-1018.
- No authors listed (2002) NIH Consensus Statement on Management of Hepatitis C: 2002. NIH Consens State Sci Statements 19: 1-46. [Crossref]
- Ghany MG, Strader DB, Thomas DL, Seeff LB, American Association for the Study of Liver D (2009) Diagnosis, management, and treatment of hepatitis C: An update. Hepatology 49: 1335-1374.
- Sharafi H, Nikbin M, Alavian SH, Behnava B, Alavian SM (2017) Efficacy and safety of generic sofosbuvir/ledipasvir fixed-dose combination in iranian patients with chronic hepatitis C virus infection. Hepat Mon 17: e12216.
- Moucari R, Asselah T, Cazals-Hatem D, Voitot H, Boyer N, et al. (2008) Insulin resistance in chronic hepatitis C: Association with genotypes 1 and 4, serum HCV RNA level, and liver fibrosis. Gastroenterology 134: 416-423.
- Negro F (2010) Abnormalities of lipid metabolism in hepatitis C virus infection. Gut 59: 1279-1287. [Crossref]
- Mehta SH, Brancati FL, Strathdee SA, Pankow JS, Netski D, et al. (2003) Hepatitis C virus infection and incident type 2 diabetes. Hepatology 38: 50-56. [Crossref]
- Mehta SH, Brancati FL, Sulkowski MS, Strathdee SA, Szklo M, et al. (2000) Prevalence of type 2 diabetes mellitus among persons with hepatitis C virus infection in the United States. Ann Intern Med 133: 592-599.
- Huang JF, Yu ML, Dai CY, Hsieh MY, Hwang SJ, et al. (2008) Reappraisal of the characteristics of glucose abnormalities in patients with chronic hepatitis C infection. Am J Gastroenterol 103: 1933-1940.
- Nelson DR, Lim HL, Marousis CG, Fang JW, Davis GL, et al. (1997) Activation of tumor necrosis factor-alpha system in chronic hepatitis C virus infection. Dig Dis Sci 42: 2487-94.
- Bernsmeier C, Duong FH, Christen V, Pugnale P, Negro F, et al. (2008) Virus-induced over-expression of protein phosphatase 2A inhibits insulin signalling in chronic hepatitis C. J Hepatol 49: 429-440.
- Dai CY, Huang JF, Hsieh MY, Hou NJ, Lin ZY, et al. (2009) Insulin resistance predicts response to peginterferon-alpha/ribavirin combination therapy in chronic hepatitis C patients. J Hepatol 50: 712-718.
- Kawaguchi T, Ide T, Taniguchi E, Hirano E, Itou M, et al. (2007) Clearance of HCV improves insulin resistance, beta-cell function, and hepatic expression of insulin receptor substrate 1 and 2. Am J Gastroenterol 102: 570-576.
- Thompson AJ, Patel K, Chuang WL, Lawitz EJ, Rodriguez-Torres M, et al. (2012) Viral clearance is associated with improved insulin resistance in genotype 1 chronic hepatitis C but not genotype 2/3. Gut 61: 128-134.
- Adinolfi LE, Gambardella M, Andreana A, Tripodi MF, Utili R, et al. (2001) Steatosis accelerates the progression of liver damage of chronic hepatitis C patients and correlates with specific HCV genotype and visceral obesity. Hepatology 33: 1358-1364.
- Perlemuter G, Sabile A, Letteron P, Vona G, Topilco A, et al. (2002) Hepatitis C virus core protein inhibits microsomal triglyceride transfer protein activity and very low density lipoprotein secretion: A model of viral-related steatosis. FASEB J 16: 185-194.
- Syed GH, Amako Y, Siddiqui A (2010) Hepatitis C virus hijacks host lipid metabolism. Trends Endocrinol Metab 21: 33-40.
- Chang ML, Tsou YK, Hu TH, Lin CH, Lin WR, et al. (2014) Distinct patterns of the lipid alterations between genotype 1 and 2 chronic hepatitis C patients after viral clearance. PLoS One 9: e104783.
- Kuo YH, Chuang TW, Hung CH, Chen CH, Wang JH, et al. (2011) Reversal of hypolipidemia in chronic hepatitis C patients after successful antiviral therapy. J Formos Med Assoc 110: 363-371.
- Talaat M, Afifi S, Reaves EJ, Abu Elsood H, El-Gohary A, et al. (2019) Evidence of sustained reductions in the relative risk of acute hepatitis B and C virus infections, and the increasing burden of hepatitis a virus infection in Egypt: Comparison of sentinel acute viral hepatitis surveillance results, 2001-17. BMC Infect Dis 19: 159.
- Popping S, Bade D, Boucher C, van der Valk M, El-Sayed M, et al. (2019) The global campaign to eliminate HBV and HCV infection: International viral hepatitis elimination meeting and core indicators for development towards the 2030 elimination goals. J Virus Erad 5: 60-66.
- Wilkins T, Sams R, Carpenter M (2019) Hepatitis B: Screening, prevention, diagnosis, and treatment. Am Fam Physician 99: 314-323.
- Tang LSY, Covert E, Wilson E, Kottilil S (2018) Chronic hepatitis B infection: A review. JAMA 319: 1802-1813. [Crossref]
- Liu CH, Su TH, Liu CJ, Hong CM, Yang HC, et al. (2019) Sofosbuvir-based direct acting antiviral therapies for patients with hepatitis C virus genotype 2 infection. J Gastroenterol Hepatol.
- Kawaguchi Y, Mizuta T (2014) Interaction between hepatitis C virus and metabolic factors. World J Gastroenterol 20: 2888-2901.
- Morales AL, Junga Z, Singla MB, Sjogren M, Torres D (2016) Hepatitis C eradication with sofosbuvir leads to significant metabolic changes. World J Hepatol 8: 1557-1563.
- Vespasiani-Gentilucci U, Galati G, Gallo P, De Vincentis A, Riva E, et al. (2015) Hepatitis C treatment in the elderly: New possibilities and controversies towards interferon-free regimens. World J Gastroenterol 21: 7412-7426.
- Doyle MA, Galanakis C, Mulvihill E, Crawley A, Cooper CL (2019) Hepatitis C direct acting antivirals and ribavirin modify lipid but not glucose parameters. Cells 8.
- Inoue T, Goto T, Iio E, Matsunami K, Fujiwara K, et al. (2018) Changes in serum lipid profiles caused by three regimens of interferon-free direct-acting antivirals for patients infected with hepatitis C virus. Hepatol Res 48: E203-E212.
- Kanda T, Moriyama M (2017) Direct-acting antiviral agents against hepatitis C virus and lipid metabolism. World J Gastroenterol 23: 5645-5649.
- Endo D, Satoh K, Shimada N, Hokari A, Aizawa Y (2017) Impact of interferon-free antivirus therapy on lipid profiles in patients with chronic hepatitis C genotype 1b. World J Gastroenterol 23: 2355-2364.
- Mauss S, Berger F, Wehmeyer MH, Ingiliz P, Hueppe D, et al. (2017) Effect of antiviral therapy for HCV on lipid levels. Antivir Ther 21: 81-88.
- El Sagheer G, Soliman E, Ahmad A, Hamdy L (2018) Study of changes in lipid profile and insulin resistance in Egyptian patients with chronic hepatitis C genotype 4 in the era of DAAs. Libyan J Med 13: 1435124.