Abstract
In this work, we report the development of an impedimetric biosensor for the direct, quick, and easy diagnosis of chronic Q fever. The biosensor is based on highly sensitive antigens that can recognize selectively antibodies against Coxiella burnetii. The biosensor was developed via immobilization of antigens onto a gold electrode using EDC/NHS immobilization methodology. The detection is performed via impedance spectroscopy that monitors specific frequencies which provide the maximum sensitivity for the biosensor. Q fever antibodies that are present in the sera of patients interact selectively with the biosensor antigens, altering the impedance of the biosensor surface, thus generating a large impedance change within seconds. The biosensor allows for the specific serological detection of chronic Q fever, while the developed system can also be modified for the detection of other biomarkers, such as the ones against acute Q fever.
Keywords
Coxiella burnetii; Q fever; chronic Q fever; electrocemical biosensor; diagnostic tool; immunosensor; impedance spectroscopy
Introduction
Coxiella burnetii is an obligate intracellular bacterial pathogen with a worldwide distribution that causes Q fever infection [1]. The clinical forms have been described as acute and chronic Q fever disease. Generally, acute Q fever is mild and self-limiting, with a variety of symptoms, the common of which are fever and fatigue. This influenza-like manifestation of the disease often leads to low clinical suspicion for detection of the pathogen since samples are analyzed several days post contact with the pathogen and after the onset of symptoms [2]. On the other hand, chronic Q fever is a life-risking disease, with symptoms ranging from endocarditis to chronic hepatitis or chronic vascular infections [3]. In the case of the chronic form of the disease, early and accurate diagnosis is vital for the protection of the patients’ health, as it can be lethal if it remains untreated [1]. However, early diagnosis of Q fever is a challenging task, considering the limitation of the current diagnostic methodologies [1,3–5].
The accuracy of diagnosis of chronic Q fever delivered by the existing methodologies is very low, ranging from 33% to 64%, rendering these methods nonspecific for the diagnosis of the chronic form of the disease. The detection of chronic Q fever in blood or tissues can also be achieved by culturing the bacterium, however, this method is only 50-60% efficient. For these reasons, the most widely used diagnostic method for the disease is the one based on serology, since following infection, IgG antibodies are persistent in the blood for months or even years [3,4].
The laboratory serological methods for Q fever diagnosis include indirect immune fluorescence assay (IFA), enzyme-linked immunosorbent assay (ELISA) and complement fixation [3,4]. Although the IFA is the current gold standard serologic assay for Q fever, all above- mentioned techniques have several limitations. The limitations include large sample/reagent volume requirements, complex protocols, and large variability in the analytical specifications among laboratories [5]. In addition, all methods are based on the antigen obtained from C. burnetii, which is hazardous and difficult to handle since specialized equipment and BSL3 safety level facilities are required [1]. The inherent complexity of whole cell antigen production, as well as the subjective nature of the IFA lead to inconsistencies in test results.
A diagnostic assay based on recombinant proteins would overcome the above-mentioned difficulties, while it would improve the test efficacy. Several immunoproteomic studies on C. burnetii have been reported based on several seroreactive proteins, but only a few of them have been validated by ELISA [6–10]. Recent work in our laboratory resulted in the successful expansion of a subset of C. burnetii immunoreactive proteins, which have been validated by ELISA [11–14]. Out of a series of such proteins, CBU_1910 (Com1) and CBU_1718 (GroEL) demonstrated high sensitivity and specificity to chronic Q fever diagnosis and are thus utilized for the development of new Q fever electrochemical impedance spectroscopy based biosensors [13,14].
Electrochemical Impedance Spectroscopy (EIS) is a very sensitive and accurate surface monitoring technique for the detection of antigen-antibody interaction and thus it can be used for the development of specific, highly accurate immunosensors. EIS – based biosensors have already found several applications as diagnostic tools [15–21], assuring simplicity, sensitivity, and specificity. In this work, we describe the development of a highly accurate and selective electrochemical immunosensor for the rapid diagnosis of chronic Q fever. It is based on the immobilization of CBU_1718 (GroEL) protein onto a modified gold electrode. The direct interaction between the immobilized antigen and chronic Q fever antibodies is monitored by EIS. The high selectivity of the resulting biosensor over that of the chronic Q fever antibodies makes it an ideal system for the diagnosis of the infection.
Materials and methods
Antigen production
Production of the GroEL protein (CBU_1718) was achieved as recently described by Psaroulaki et al. [13]. Briefly, CBU_1718 gene was amplified from C. burnetii Nine Mile Phase I genomic DNA by PCR. The PCR product was then ligated into pET-22b(+) expression vector and afterwards this vector was transformed into E. coli BL21 (DE3) cells. For antigen expression, the transformed E. coli cells were cultured at 37οC, and at an OD600 of 0.5 the protein expression was induced with 1 mM isopropyl β-D-1-thiogalactopyranoside (IPTG). The cells were harvested four (4) hours after induction. The isolation and purification of the protein was carried out using Ni-NTA affinity chromatography, as the protein carried the 6xHis tag at its C-terminus [13]. The purity of the isolated protein was tested by 12% acrylamide gel followed by Coomassie blue staining and Western blot using a monoclonal anti-poly-histidine alkaline phosphatase conjugated antibody (Sigma). Protein concentration was estimated by the BCA assay and the isolated protein was stored at -40 οC.
Antigen quality test
The diagnostic ability of the isolated GroEL protein was tested by Western blot and Enzyme‑linked immunosorbent assay (ELISA). Sera from patients positive with acute or chronic Q fever, as well as sera from healthy individuals were used to evaluate GroEL’s effectiveness in chronic Q fever diagnosis. Sera were tested for IFA using commercially available IFA slides (Focus Diagnostics) that can test both for phase I and phase II IgM and IgG C. burnetii antibodies. The IFA testing occurred at the laboratory of Clinical Microbiology and Microbial Pathogenesis, National Reference center for the laboratory diagnosis of C. burnetii infection. Patient sera under the suspicion of C. burnetii infection are received daily due to the nature of the laboratory. Sera from healthy blood donors had been collected in past studies of the laboratory [12–14]. All sera used in the particular study were obtained after 2018.Titers of ≥1/1.920 for IgG or 1/480 for IgG together with 1/200 for IgM were considered as cut-offs for acute phase infection; the cut-off of ≥1/1,024 was considered as positive for chronic Q fever. The cut-offs of acute infection were based on past studies of the laboratory [13], while that of chronic Q fever was based on the guidelines for the diagnosis of this infection. In the Western blot, AP-conjugated anti-Human IgG was used as a secondary antibody, while the use of 5-bromo-4-chloro-3-indolyl phosphate (BCIP) and nitroblue tetrazolium (NBT) developed a reaction with a colorful product.
ELISA was performed on Microtiter flat bottom plates (96 wells, Corning Costar). The purified antigen was coated at a concentration of 1 µg/ml by incubating at 4°C overnight in coating buffer (50 mM Na2CO3, 50 mM NaHCO3, pH 9.6). Plates were washed with PBST washing buffer (phosphate-buffered saline + 0.05% v/v Tween 20) and the wells were blocked with blocking buffer (PBST with 1% w/v bovine serum albumin) at 37°C for 1h. After the blocking step, the plates were incubated with sera from patients and from healthy individuals (1:500 in PBST) at 37°C for 1 h. Afterwards, they were washed three times with washing buffer and were incubated with rabbit anti-human IgG (Boster Biological Technology) with peroxidase as a conjugate (1:3000 in blocking buffer) at 37°C for 1 h. Next, the wells were washed three times and were incubated with a solution of substrate/chromogen for 10 min (TMB Core, BioRad, California, USA). The colorimetric reaction was stopped by adding 0.5 M H2SO4 and the optical density was read at 490 nm on a microplate reader (Multiskan FC, Thermo Scientific, Ratastie Finland).
Gold electrode modification and antigen immobilization
All gold electrodes (Methrom, disposable SPEs DRP-250AT) were cleaned electrochemically by Linear Sweep Voltammetry in PBS buffer (2.7 mM KCl, 137 mM NaCl, 10 mM Na2HPO4, 1.7 mM KH2PO4 , pH= 7.0). The voltage was changed between -2 to 2 V at a scan rate of 0.1 V/s, with a Ag/AgCl reference electrode while a Pt electrode was used as counter. The pretreated gold electrodes were then immersed overnight in 1 mM 11-mercaptoundecanoic acid in ethanol to form a self-assembled monolayer (SAM) on the gold surface. After this step, the electrodes were rinsed with ethanol to remove the unbounded thiols. Following this step, the activation of the terminal carboxylic groups occurred. For this purpose, the modified electrodes were treated with 1:1 v/v mixture of 0.4 M EDC-0.1M NHS (MES buffer, pH=5.0) for 2.5h.
The recombinant protein was coupled following rinsing of the gold electrodes with PBS and drying them in air, 4μL of 10 μg/mL solution of purified GroEL were dropped- coated onto the surface of the gold electrode for 100 min and the electrodes were left overnight at 4οC. The nonbinding antigen was then removed by rinsing with PBS (pH= 7.0) and water, and the electrodes were dried in air. Figure 1 depicts the whole biosensor construction procedure.
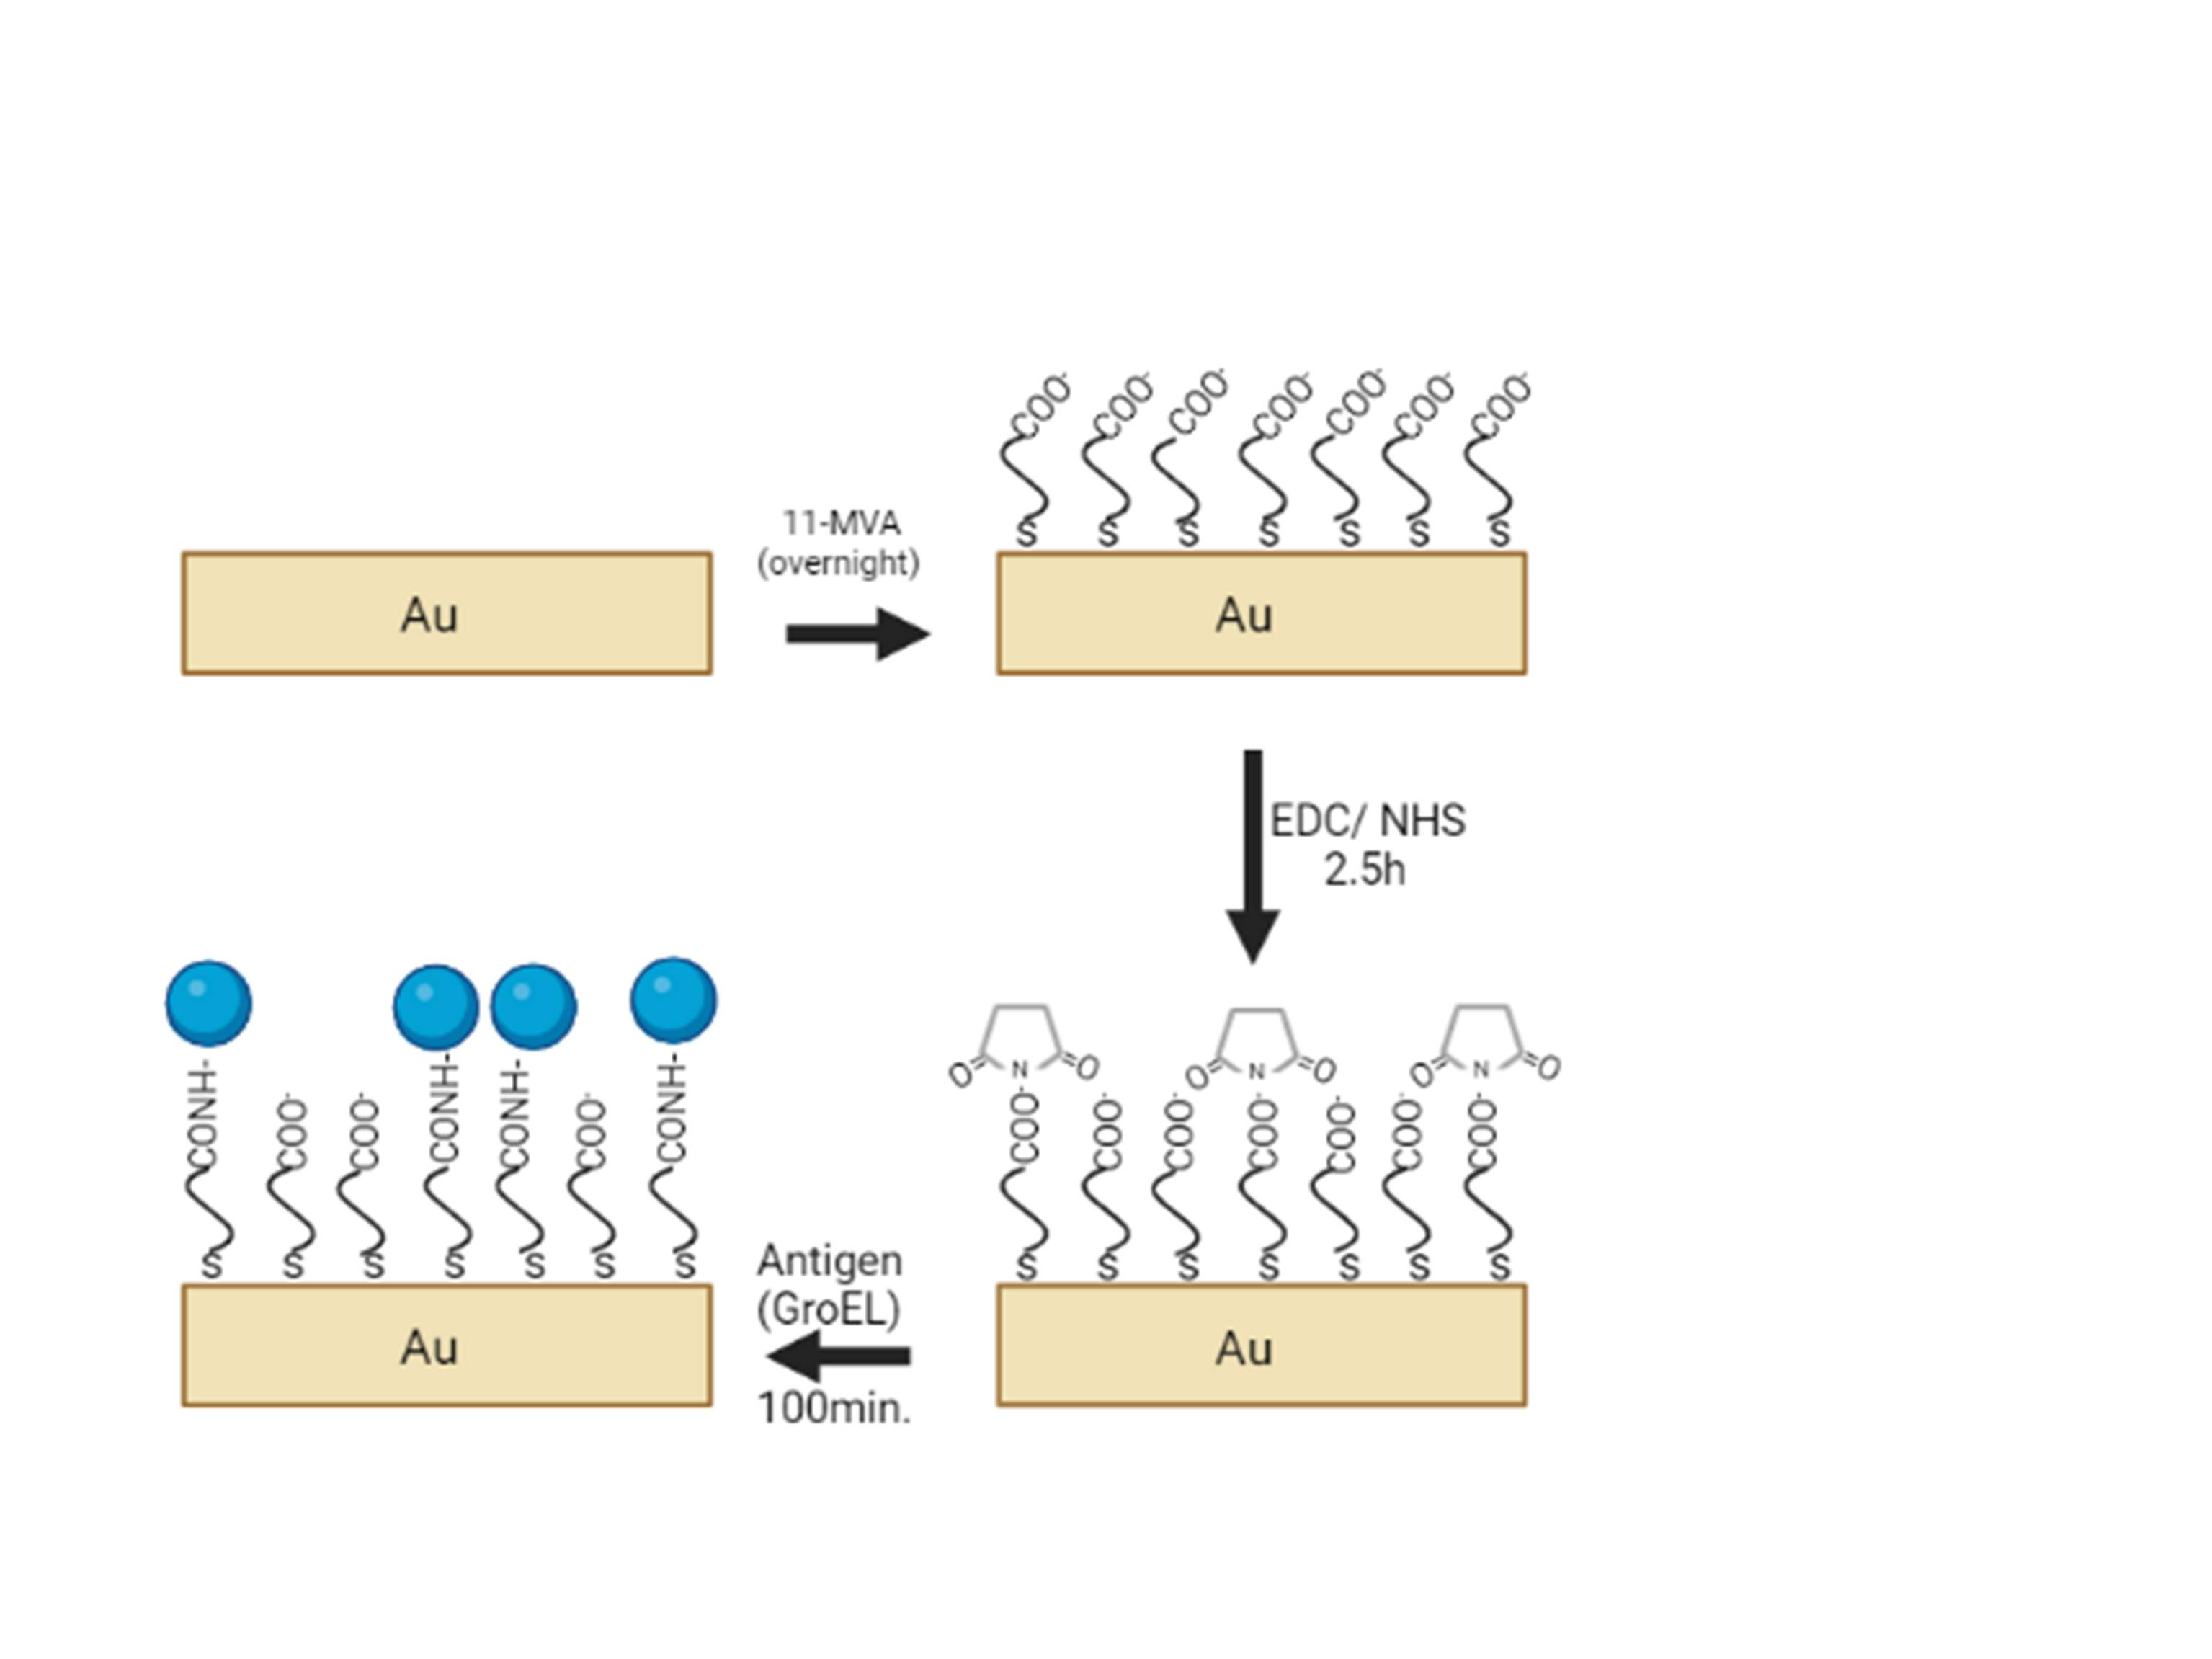
Figure 1. GroEL protein immobilization via EDC/ NHS mediated coupling.
EIS measurements
Electrochemical Impedance Spectroscopy (EIS) measurements were carried out to characterize both the modification steps of the gold electrode and the immobilization of the GroEL protein, as well as the response of the resulting biosensor to the Q fever antibodies. A three-electrode system was used, the modified gold electrode as the working electrode, a platinum counter electrode, and a Ag/AgCl reference electrode. All EIS measurements occurred using a PalmSens4 potentiostat equipped with a frequency response analyzer, in the frequency range between 0.2 Hz and 100 kHz using a sinusoidal excitation signal to a potential amplitude of 10 mV. The impedance data were recorded at a potential value of 0.0 mV. All measurements were performed in PBS buffer (pH=7.0) at room temperature (25 1οC). The impedance spectra were fitted using the PSTrace 5.8 software.
For the antigen-antibody interaction measurements, sera from healthy blood donors, from patients positive to chronic Q fever, and from patients positive to acute Q fever were used. Each of the three modified electrodes was tested with one of the three different sera (from a healthy blood donor, a patient positive to chronic Q fever, and a patient positive to acute Q fever), respectively. In more detail, patient serum was diluted (1:500) in PBS buffer (pH=7.0) and EIS measurement was performed after 2 min of stirring, followed by 6 min at ease, 1 min of stirring and 1 min at ease. Figure 2 illustrates the resulting biosensor for chronic Q fever diagnosis.
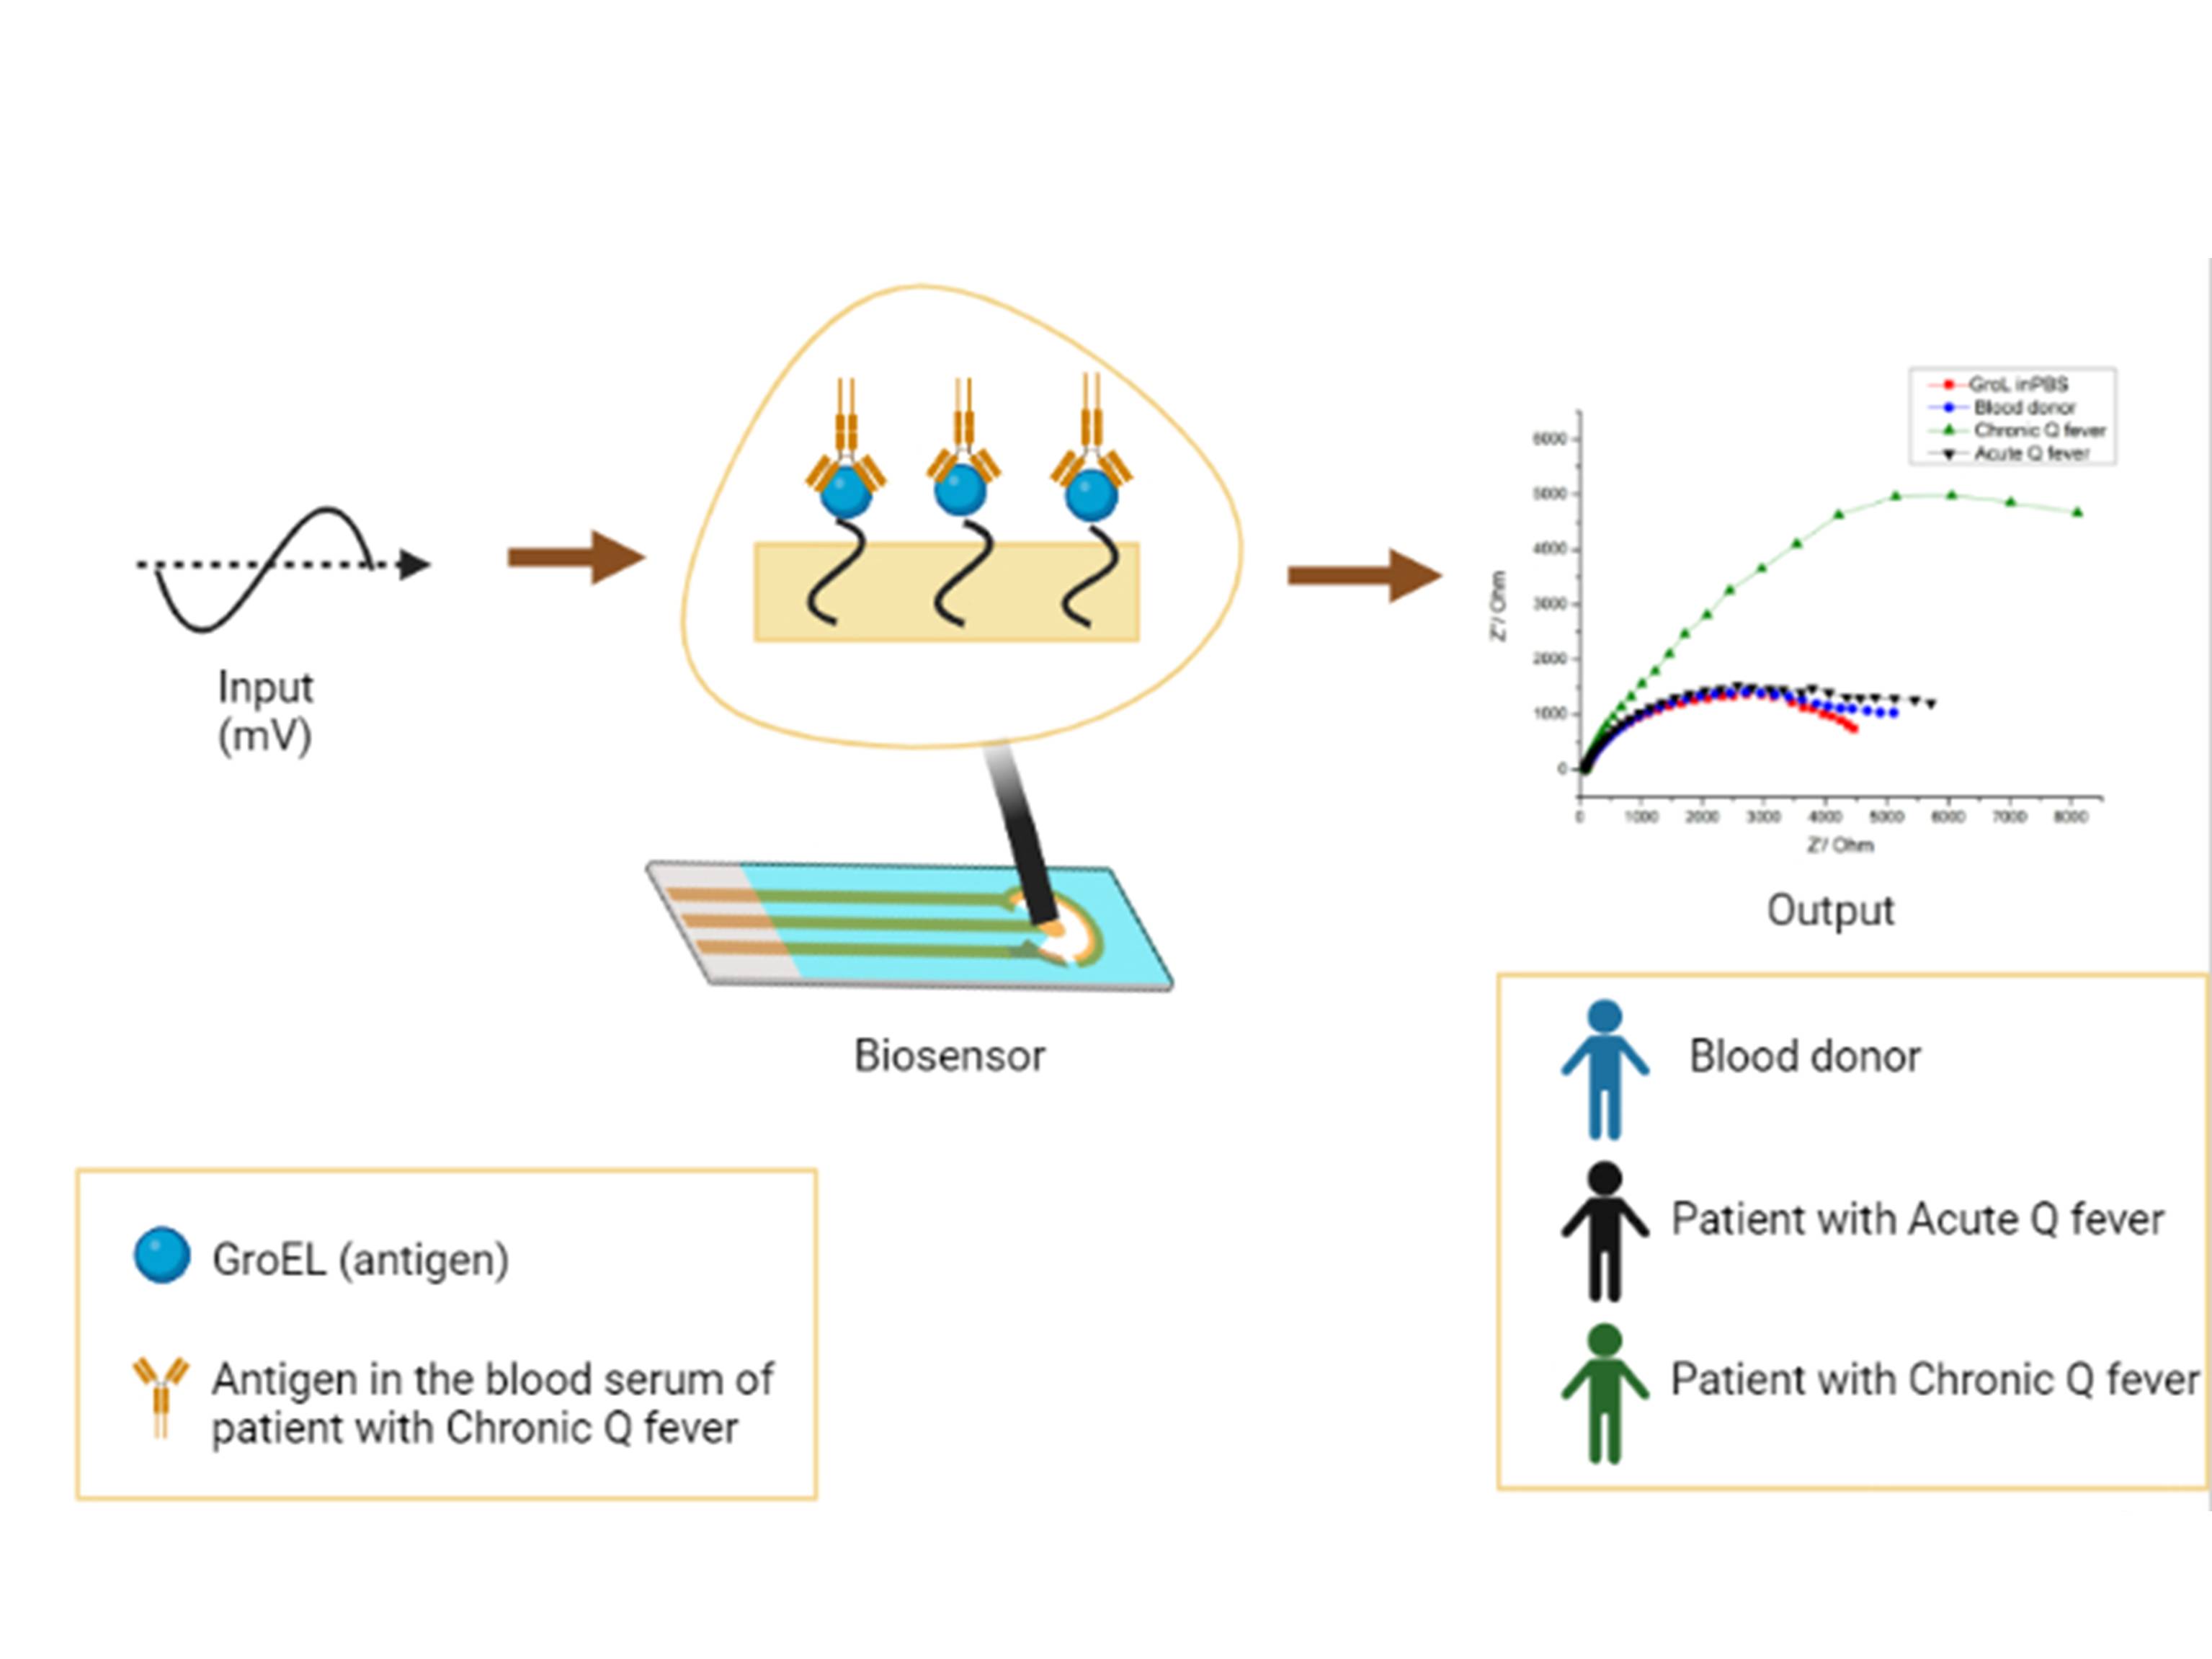
Figure 2. Diagrammatic illustration of the EIS biosensor for Chronic Q fever detection.
Results and discussion
Antigen preparation
Since GroEL (CBU_1718) showed higher yield in expression (0.65 mg/mL) compared to Com1, it was chosen for further examination.
The Western blot results indicated that the isolated GroEL reacted only with sera from patients positive to chronic Q fever, while no reaction was observed with sera from healthy individuals or patients who suffer from the acute form of the disease (Figure 3). ELISA measurements and statistical analysis confirmed that GroEL displays high sensitivity (96.4%) and specificity (84.8%) while its cut-off was set at 1.59 [13]. The antigenic protein was tested for its quality, its quantity, and its diagnostic ability before the development of the immunosensor. Figure 3 validates that even after storage at -40οC for two months, GroEL remains capable of differentially diagnosing Q fever disease in human serum.
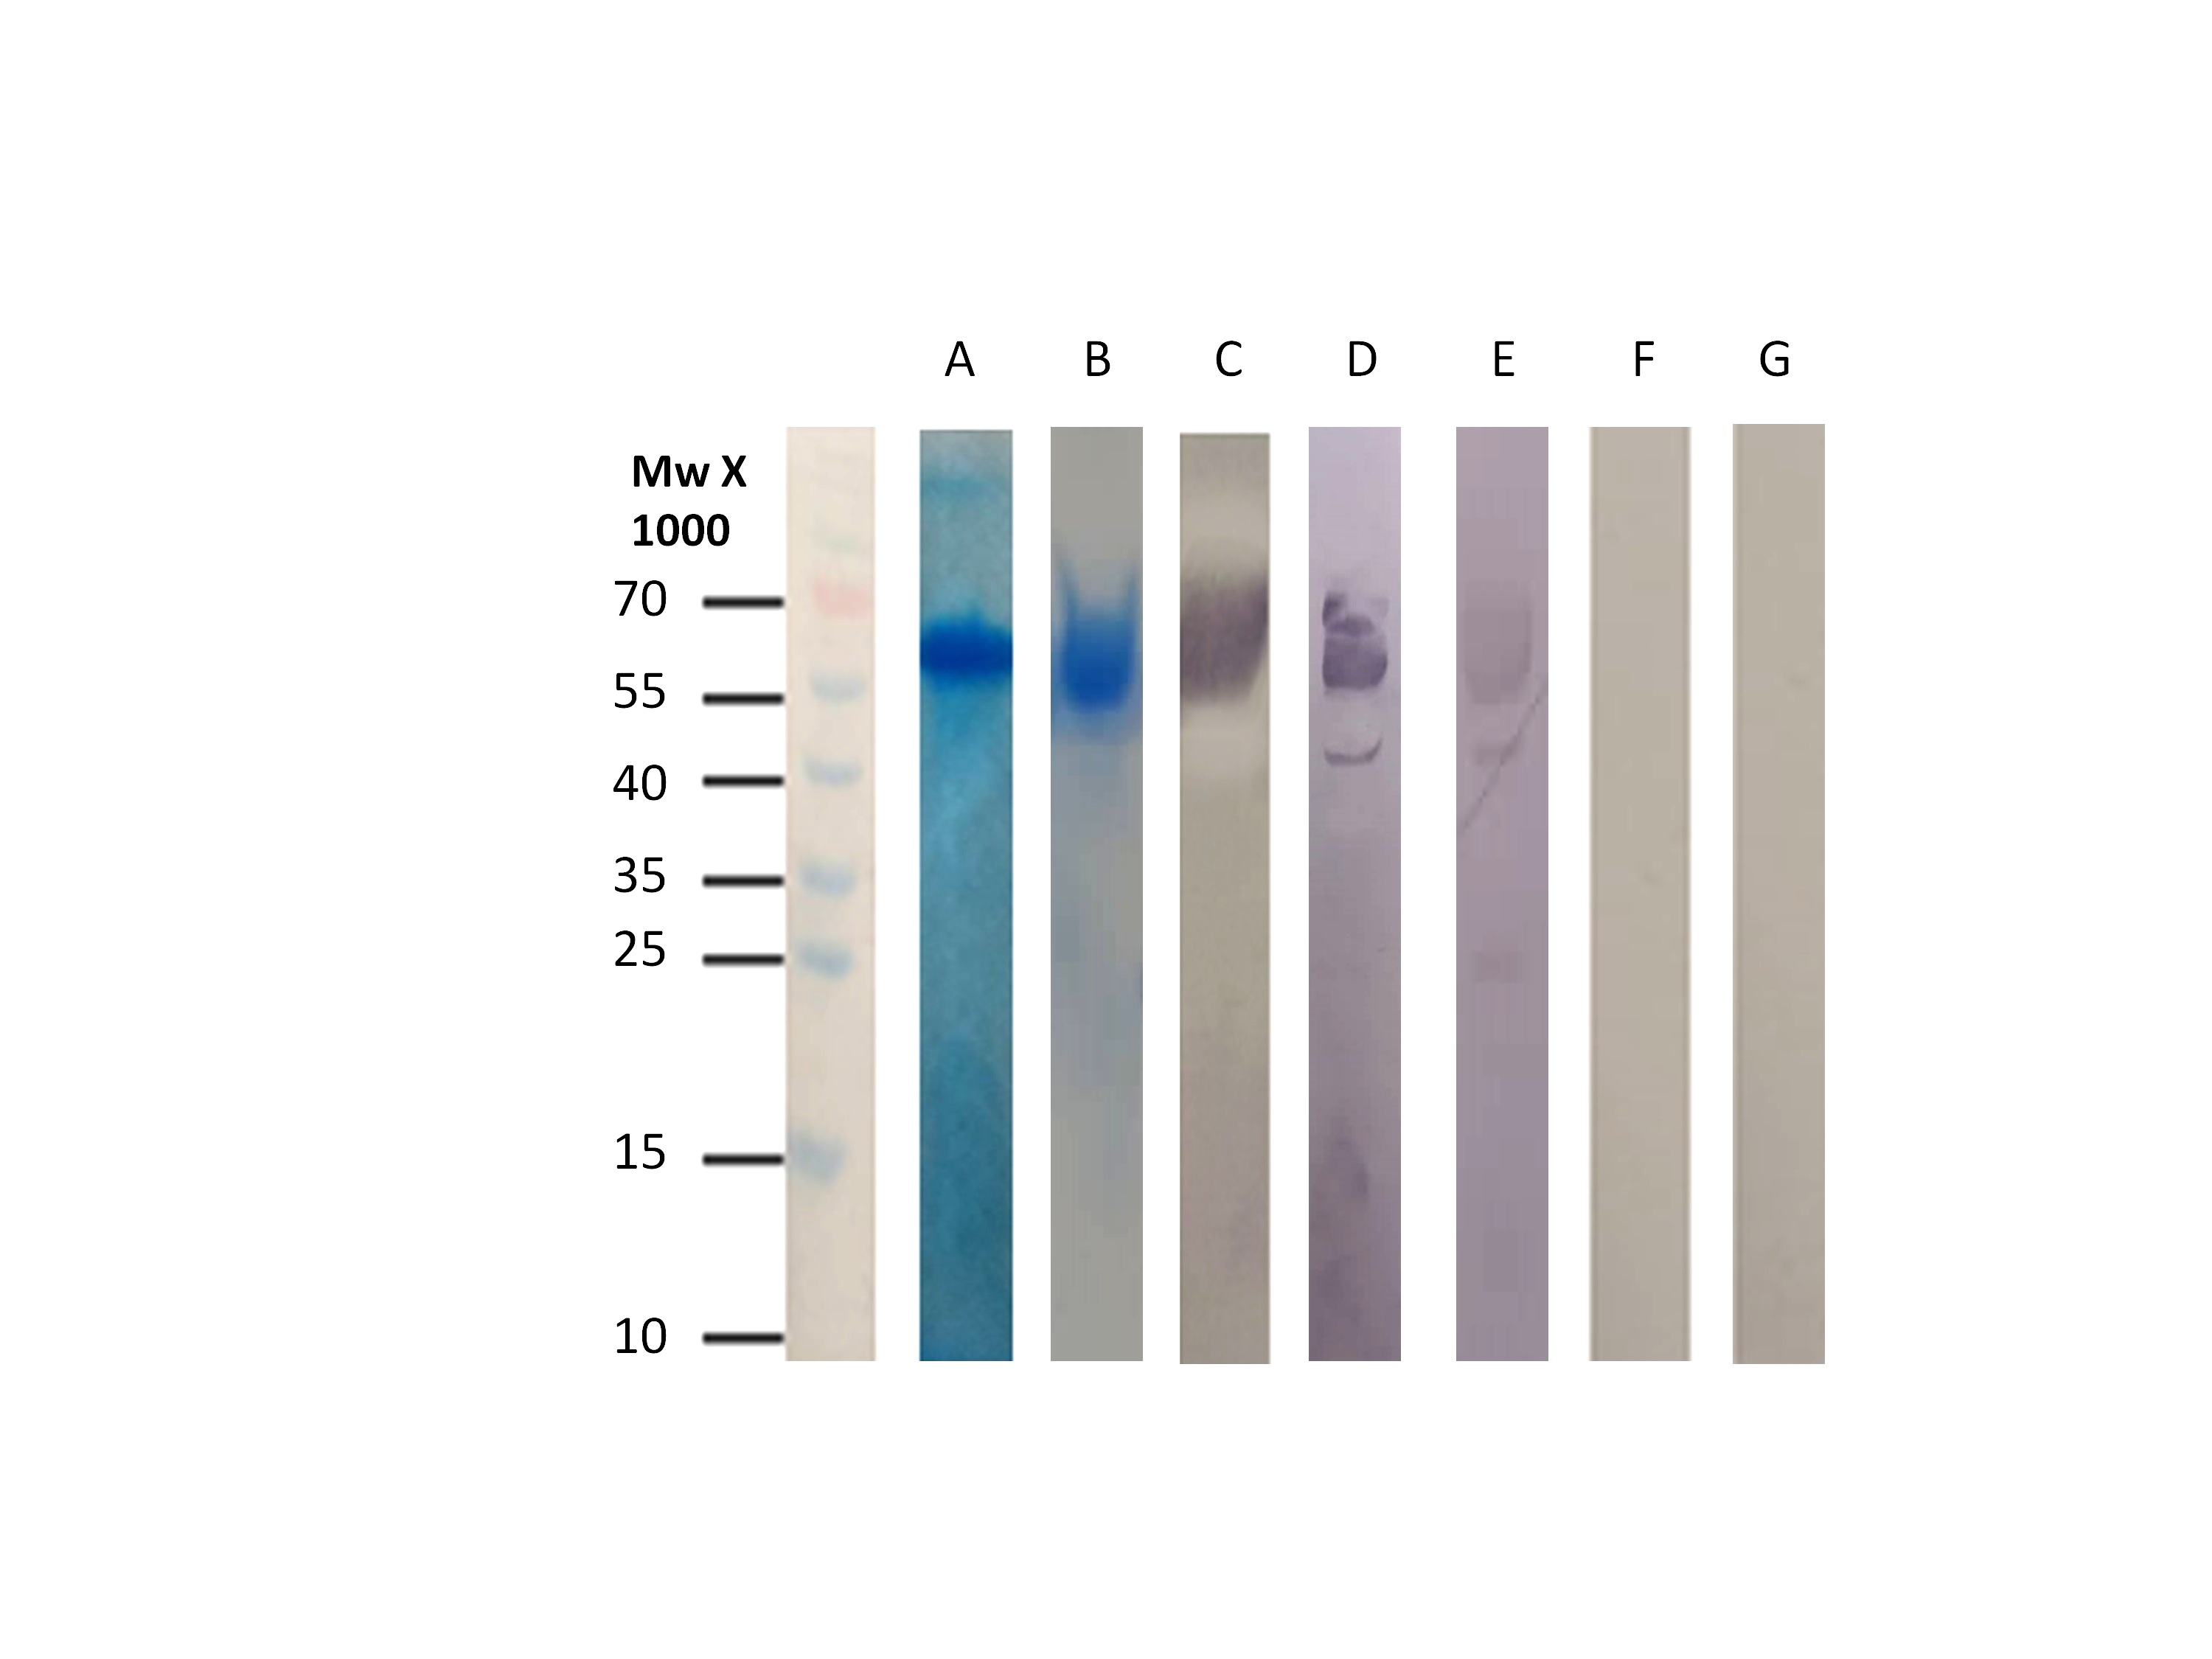
Figure 3. A. SDS-PAGE for GroEL after affinity chromatography B. SDS-PAGE for GroEL after affinity chromatography and storage at -40οC. C. Western Blot using anti-poly-histidine alkaline phosphatase conjugated antibody. D. Western Blot using anti-poly-histidine alkaline phosphatase conjugated antibody after storage at -40οC. E. Western blot using serum from patient suffering from chronic Q fever. F. Western blot using serum from patient with acute Q fever. G. Western blot using serum from blood donor.
Biosensor development
Impedance spectroscopy is one of the most widely used methods for the monitoring of interactions with surfaces and self-assembled monolayers [15–25]. Since impedance is the measure of the total ability of a circuit to resist current, it takes into account all parameters inhibiting the flow within a resistor such as inductance, resistance, and capacitance. During EIS measurements, the electrical current is measured as an AC voltage is applied to the sample at different frequencies. Impedance (Z) can then be calculated as the ratio of the frequency-dependent potential (E) to the frequency-dependent current (I).
As the impedance is expressed as a complex number (Z(ω) = Z’(ω)- jZ’’(ω)), the data are often presented in a Nyquist plot, where the real part (Z’) is on the x-axis, and the imaginary part (Z’’) on the y-axis. Usually this plot is demonstrated as a semicircle, which signifies a charge transfer process, while the size of the semicircle represents the amount of charge transfer resistance we have. However, Nyquist plot can also look like a straight line with positive slope, in the case of a diffusion process (Warburg impedance) [19].
Figure 4 shows the impedance Nyquist spectra of a gold electrode before and after it has been modified with GroEL protein. The diagram of the bare gold outlines a semi-cycle, distinctive of a resistance connected in parallel with a capacitor and a linear part, which is present at low frequencies and which is due to the diffusion process (Warburg Impedance) [24]. However, after antigen immobilization onto the surface of the electrode, a pronounced high frequency charge transfer semicircle appears while the linear part is no longer observed. This suggests that the Warburg Impedance is absent as the protein GroEL electrically insulates the modified gold electrode surface [19,24].
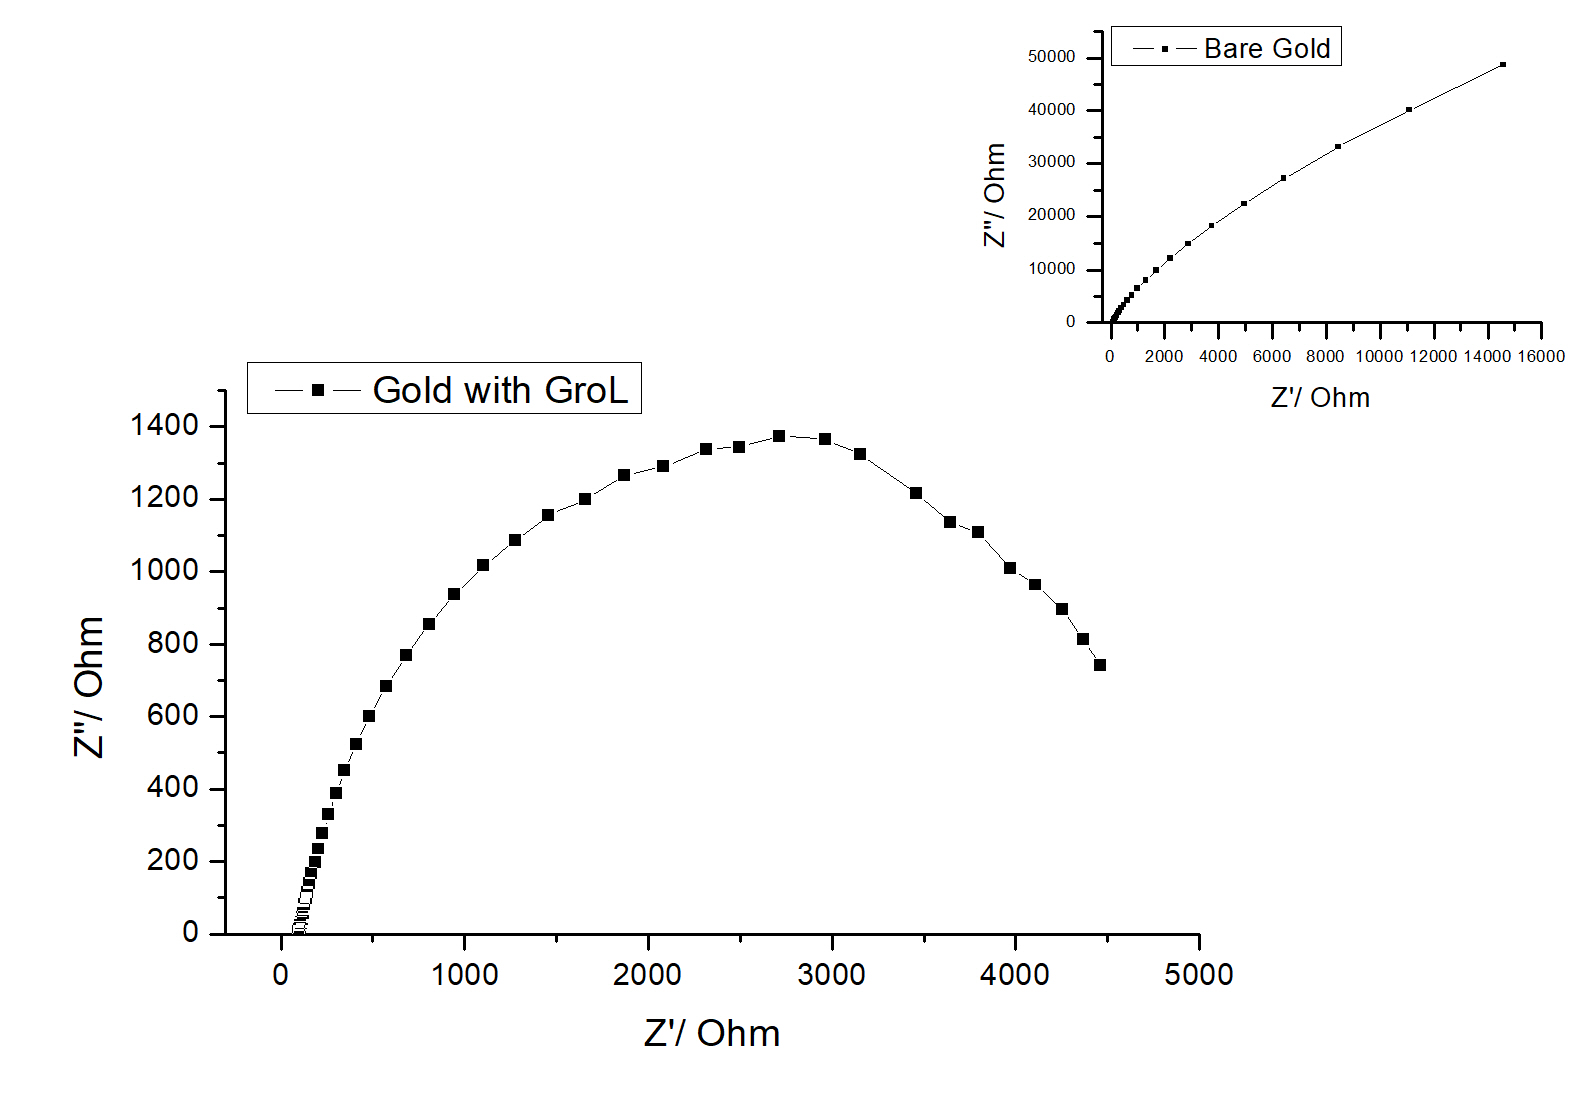
Figure 4. Impedance Nyquist spectra of bare gold electrode (inset) and gold electrode modified with GroEL protein in PBS buffer. Potential amplitude is 10 mV and frequency range is 100 kHz–0.2 Hz. The impedance data were recorded at a potential of 0.0 mV.
Biosensor evaluation
The protein GroEL was immobilized onto the modified gold electrode, and the response of the resulting biosensor to several serum samples was evaluated by EIS measurements. Figure 5 shows the Nyquist plot (A) and the corresponding Bode (B) plot when sera from a healthy individual, one positive with acute Q fever and one with the chronic form of the disease. The EIS spectrum of the biosensor in PBS when no sera were added to the test solution is shown on the same graph for comparison. It can be seen that when serum from a healthy individual and from a patient with acute Q fever are used, the EIS spectra showed no significant difference as the two plots overlap. On the other hand, when serum from a patient suffering from the chronic form of Q fever was used, the impedance spectrum increased dramatically. The data was fitted to the simplified Randles circuit (Figure 6), where Rct is the charge transfer resistance to be calculated by the diameter of the semicircle [25], R1 is the electrolyte resistance and Cdl is the double layer capacitance. The calculated values for the above measurements are shown in Table 1.

Figure 6. The Randlers circuit is fitted by the data from EIS measurements.
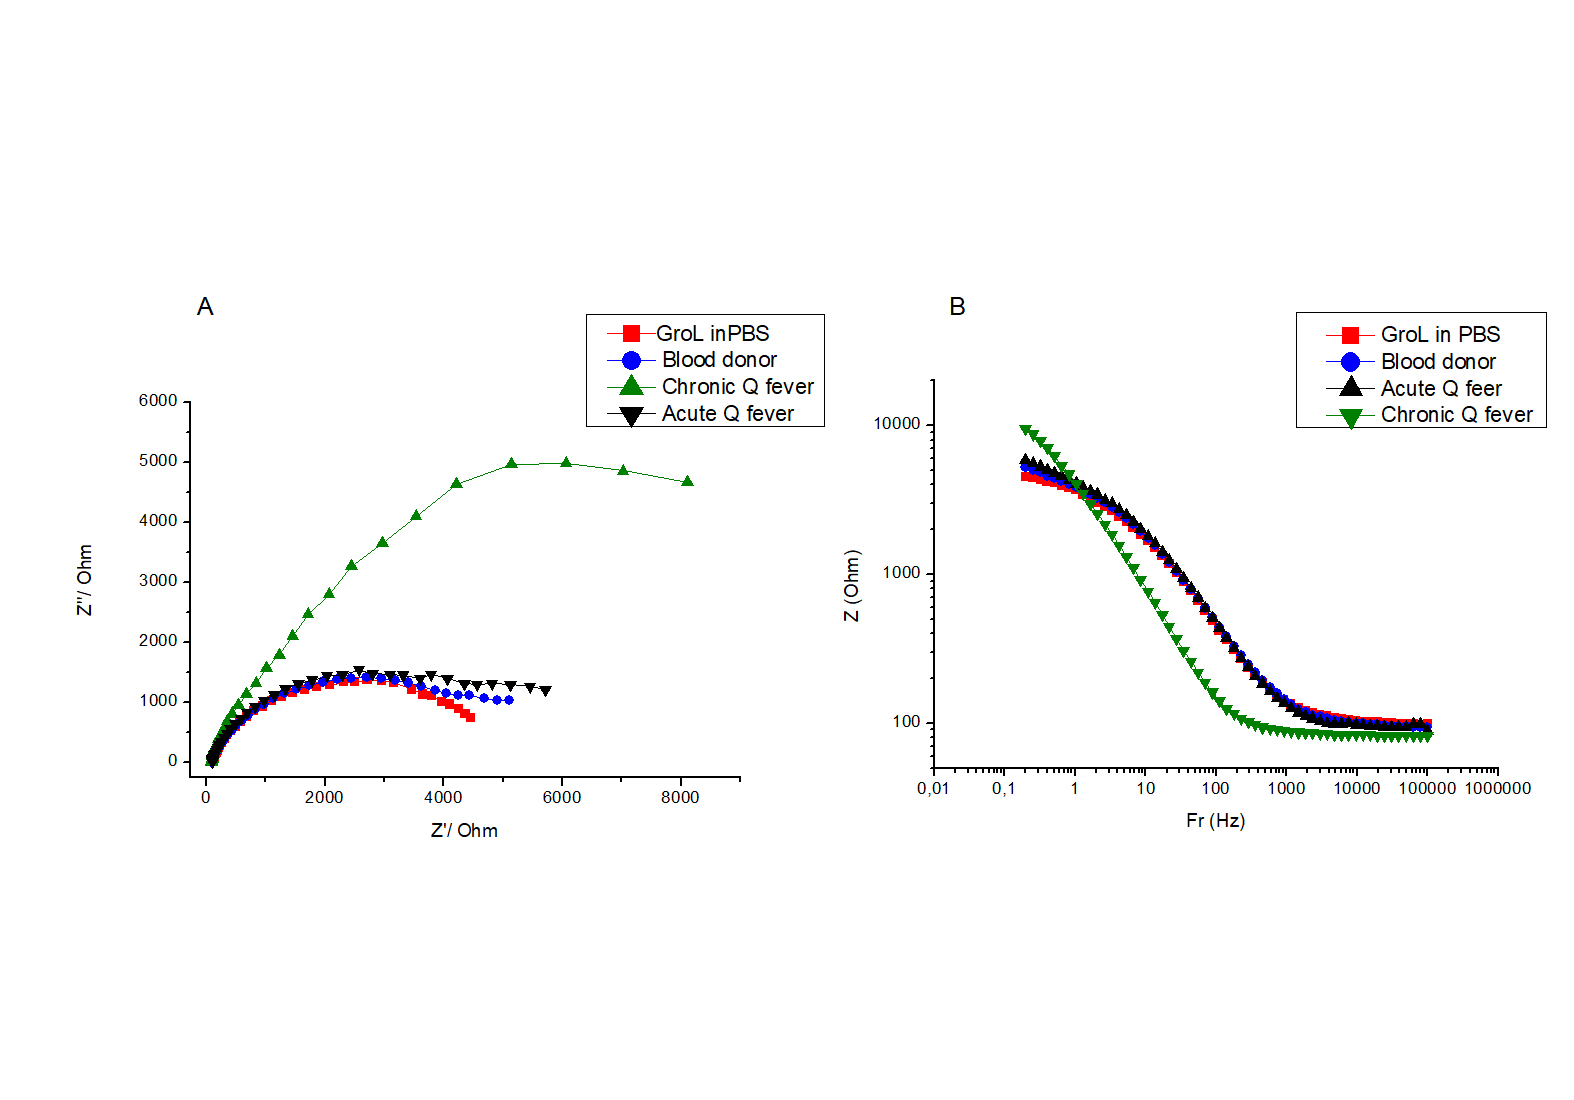
Figure 5. A. Impedance Nyquist plot of GroEL modified electrode in PBS and in different patients’ sera. Potential amplitude is 100 mV and frequency range is 100 kHz–0.2 Hz. The impedance data were recorded at a potential of 0.0 mV. B. Equivalent Bode plot of EIS biosensor against PBS and different patients’ sera.
Table 1. Calculated values for solution resistance R1, polarization resistance Rct and double layer capacitance Cdl for the impedance spectra are shown in Figure 5
|
GroEL modified electrode in PBS |
GroEL modified electrode in serum from chronic Q fever patient |
R1 (kΩ) |
0.27 |
0.26 |
Rct (kΩ) |
3.7 |
10.3 |
Cdl (μF) |
11.4 |
40.0 |
It is usually the case that upon electrode functionalization with a biomolecule, the impedance increases (MILNER), as a result of an increased coverage of the electrode surface with a nonconductive organic material. Non-conductive material induces a slower electron transfer rate and higher charge transfer resistance compared to the bare metal electrode [26].
The data from Table 1 indicates that the values of both Rct and Cdl increase at least two and four-fold, respectively, when the biosensor is exposed to chronic Q fever antibodies compared to that obtained in PBS buffer or acute Q fever patients. The large impedance increase can be attributed to the expansion of the non-conductive electrode surface coating, which is a result of the biorecognition of the chronic Q fever antibody with the immobilized selective protein. On the other hand, the calculated Rct and Cdl values remained constant (data not shown) when sera from blood donors and acute Q fever patients were added.
The sensor-to-sensor reproducibility was evaluated, as shown in Figure 5B. This data shows the relationship between the Z values versus the frequency range used. It is evident that the larger increase of impedance upon the antigen-antibody interaction is achieved at frequencies lower than 1.0 Hz. Figure 7 shows the mean total impedance for different sensors at 0.51 Hz, in PBS and different serum samples. All biosensors exhibit a very similar (RSD 2-3%) total impedance increase when exposed to chronic Q fever antibodies, while no significant response was observed against healthy blood donors and acute Q fever sera. This result indicates that the developed GroEL biosensor is a diagnostic tool with high specificity for chronic Q fever antibodies, allowing for an easy-to-use, direct, and accurate determination of chronic Q fever ill patients.
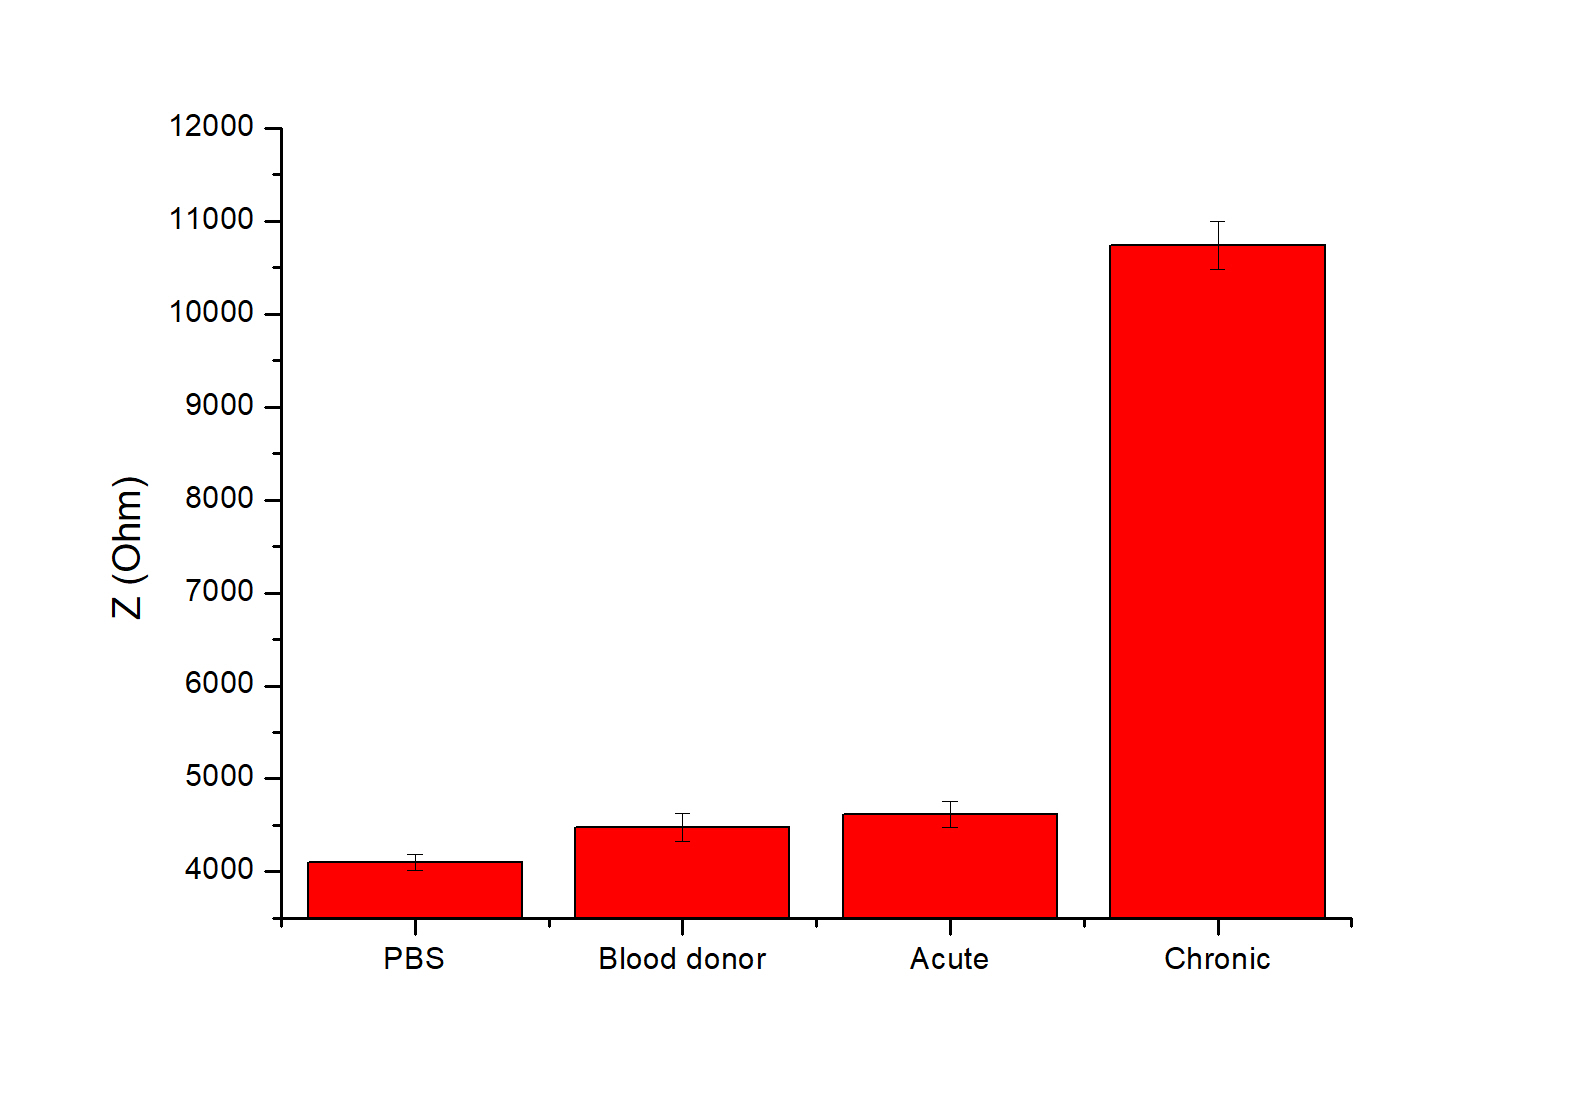
Figure 7. Evaluation of sensing performance against the chronic form of Q fever. Total Impedance (Z) was measured by EIS, which was performed in PBS buffer using different patients’ sera. Potential amplitude was 100 mV and frequency range was 100 kHz–0.2 Hz. Evaluation was carried out in triplicate (N=3).
Conclusions
In this work, we showed the development of impedimetric biosensor based on highly selective C. burnetii antibodies for the direct diagnosis of chronic Q fever. The biosensor was developed via immobilization of the antigen onto a gold electrode using EDC/NHS immobilization methodology. The optimum detection was achieved using impedance measurements at frequencies below 1 Hz, at which point the biosensor showed its maximum sensitivity. The biosensor showed the required selectivity and sensitivity allowing for the accurate and reliable serological detection of chronic Q fever, while the developed system can also be modified for the detection of other biomarkers, such as the ones from acute Q fever.
Acknowledgments
The authors would like to thank Cornelia Muenke for her excellent technical assistance. This research program was supported by the University of Crete and the Greek Ministry of Education. Prof. H. Michel, Max-Planck-Institute of Biophysics, is gratefully acknowledged for his support.
References
- Angelakis E, Raoult D (2010) Q fever. Vet Microbiol 140: 297–309.
- Anderson, A, Bijlmer H, Fournier PE, Graves S, Hartzell J, et al. (2013) Diagnosis and management of Q fever--United States, 2013: recommendations from CDC and the Q Fever Working Group. MMWR Recomm Rep 62: 1–30. [Crossref]
- Million M, Raoult D (2015) Recent advances in the study of Q fever epidemiology, diagnosis and management. J Infect 71: S2–S9. [Crossref]
- Fournier PE, Marrie TJ, Raoult D (1998) Diagnosis of Q Fever. J Clin Microbiol 36: 1823–1834.
- Bacarese-Hamilton T, Ardizzoni A, Gray J, Crisanti A (2004) Protein Arrays for Serodiagnosis of Disease. Humana Press: New Jersey; pp: 271–284.
- Coleman SA, Fischer ER, Cockrell DC, Voth DE, Howe D, et al. (2007) Proteome and Antigen Profiling of Coxiella burnetii Developmental Forms. Infect Immun 75: 290–298. [Crossref]
- Sekeyová Z, Kowalczewska M, Decloquement P, Pelletier N, Špitalská E, et al. (2009) Identification of protein candidates for the serodiagnosis of Q fever endocarditis by an immunoproteomic approach. Eur J Clin Microbiol Infect Dis 28: 287–295. [Crossref]
- Papadioti A, Markoutsa S, Vranakis I, Tselentis Y, Karas M, et al. (2011) A proteomic approach to investigate the differential antigenic profile of two Coxiella burnetii strains. J. Proteomics 74: 1150–1159. [Crossref]
- Skultety L, Hajduch M, Flores-Ramirez G, Miernyk JA, Ciampor F, et al. (2011) Proteomic comparison of virulent phase I and avirulent phase II of Coxiella burnetii, the causative agent of Q fever. J Proteomics 74: 1974–1984. [Crossref]
- Xiong X, Wang X, Wen B, Graves S, Stenos J (2012) Potential serodiagnostic markers for Q fever identified in Coxiella burnetiiby immunoproteomic and protein microarray approaches. BMC Microbiol 12: 35.
- Miller HK, Kersh GJ (2020) Analysis of recombinant proteins for Q fever diagnostics. Sci Rep 10: 20934. [Crossref]
- Mathioudaki E, Arvaniti K, Muenke C, Drakonaki A, Vranakis I, et al. (2021) Expression, purification and characterization of the IcmG and IcmK proteins of the type IVB secretion system from Coxiella burnetii. Protein Expr Purif 186: 105905. [Crossref]
- Psaroulaki A, Mathioudaki E, Vranakis I, Chochlakis D, Yachnakis E, et al. (2020) In the Search of Potential Serodiagnostic Proteins to Discriminate Between Acute and Chronic Q Fever in Humans. Some Promising Outcomes. Front Cell Infect Microbiol 10:557027.
- Mathioudaki V, Psaroulaki K (2019) Com1 as a Promising Protein for the Differential Diagnosis of the Two Forms of Q Fever. Pathogens 8: 242.
- Hou Y, Helali S, Zhang A, Jaffrezic-Renault N, Martelet C, et al. (2005) Immobilization of rhodopsin on a self-assembled multilayer and its specific detection by electrochemical impedance spectroscopy. Biosens Bioelectron 21: 1393–1402. [Crossref]
- Chen H, Jiang JH, Huang Y, Deng T, Li JS, et al. (2006) An electrochemical impedance immunosensor with signal amplification based on Au-colloid labeled antibody complex. Sensors Actuators B Chem 117: 211–218.
- Hnaien M, Diouani MF, Helali S, Hafaid I, Hassen WM, et al. (2008) Immobilization of specific antibody on SAM functionalized gold electrode for rabies virus detection by electrochemical impedance spectroscopy. Biochem Eng J 39: 443–449.
- Nidzworski D, Pranszke P, Grudniewska M, Król E, Gromadzka B (2014) Universal biosensor for detection of influenza virus. Biosens. Bioelectron 59: 239–242. [Crossref]
- Chang BY, Park SM (2010) Electrochemical Impedance Spectroscopy. Annu Rev Anal Chem 3: 207–229.
- Hleli S, Martelet C, Abdelghani A, Burais N, Jaffrezic-Renault N (2006) Atrazine analysis using an impedimetric immunosensor based on mixed biotinylated self-assembled monolayer. Sensors Actuators B Chem 113: 711–717.
- Ali MA, Hu C, Jahan S, Yuan B, Saleh MS, et al. (2021) Sensing of COVID‐19 Antibodies in Seconds via Aerosol Jet Nanoprinted Reduced‐Graphene‐Oxide‐Coated 3D Electrodes. Adv Mater 33: 2006647. [Crossref]
- Manickam A, Chevalier A, McDermott M, Ellington AD, Hassibi A (2010) A CMOS Electrochemical Impedance Spectroscopy (EIS) Biosensor Array. IEEE Trans Biomed Circuits Syst 4: 379–390.
- Yun Y, Bange A, Heineman WR, Halsall HB, Shanov VN, et al. (2007) A nanotube array immunosensor for direct electrochemical detection of antigen–antibody binding. Sensors Actuators B Chem 123: 177–182.
- Tlili A, Abdelghani A, Ameur S, Jaffrezic-Renault N (2006) Impedance spectroscopy and affinity measurement of specific antibody–antigen interaction. Mater Sci Eng C 26: 546–550.
- Choi W, Shin HC, Kim JM, Choi JY, Yoon WS (2020) Modeling and Applications of Electrochemical Impedance Spectroscopy (EIS) for Lithium-ion Batteries. J Electrochem Sci Technol 11: 1–13.
- Cancelliere R, Albano D, Brugnoli B, Buonasera K, Leo G, et al. (2021) Electrochemical and morphological layer-by-layer characterization of electrode interfaces during a label-free impedimetric immunosensor build-up: The case of ochratoxin A. Appl Surf Sci 567: 150791.