Abstract
Blood flow acceleration increases from the left ventricular outflow tract, to the sinotubular junction and the ascending aorta, while it must be decreasing due to the flow turbulences in the Valsalva sinuses and increased diameter of the vessel. Total energy of the pulse wave in the arterioles is up to 7.2 times higher, than in the ascending aorta, while it must be low due to the energy dissipation in the viscous flow, with the distance from the heart. Purpose of the study is identifying the additional possible energy source, for the arterial blood flow.
Methods and materials: 12 healthy volunteer students (male) underwent echocardiography, ECG gated MRI of the heart for the visualization intracavitary flow in the ventricles, MR Angiography of the aorta. Blood flow velocities and acceleration were studied in the different sites of the heart and the aorta. Results: With the DU in the left ventricular outflow tract blood acceleration is 1430 ± 120 cm/sec2, in the sinotubular junction and ascending aorta 2395 ± 195cm/sec2, at the aortic arch 1390 ± 225cm/sec2, isthmus of aorta 2180 ± 135cm/sec2, middle thoracic aorta1260 ± 140m/sec2. With the MRI (TrueFisp. Mean curve), blood acceleration from the left ventricular outflow tract to the sinotubular junction is 3.5 ± 0.3 times higher and to the ascending aorta 2.5 ± 0.2 times higher. Systolic blood pressure from the ascending aorta to the femoral and saphenous elastic arteries enhancing 1.3 ± 0.1 times, increasing energy transmitted to the blood. Direction of the electric charge in the heart's ventricles from the circulating erythrocytes and in the fibers of the Purkinje (ECG), mathematically are coincident.
Conclusion: Availability of the heart, as the possible single tool for the blood flow, looks imperfect. Electric oscillate field from the heart dipoles can be impact to the erythrocytes, forming the modulated naturally ultrasound vibration and associated with it colloid vibration current propagating distally to the all cell membranes. Blood motion in the heart chambers and arteries has the additional basis, besides the heart contraction: rotating blood particles in the heart chambers and in the arterial branching sites, with the concomitant oscillating electric field triggered from the heart, forms additional electromagnetic repulsing force for the charged particles, providing to the flow. Modulating ac electric field, transmitting by the oscillate blood particles, besides the flow, creates additional energy/signal source, enabling the spontaneous chemical reactions proceed across the cell membranes.
Key words
heart work, flow turbulence, electromagnetic interaction, ECG, entropy
Introduction
Now is accepted, that the driving force in the circulatory system is the heart and the vascular system provides the blood to circulate in the vessels with the different functions. The earliest known writings on the circulatory system are found in the Ebers Papyrus (16th century BCE). The true history of the development of the blood circulation theory begins from the classical views of Galen, through the Islamic Golden Age, and up to William Harvey with his groundbreaking and accurate description about how the heart pumped blood throughout the body [1]. The basic provisions are unchanged for centuries.
Humans, as well as other vertebrates, have a closed cardiovascular system. Blood flow through the vessel is determined by two factors: the pressure difference between the two ends of the vessel and the resistance of the vessel to blood flow. Blood circulation in the heart and vasculature are regulated by the neural autonomic and humoral factors. Flow always directed from the high, towards the low pressure. Arterial branching, flow turbulence and viscosity are the natural resistive factors for the blood flow. High mean arterial pressure is a result of two factors: the large volume of blood pumped from the left ventricle into the aorta and the low compliance of the arterial wall. In the arterioles and the capillaries, pressure decreases for two reasons: frictional resistance to the flow and filtration of the fluid out of the capillaries [2].
Taking ahead the above mentioned, can be noted some controversial facts:
Blood flow acceleration 2.4-3.5 times increases from the left ventricular outflow tract, to the sinotubular junction and the ascending aorta, while it must be decreasing due to the flow turbulences in the Valsalva sinuses and increased diameter of the vessel.
Total energy of the pulse wave in the arterioles is up to 7.2 times higher, than in the ascending aorta, while it must be low due to the energy dissipation with the distance from the heart.
Closing of the mitral and tricuspid valves must be caused by the pressure gradient across the valve, but at the moment of closing, pressure difference do not noted.
Ejected blood volume (75ml) for the 0.8 sec. in the wave form propagates across the vessels with the length about 105km, while the heart power is only 1-2 Watt [3].
For the explaining the problem, we need to look for non-ordinary solving the "contradictions" in the biological processes, with the study the results by the fundamentals of the physics and chemistry.
Methods and materials
12 healthy volunteer students (male) underwent echocardiography DU, ECG gated MRI of the heart for the visualization intracavitary flow in the ventricles and in –flow enhancement in True Fisp MRI [4]. MR Angiography (PC) of the aorta. Blood flow velocity and acceleration were studied in the different sites of the heartand the aorta.
Results
With the DU in the left ventricular outflow tract blood acceleration is 1430 ± 120 cm/sec2, in the sinotubular junction and ascending aorta 2395 ± 195cm/sec2, at the aortic arch 1390 ± 225cm/sec2, isthmus of aorta 2180 ± 135cm/sec2, middle thoracic aorta1260 ± 140m/sec2 (Figure 1).
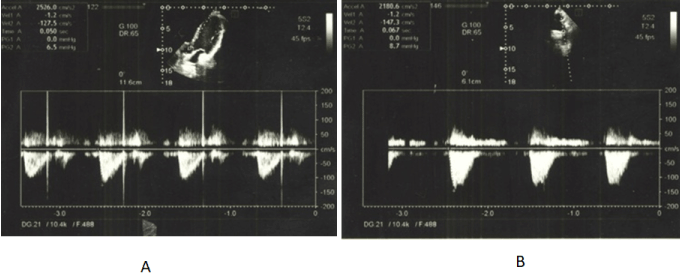
Figure 1. Blood acceleration quantification by the duplex US of the heart. A. Investigation of the blood flow at the left ventricular outflow tract. B. Blood flow at the sinotubular junction.
With the MRI, blood acceleration from the left ventricular outflow tract to the sinotubular junction is 3.5 ± 0.3 times higher and to the ascending aorta 2.5 ± 0.2 times higher (Figure 2, Figure 3).
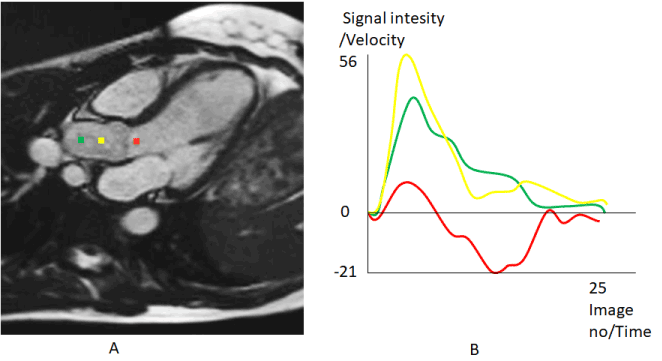
Figure 2. Blood flow quantification in the heart ventricle and aorta. (MRI. True Fisp. Mean curve). Red point - left ventricular outflow tract, yellow - sinotubular junction, green - ascending aorta.
A. Diameter at the ventricular outflow tract is lower, than diameter at the sinotubular junction and the peak flow velocity at the ventricular outflow tract must be higher (Bernoulli’s principle). But the flow velocity increases in the sinotubular junction. Acceleration is formed by the pressure (Newton second law in motion) from the heart muscle and it must be higher in the ventricular outflow tract. Herewith, blood flow velocity in the sinotubular junction must be decreases due to the increasing flow resistivity by the turbulence in the Valsalva sinuses.
B. Mean curve diagrams shows evolution of the flow velocity. Flow acceleration is calculated as the Tgφ of the angle between the amplitude of the peak velocity and the flow time.
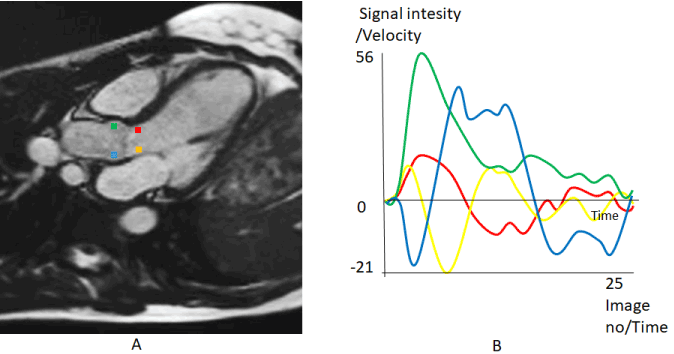
Figure 3. A. Blood velocity graph in the heart ventricle and aorta. (MRI. TrueFisp. Mean curve). Red and yellow points – opposite walls of the left ventricular outflow tract, green and blue - in the sinotubular junction.
B. Blood acceleration at the opposite wall of the vessels is in the different directions, due to the simultaneously: rotational and translational motion of the blood at the boundary layer forming helival motion of the substance (rolling motion in the surface wave). Amplitude of the flow velocity and acceleration increases with the increasing vessel diameter, while it should be decreases due to the Bernoulli’s principle.
Systolic blood pressure from the ascending aorta to the femoral and saphenous elastic arteries enhancing 1.3 ± 0.1 times, increasing energy transmitted to the blood.
Blood flow acceleration is coincident with the ECG-qRs wave. Direction of the negative charge at the heart's ventricles from the circulating erythrocytes and in the fibers of the Purkinje (ECG), mathematically are coincident.
Discussion
Energy for the blood displacement is forming by the heart work. In physics, work is defined as a force causing the displacement of the object. Amount of the force to the per unit of the area, perpendicular to the surface of the object is a pressure [5].
P= - F/A(1)
p - Pressure, F - magnitude of the normal force opposite to the pressure, A - area of the surface on contact.
Since a system under pressure has the potential to perform work on its surroundings, pressure is a measure of potential energy stored per unit volume.
P= work/volume =energy/volume
Work for the blood flow is directly proportional to the pressure (P) and volume (V) of the displaced mass.
W=P x V(2)
With the mathematical analysis can be evokes doubt about the correctness of an idea, that the heart contraction force is the only moving tool for the blood flow.
Work of the left ventricle in the systole W=1.33.104(Pa) x 7.5.10-5m3 = 1J.
At the ejection from the heart, blood stroke volume circulates through the human body. Energy transferred to the blood by the heart at the beat is about 2J [3]. Blood mean driving force in the vascular system (without energy dissipation in the viscous flow) must be F=W/d (d-displacement) = 2J : 108m ≤ 2.10-8N.
From the other hand, the cross-sectional area of a single capillaryA = π(3.0 x 10⁻⁶ m)2= 2.83 x 10⁻¹¹m2. Hydrostatic pressure force in the single capillary F= P x A = 4.66.103(Pa) x 2.83 x 10⁻¹¹m2 = 13.19 x 10⁻⁸N. I.e. the hydrostatic mean driving force in the single capillary is about 6.6 times higher to the mean force made by the heart. The driving force in the large arteries is many times higher.
-With the equation (1), if the pressure in the arterial system, from the aorta to the systemic capillaries was be constant and particle interaction was only elastic, then the force to the area of systemic capillaries must be 800-1000 times higher (Due to the 800-1000 times increased surface area -Pascal’s principle). But the mean capillary pressure is the 4 times low (25mmHg), than the mean pressure at the ascending aorta (100mmHg). It means that the force increment at the area of the all capillaries will be 200-250 times higher than the force formed by the heart. The volumetric displacement of the blood in the capillaries is about 100 times lower than in the ascending aorta (Diameter of ascending aorta is 33mm [6] cross sectional area 8.55cm2). Blood displacement in ascending aorta at the systolic stroke ejection (75ml) is about 87.7mm. Red blood cell displacement in the systemic capillaries at the same time is 0.8-1mm. [7]. So the work made by the left ventricle, at least 3.5 times lower to the work needed for the blood displacement, in the systemic capillaries. Due to the viscous flow and structural rearrangement of the blood, energy dissipates and there must be energy loss before the entering in the systemic capillaries. It seems, that in the arterial system the law of conservation of energy is "not satisfied".
- Systolic blood pressure is amplified when moving from the aorta to the periphery. The amplification of the pressure pulse wave in the large elastic and smaller conduit arteries is associated with changes in the magnitude/amplitude of each harmonic component of the wave. The augmentation pressure corresponds to that part of the pulse pressure which is attributed to the summation of the reflected wave [8.9]. But energy source for the initial and reflected waves is the heart, and the sum of the energy must be decreasing due to the wave attenuation at the propagation, reflection and refraction.
From the equation (2) at the increase the pressure, with the constant volume, increases energy transmitting to the blood. Typically, the diastolic and mean pressures changes little across the arterial tree. Systolic blood pressure from the ascending aorta to the femoral and saphenous elastic arteries gradually increases 1.3 times. Work made in the distal elastic arteries, at the blood displacement in systole, must be higher, than the work in the ascending aorta (blood volume in aorta and the elastic arteries is the same - about 300ml). Energy in systole accumulates as the elastic deformation of the vessel wall and structural rearrangement of the blood.
-Total energy (E)associated with a wavelength in the arteries can be calculated as:
E=0.5µω2A2υ
µ-mass per unit of the length, ω-angular frequency, A-wave amplitude, υ – pulse wave velocity.
From the aorta to the elastic arteries pulse wave velocity, pressure amplitude and the mass per unit length are increases. Pulse pressure oscillations in the arterioles of the different arterial branches (maximum distance from the heart is about 1.5m), according to the high wave length (about 13-38m), are in almost in the same phase. Pulse wave velocity from the ascending aorta to the arterioles can be increases up to 2-3 times [10.11.12]. At the same blood volume in the aorta and the arterioles (2% of the blood volume), increasing in surface area in arterioles in 15 times, decreases the displacement, while the mass per length will be increases 15 times. Pressure amplitude decreases 2.5 times from 100mmHg to 40mmHg. I.e. energy increment in all arterioles must be up to 3: 6.3 x 15 ≤ 7.2 times higher than is in the ascending aorta.
-Energy of the arterial pulse is dissipates in the viscous flow, forming structural changes of the blood. Degree of the changes can be expressed by the Womerslay's number, which shows relation between the transient inertial force and the viscous force. From the aorta to the arteries it decreases - 2.5 times, to the arterioles -28.9 times, to the capillaries – 55.9 times [13]. Blood is thixotrophic substance and after the shaking, fluidity/entropy is increases.
So, the heart’s mechanical work is insufficient for the blood distribution in the arterial circulation system, capillaries and the structural changes in the blood. Energy in the arterial blood flow continuously increases up to capillaries. Due to the “contradiction” between the theory and practical data, the solution must be non-ordinary.
Oscillating motion of the blood cells with the surface charge, plasma macro-molecules, salts with the dipoles and superposing the oscillating electric field in the form of the ECG impulse, must be providing special – electromagnetic properties of the blood flow.
Energy has different sources. Transmission of the energy by the electromagnetic wave in the universe, is the common method. A wave is a disturbance in the system and propagates energy through the medium mostly without transport of the net mass. Propagation of the energy in waveform is the method for the entropy changes in the substance and creating the condition for the spontaneous chemical processes.
Electrically charged objects at the motion produce an electromagnetic field, extending indefinitely throughout the space and describes the electromagnetic interaction. The electric field is produced by stationary charges, while the magnetic field - by the accelerated charges. An electric field can be produced also by the changing magnetic field. The way in which charges and currents interact with the electromagnetic field is described by Maxwell's equations and the Lorentz force law.
At the time of propagation of the electricity, the field is assumed as a precondition, which is present throughout the space. The electric component is considered to be in phase with the voltage and the magnetic component of the field is considered to be in phase with the current. Electromagnetic energy moves through the space, while corresponding fields, grow and decline in a region of space in response to the flow of energy.
Electromagnetic waves can be generated by the oscillating molecular dipole. Speed of electromagnetic wave is properties of the "medium" of propagation - permeability and permittivity of the substance. Electromagnetic wave propagates in the vacuum with speed of light, however in solid state or in liquids wave has the lower velocity. Velocity of the ECG signal is higher than 250 m/s [14]. Detection of magnetic fields produced by ionic currents in living tissue as well, as the better known electric fields, has been reported in the heart and the brain [15].
Electromagnetic waves generated at the propagation of the ac current in the excitable cells. It is non spontaneous process and each action potential needs energy from the ATP. The heart’s total electrical activity at the any instant of time may be represented by a rotating distribution of active current dipoles. (Figure 5) Influence of the epicardial electric field, distributes to the all body cells and also to the charged erythrocytes.
High number of the red blood cells, net charge (zeta potential), magnetic features of the hemoglobin, short life span and rapid multiplication can be associated with the high functional significance of the erythrocytes in the promotion of the electromagnetic blood flow.
In humans, approximately 2.4 million new erythrocytes are produced per second. The cells circulate for about 100–120 days in the body before their components are recycled by macrophages. Approximately a quarter of the cells in the human body are the red blood cells. Nearly half of the blood's volume (40% to 45%) is the red blood cells.
Velocity of the ECG wave propagation in the human body is at least 3 times higher than the maximum velocity of neuronal electric signal conductance. Metabolic pathway in neuron is the oxidative phosphorylation. There is energetically faster way, for the propagation electric signal from the heart: erythrocytes do not containing mitochondria and do not use the oxygen they transport. Instead they produce the energy carrier ATP by the anaerobic glycolysis. Lacking a storage compound, the normal erythrocytes must have constant access to glucose, for energy metabolism is to be sustained [16]. Anaerobic glycolysis is an effective means of energy production during short, intense exercise. It replenishes very quickly over this period and produces 2 ATP molecules per glucose molecule. It is only 5% of glucose energy potential. The speed at which ATP is produced is about 100 times higher, that of oxidative phosphorylation.
Red blood cells are in perpetual vibration. Those vibrations help the cells maintain their characteristic flattened oval or disc shape, which is critical to their ability to deform as they traverse blood vessels in the body to deliver oxygen to tissues. The vibrations amplitude is tiny and occurs in just milliseconds. It is present conclusive evidence that the vibrations require energy input from ATP. The researchers used diffraction phase microscopy, which quantitatively measures the vibrations in the cell membrane in real time. The optical phase delay, a measure of how much the light is delayed as it passes through the cell, changes as the membrane vibrates. They found that when ATP was depleted in red blood cells, vibrations decreased by 20 percent [17]. When ATP was reintroduced, vibrations increase back to the normal level. They also found a direct correlation between the ATP-induced alteration to membrane vibrations and the length scale of the cytoskeletal structure.
Experiments showed an ATP dependent effect by monitoring the static fluctuation amplitude of RBCs under normal and ATP-depletion conditions. It has been shown that cell mechanics highly depends on themembrane-spectrin interaction mediated by the phosphorylation of the interconnection protein 4.1R. Inhibition and activation of this phosphorylation significantly affects tension and effective viscosity [18].
Erythrocytes have different forms of motion. The “tank-treading motion”- steady membrane rotation with constant shape and inclination angle and tumbling - a rotational oscillation of the entire cell accompanied by tank treading motion, which is principally due to the cell membrane and occurs around the cell axis, has very low frequencies of about 1–5 Hz. Erythrocytes oscillate with high-frequency oscillations during the tank-treading motion. This oscillatory motion drastically affects the dielectric and electrical properties of erythrocytes and the blood [19]. Experimental and the theoretical analysis indicate the absence of resonance frequencies in the range of 0.03-500Hz associated with the oscillations of normal human erythrocytes [20].
One of the interesting results shows manipulation of the erythrocytes by magnetite nanoparticles in the presence of a magnetic field - periodic motion of erythrocytes between the two conducting contours, whose frequency is controlled by an electric circuit. The obtained results demonstrate the feasibility of non-destructive cell manipulation by magnetic nanoparticles with micrometer-scale precision. Electro-rotation of the micro particles arises, when a colloidal solution is subjected to an external ac-electric field [21.22]. It is a dielectric spectroscopy method for the characterization of dispersed colloids. The general cause of the particle rotation is a phase difference, which occurs between the electric field-induced polarization and the external rotating fields [23]. The rotation frequency (f0) could be calculated with the absolute value of the phase difference and the particle's induced dipole moment, together with the viscosity frictional forces. In the different references there is a common intrinsic ultrasound frequency of erythrocytes, f0∼ 1.2MHz [19].
It can be shown, when irradiated with a laser pulse, red blood cell absorbs the optical energy and emits an ultrasonic pressure wave called a photo acoustic wave. RBCs contain large amounts of hemoglobin, a molecule capable of binding oxygen. Hemoglobin significantly absorbs visible light. Photo acoustic signal amplitude and bandwidth depend on the shape of the erythrocyte orientation to the transducer. It is higher when the erythrocyte area is perpendicular to the transducer [24].
When ultrasound propagates through the heterogeneous fluid, dispersion or emulsion, colloid vibration current and potential arises: the pressure gradient in the ultrasonic wave shears particles diffuse layer relative to the fluid and particles gain a dipole moment [25-26]. Dipole moments generate an electric field and forms measurable electric current. This phenomenon is used for measuring zeta potential in colloids.
Electric sonic amplitude and acoustic field arises when an electric wave propagates through a heterogeneous fluid: after absorbing energy, the particles rapidly increase in temperature and pressure, resulting in a thermo elastic expansion and emission of a photo acoustic wave.
In light of the above mentioned, it can be concluded, that the electric dipole field oscillation from the heart, can be absorb by the erythrocytes and forming ultrasonic electro acoustic wave. Energy transferring by the wave is directly proportional to the oscillation frequency. Erythrocytes are in perpetual vibration. External oscillating electric field activates the ATP synthesis, with the modulation of the cell intrinsic vibration amplitude/frequency. Energy transferring by the oscillating erythrocyte in ultrasound frequency, becomes the advantage. Carrier frequency is represents by the intrinsic oscillation of the erythrocytes (Figure 5).
Erythrocyte has biconcave/parabolic shape, the geometry and energetic possibility to receive and transferring directed energy: signal amplitude from the red blood cell is increases in perpendicular direction to the biconcave surface of the erythrocyte. Fluid oscillation around the erythrocytes, forms ac current and potential. Electric current generated by the heart dipole rotation can be transfered distally with the vibration of the erythrocyte as the measurable ac current - ECG (Figure 4, Figure 5).
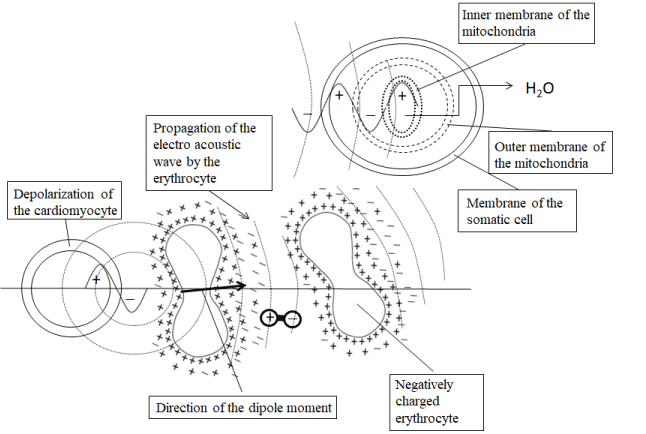
Figure 4. Electro acoustic wave, colloid vibration current and potential in the arterial blood flow promoted by the intrinsic ultrasound oscillation of the erythrocyte membranes. Propagating ac current is directed towards the mitochondria of the somatic cell. It change equilibrium of the electric potentials around the inner membrane of the mitochondria and stimulates the ATP synthesis.
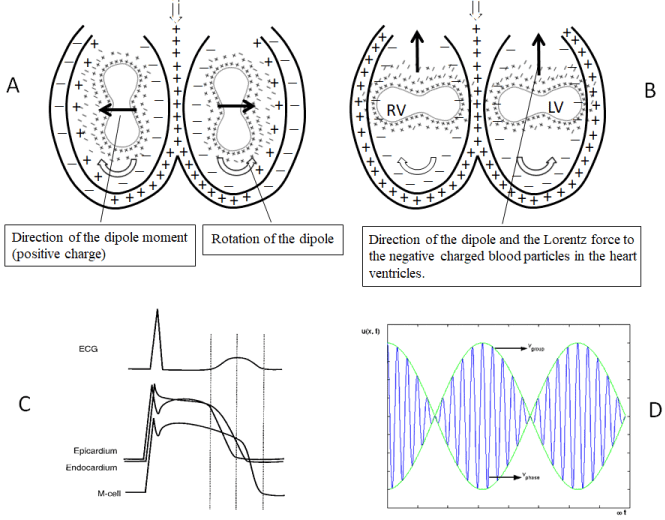
Figure 5. A.B. Propagation of the action potential in the heart muscle as the rotating dipole affects the zeta potential of the blood particles.
C. ECG is forming from the summing signals from the different sources.
D. ECG signal is the electroacoustic wave from the intrinsic oscillation of the erythrocytes modulated by the electrical activity of th heart. It forms propagating in the space the electric signal with the group wave velocity. Phase velocity is the natural oscillation of the erythrocytes, forming the carrier frequency.
Propagation of the ECG is the non-spontaneous process and has energetic basis. Colloid vibration current flows from the heart to the distal direction, due to the potential difference forming with the aerobic glycolysis in the body cells. In eukaryotes electron transport chain in mitochondria produce transmembrane proton electrochemical gradient, as the result of the redox reactions and it serves as the site of oxidative phosphorylation through the use of ATP synthase. At the end of the electron transport chain high electronegative oxygen atom is presents. Here free energy per electron comes to zero, while redox potential is highest. So, internal mitochondrial membrane is the end place destination of the high energy of the chemical bonding with the ATP synthesis and oxygen looks a "grounding tool" for the ECG electric circuit. Figure 4.
Electric field impacts the erythrocytes and the somatic cells. Pulsed, as well as oscillating electric field, were shown to influence activity of the cell membrane proteins as the ATP synthase, which is found in the inner mitochondrial membrane, the inner membrane of bacteria and the thylakoid membrane of chloroplasts [27]. Its function is to convert free energy of the proton-motive force into the chemical energy source ATP [28-29]. Amount of ATP stored in active cells is very low, only sufficient to power a few seconds worth of work. As it is broken down, ATP must therefore be regenerated and replaced quickly to allow for sustained functional activity of the cells.
At the propagation of the action potential in the cardiomyocytes, electromagnetic field must be creating. With this, moving erythrocytes in the heart ventricles, with oscillating electric field, can be affected by the Lorentz force. It closes the atrioventricular valves. The heart muscle and the Lorentz forces works as the ejection tool in forming the blood flow (Figure 6). With the above-mentioned processes, it can be understand pulseless electrical activity of the heart.
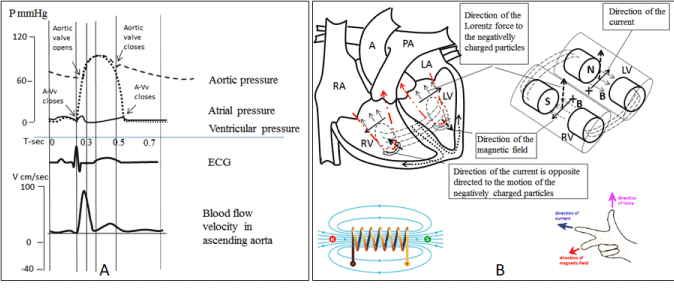
Figure 6.A. Left atrioventricular valve closes, when pressure in the left atrium and ventricle is low. It is coincident with the R peak of the ECG - QRS complex.
B. Wave of the cardiac action potential (positive charge) in the left ventricle rotates in counter clockwise direction and the magnetic field is perpendicular to the heart slice in the out direction (right hand rule). Blood motion (erythrocytes with the negative charge) rotates in clockwise direction forming magnetic field in the same direction. Clockwise rotation of the erythrocytes with the negative zeta potential mathematically is equal to the counter clockwise rotation of the cardiac positive action potential in the fibers of the Purkinje. Erythrocyte’s natural oscillation is modulated by the cardiac action potential. Lorentz force to the negatively charged erythrocytes is directed to the heart valves (right hand rule). ECG-QRS wave is covers the phase of the ventricular isovolemic contraction creates oscillating electric field to the rotating blood cells and plasma substances.
Systolic pulse initiates to the turbulent flow in the Valsalva sinuses and arterial branching flow sites. Accompanying ECG-T wave forms the ac electric current, propagating to the distal direction and increasing electromagnetic interactions at the turbulence sites (Figure 7, Figure 8).
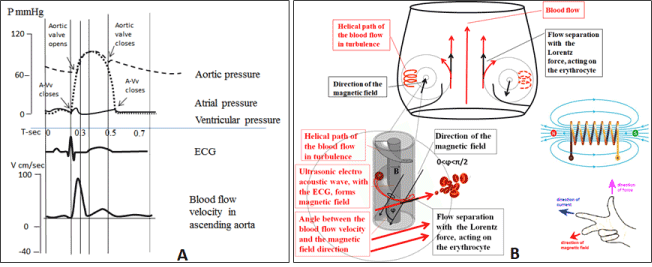
Figure 7. A. ECG-T wave has the delay from the blood fast ejection phase and forms oscillating electric field. Oscillating electric field is transferred distally with the group wave velocity from the intrinsic ultrasound vibration of the erythrocytes, modulated by the heart dipole rotation frequency, creating measurable ECG signal.
B. Helical blood motion in the Valsalva sinuses, with the modulated electroacoustic wave forms the magnetic field. Magnetic field fromthe circle flowing blood affects the tangentially moving erythrocytes (Lorentz force). Kinetic energy (translational and rotational) of the blood increases.
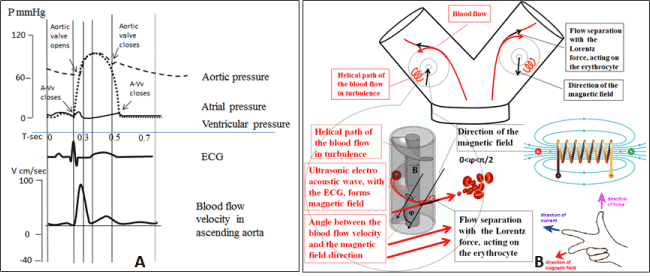
Figure 8. A. ECG-T wave has the delay from the blood fast ejection phase and forms oscillating electric field. Oscillating electric field is transferred distally as the modulated natural vibration of the erythrocytes with the group wave velocity - ECG.
B. Blood flow (erythrocytes with the oscillating charge) at the external walls of the large arteries forms turbulence. Magnetic field from the helical path blood areas affects tangentially flowing erythrocytes (Lorentz force) and with the gradient pressure increases kinetic energy of the blood.
Lorentz force changes the direction of the particle, but not the linear velocity. Charged particle can gain or lose translational kinetic energy from an electric field, but not from a magnetic field, because the magnetic force is always perpendicular to the particle's linear motion. If the angle between the charged particle and the direction of the magnetic field is 0<φ<π/2, the particle will move in helical path about the direction of the magnetic field. It express es in the the rotational force – torque.
Vortices inside the Valsalva sinuses are the major component of turbulent flow. A moving vortex carries with it angular and linear momentum, energy and mass. Vortices is not a chaos: blood flow in heart ventricles, arterial branches is flow in screw form. It increases the accumulation of the energy in the substance.
For the point mass, kinetic energy in the linear motion is: Ek=0.5mv2
At the rotational motion: Ek=0.5mr2 ω2.
(m-mass, v-linear velo2021 Copyright OAT. All rights reserva; -angular velocity).
By the diagrams in the Figure 2. Figure 3 it shown, that the helical motion is initiates in the ventricular outflow tract. With the entering the magnetic field, the rotational and translational kinetic energy of the blood particles in the sinotubular junction increases. The main tools for the rolling motion of the blood in the surface wave at the blood flow surfaces are: a) contraction of the heart muscle and b) electromagnetic Lorentz force, forming from the rotational/oscillating charged erythrocytes modulated by the ECG signal.
Blood vessels are looks like the active electric circuits. Propagation of the electric field/current in the direction of the vessels is due to the micro scale of the blood cell oscillation, rotation of the particles and superposition principle of the electric fields. Oscillating electric field from the cardiac dipole forms the modulated natural ultrasound vibration of the erythrocytes, while it generates colloid vibration current, which affects the nearby erythrocytes by the oscillating electric field and so on to the distal direction and expresses as the ECG. Erythrocytes flow velocity, like the electron drift velocity in conductor, is much low, than propagation of the ac electric field in the medium.
Like the Valsalva sinuses, oscillating charged particles and dipoles in the arterial bifurcation, with the presence of the electric and the magnetic fields experiences the Lorentz force. Electromagnetic repulsion of the blood particles, with the arterial pulse pressure, forms additional driving force for the blood circulation (Figure 7, Figure 8).
Part of the accepted energy is dissipating in the blood motion. With this, increasing resistivity of the blood flow, mostly at the arterioles, dissipates energy, increases the entropy in the arterial end of the capillary and facilitates spontaneous chemical reactions across the cell membrane, in conjunction with the other systemic processes. At the venous end of the capillaries this process is altered. Here aggregation of the erythrocytes increases. This is promoted by the low blood flow velocity, decreasing the pressure oscillation and high compliance in the venous vessels. Electromagnetism can be affect gas exchange in the systemic and pulmonary capillaries due to the different affinity of the oxygen and carbon dioxide in the diamagnetic/paramagnetic hemoglobin.
Reactions which increases entropy and releases heat, are always be spontaneous, have a negative Gibbs free energy-?G. [30].The Gibbs free energy (G= H-TS. H-enthalpy, S-entropy, T-temperature) of a thermodynamically closed system is a measure of the amount of usable energy that can do work in that system. Maximum energy can be extracted only in a completely reversible process.
If the ΔG<0 is an exergonic reaction, spontaneous from the left to the right side.
If the ΔG=0 the state of thermodynamic equilibrium.
If the ΔG>0 is an endergonic reaction, which either needs energy input from outside to run from the left to the right side of the reaction equation, or otherwise runs backwards, from the right to the left side.
Reaction endergonic in one direction, must be exergonic in the other, and vice versa. In biochemical systems, endergonic and exergonic reactions often are coupled, so the energy from one reaction can power another reaction. Typical exprssion of this process is the gas exchanges at the at the pulmonary and systemic capillaries from the one hand and the cellular reactions at the arterial and venous ends of the capillaries, on the other hand.
The reaction that is at equilibrium can no longer do any work, because the free energy of the system is as low as possible. Any change that moves the system away from equilibrium increases the system’s free energy and requires the work. This work is made by the additional electromagnetic force, coming from the blood and directed to the all living cells of the body by the activation of the ATP synthase and increasing the entropy. Modulation of the frequency/ amplitude of the erythrocyte’s intrinsic vibration is required in order to convey information about ATP synthesis, and represents the ECG signal content. So, cardiovascular system, besides the other functions, promotes propagation of the electromagnetic energy/information and the blood particles are take active role in this.
Conclusion
Availability of the heart, as the possible single tool for the blood flow, looks imperfect. Electric oscillate field from the heart dipoles can be impact to the erythrocytes forming the modulated naturally ultrasound vibration and associated with it colloid vibration current propagating distally to the all cell membranes.
Blood motion in the heart chambers and arteries has the additional basis, besides the heart contraction: rotating blood particles in the heart chambers and in the arterial branching sites, with the concomitant oscillating electric field triggered from the heart, forms additional electromagnetic repulsing force for the charged particles, providing to the flow.
Modulating ac electric field, transmitting by the oscillate blood particles, besides the flow, creates additional energy/signal source, enabling the spontaneous chemical reactions proceed across the cell membranes.
References
- Martins e Silva J (2009) From the discovery of the circulation of the blood to the first steps in hemorheology: part 1. Rev Port Cardiol. 28:1245-68. [Crossref]
- Linda S (2010) Costanzo.Physiology. Saunders.
- Koehler, Kenneth R (1996) College Physics for Students of Biology and Chemistry. Cincinnati, OH: Raymond Walters College University of Cincinnati, Chapter 3, Fluids: Human Cardiovascular System.
- Markl M, Alley MT, Elkins CJ, Pelc NJ (2003) Flow effects in balanced steady state free precession imaging. Magn Reson Med 50: 892-903. [Crossref]
- Jearl Walker. Fundamentals of Physics. Cleveland State University. John Wiley & Sons.2011.
- Mao SS, Ahmadi N, Shah B, Beckmann D, Chen A ( 2008) Budoff. Normal Thoracic Aorta Diameter on Cardiac Computed Tomography in Healthy Asymptomatic Adult. Impact of Age and Gender. Acad Radiol. 15: 827-834. [Crossref]
- Ivanov KP, Kalinina MK, Levkovich YuI (1981) Blood flow velocity in capillaries of brain and muscles and its physiological significance. Microvascular Research. 22: 143-155. [Crossref]
- Avolio AP, Van Bortel LM, Boutouyrie P, Cockcroft JR, McEniery CM, et al. (2009) Role of Pulse Pressure Amplification in Arterial Hypertension. Hypertension. 54:375-383.
- Safar, Michael F. O'Rourke, Edward D. Frohlich (2014) Blood Pressure and Arterial Wall Mechanics in Cardiovascular Diseases. Springer-Verlag. London.
- Pereira T, Correia C, Cardoso J (2015) Novel Methods for Pulse Wave Velocity Measurement. J Med Biol Eng 35: 555-565. [Crossref]
- Edward M. Dzialowski, Dane A. Crossley.The Cardiovascular System., in Sturkie's Avian Physiology (Sixth Edition), 2015.
- McLaughlin J, McNeill M, Braun B, McCormack PD (2003) Piezoelectric sensor determination of arterial pulse wave velocity. Physiol Meas 24: 693-702. [Crossref]
- Y.C.Fung (1996) Biomechanics: Circulation. Springer Science&business Media.
- Teodor Buchner, Jan Gieraltowski (2015) How fast does the ECG signal propagatewithin the body. Working Group for Cardiovascular Physics. Faculty of Physics,Warsaw University of Technology. Sixth Cardiology Meets Physics & Mathematics, At Zakopane, Volume: VI.
- Wulfson NL, Sances Jr A. Magnetic fields associated with nervous conduction. The Nervous System and Electric Currents. Plenum Press, New York 1970.
- Bonora M1, Patergnani S, Rimessi A, De Marchi E, Suski JM (2012) ATP synthesis and storage. Purinergic Signal 8:343-357. [Crossref]
- Anne Trafton. MIT News Office. Massachusetts Institute of Technology. "Chemical energy influences tiny vibrations of red blood cell membranes." Science Daily 2009.
- Betz T1, Lenz M, Joanny JF, Sykes C (2009) ATP-dependent mechanics of red blood cells. Proc Natl Acad Sci U S A 106: 15320-15325. [Crossref]
- Abdalla S (2011) Effect of erythrocytes oscillations on dielectric properties of human diabetic-blood. AIP Advances1, 012104.
- Kononenko VL and Shimkus JK (2000) Spontaneous and Forced Oscillations of Cell Membrane of Normal Human Erythrocytes: Absence of Resonance Frequencies in a Range of 0.03–500 Hz. Membr. Cell Biol., 14: 367–382. [Crossref]
- Frederick Gertz and Alexander Khitun.Biological cell manipulation by magnetic nanoparticles AIP Advances 6, 025308 (2016).
- A.Ramirez, A.Zehe. Forced Low-Frequency Cell Oscillations In Human Blood Suspensions. First International Meeting on Applied Physics. October 13-18th 2003, Badajoz, Spain.
- An Ran. "Electrochemical Processes in Microfluidics Systems Under AC Electric Fields", Dissertation, Michigan Technological University, 2015.
- Strohm EM, Berndl ES, Kolios MC (2013) Probing red blood cell morphology using high-frequency photoacoustics. Biophys J. 105:59-67. [Crossref]
- Schwarz, Thomas. Doctoral Thesis. Rotation of Particles by Ultrasonic Manipulation. 2013.
- Velev OD, Gangwal S and Petsev DN (2009) Particle-localized AC and DC manipulation and electrokinetics. J. Annual reports Selection “C”( Physical Chemistry). v105.
- Capaldi RA, Schulenberg B, Murray J, Aggeler R (2000) Cross-linking and electron microscopy studies of the structure and functioning of the Escherichia coli ATP synthase. J Exp Biol. 203:29-33. [Crossref]
- Zrimec A, Jerman I, Lahajnar G (2002) Alternating Electric Fields Stimulate ATP Synthesis in Escherichia Coli. Cell Mol Biol Lett. 7: 172-174. [Crossref]
- Hans Bauermeister,Eberhard Schlodder,Peter Gräber. Electric Field-Driven ATP Synthesis Catalyzed by the Membrane-Bound ATP-Synthase from Chloroplasts.Berichte der Bunsengessellschaft fur physikalische Chamie.Volume92, Issue9September 1988.
- Eric Brian Smith. Basic Chemical Thermodynamics. Imperial College Press. 2004 - Science.


