Key words
spontaneous daily living activity, free-living conditions, body mass index physical activity time sedentary time, smartphone application
Abstract
Physical inactivity and long sedentary time are involved in the development of chronic diseases. The aim of this study was to compare the intensity of spontaneous physical activity in two population samples consisting of 30 normal weight and 30 overweight or obese adults. Physical activity on an ordinary day was evaluated using the eMouveRecherche application that collected and sent smartphone accelerometry data to the ActivCollector Web platform via Internet. The algorithms implemented on the platform can accurately discriminate between sedentary and active behaviors, including their duration expressed in minutes and in percentage of waking period, in real time and ecological conditions. Physical activities are divided into four categories by the algorithms according to their intensity: immobility, light, moderate and vigorous intensity. The data were collected in 2013 and 2014 in Clermont-Ferrand and analyzed in 2015-2017. Time spent in only two categories was found to differ between the two populations. Immobile activities were longer in overweight than in normal weight participants (652 min vs. 504 min, 81.4% vs. 65.0%, p<0.0001). In contrast, the light-intensity activities were more popular in normal weight than in overweight participants (215 min vs. 124 min, 29.5% vs. 15.4%, p<0.0001). No difference was observed for either the moderate- or vigorous-intensity categories. BMI and waist circumference were positively correlated with immobility and negatively with light-intensity activities. The results provided additional interesting indications in terms of time spent in light-intensity activities associated with normal weight status and seem to support the positive effect of this activity category on health.
Highlights
- eMouveRecherche discriminates between normal- and overweight participants’ activities.
- Overweight and normal weight subjects are sedentary 80% and 65% of the time.
- Light activities take up 29% and 15% of the time in normal and overweight subjects
- No difference in time is spent in moderate activity in either weight status category
- Long light-intensity activity is associated with lower BMI and waist circumference
Introduction
The promotion of physical activity has proved to be effective in the prevention of non-communicable diseases [1]. However, about one-third of the population worldwide does not adhere to the guidelines that recommend 150 minutes of moderate-intensity activity/week or at least 75 minutes of vigorous-intensity activity per week and a decrease in time spent in sedentary behaviors [2,3]. Moreover, since excessive weight increases the risk of mortality, the nature of the relationships between the intensity, duration of physical activity and body mass index (BMI) have received much attention. Recently, [4] found that BMI was negatively correlated with increased physical activity measured by accelerometry. Moreover, in a study aiming to determine associations between biological-behavioral-psychological parameters and objectively measured physical activity and sedentary time with a 13-year follow-up, each unit increase of BMI from baseline to follow-up was negatively associated with moderate and vigorous physical activity [5]. In addition to studying the health benefits of moderate-to-vigorous physical activity, researchers have shown an increasing interest in very low levels of movement and sedentary behaviors. While the obvious examples of such behaviors are TV viewing and playing computer games, there are many daily sitting behaviors, including car travel, socializing, reading, and listening to music, as well as long periods spent sitting at work. It is all of the sedentary behaviors that are of interest to health researchers and policy makers [6]. Therefore, the association between obesity and sedentary behaviors was less obvious than between obesity and physical activity in adults, as stressed by the review of reviews [7]. For [8], sitting time is associated with obesity in adults, independently of physical activity because adults seated more than 8 hours per day had 62% higher odds of obesity risk compared to those seated for less than 4 hours per day. Some evidence exists that breaks in sedentary time may be associated with a more favorable BMI.
Management of obesity is primarily based on lifestyle modification with the increase in physical activity and healthy diets [9]. It is a very difficult task to change ingrained behavioral patterns that deal with physical inactivity and fatty, sweet or ultra-transformed diets and to maintain sound, long-term health habits [10]. This type of behavioral management is dispensed by multidisciplinary health professionals such as dieticians, physicians, psychologists and professionals in the field of physical activity. This multidisciplinary approach is successful when the contacts between the patients and the personal staff are frequent. Its cost is therefore high and time-consuming. Other tools have to be proposed in addition to normal heath follow-up for the purpose of sustainable health care.
There is a growing interest today towards the adoption of novel information and communication technologies (ICT) in the field of medical monitoring and personal health care systems [11]. The use of ICT can facilitate patient education and improve self-management of chronic diseases [12]. In the past decade, smartphones have become popular daily-living objects. They have been well adopted by the general population and people can no longer live without them. Since smartphones contain a sensitive triaxial accelerometer, they can assess physical activity in free-living conditions. Moreover, the Internet connection makes it possible to send user-friendly feedback and lifestyle benchmarks to the smartphone. These personalized feedback mechanisms can help users to be conscious of their physical inactivity and the gap between what they are doing and what they should do, potentially leading to behavioral changes.
Since we are strong believers in the effectiveness of the ICT application for healthcare, we developed an Android application (eMouveRecherche) that can be downloaded at the Playstore. This application is dedicated to research projects that quantify the time spent in four activity categories related to their intensity. The activity categories were chosen to represent different energy costs. The activity intensities are expressed in metabolic task (MET): immobile [0.9-2.0 MET], light [2.0-3.5 MET], moderate [3.5-6 MET] and vigorous intensity [6.0-9.0 MET] [13] Since the energy cost depends not only on the activity but also on the individual’s characteristics (sex, age, weight and height), the MET values were personalized, as recommended by [14]. Their algorithms estimated the time spent in each category. They were specifically designed to estimate, on the one hand, the daily-living activities of normal weight adults and, on the other, the activities of overweight/obese adults in free-living conditions. The algorithms were validated against reference methods commonly used in energy metabolism and recently published [15,16].
In this paper, we used the eMouveRecherche application to explore and compare spontaneous physical activities carried out by normal weight and overweight/obese people in free-living conditions. Thus, the first aim was to compare time not only estimated in minutes but also in percentage of the waking period between the two population samples. The second objective was to identify possible relationships between anthropometric and physiological parameters and participants’ activity profiles.
Methods
Participants
Two groups of adult participants, either normal weight or overweight/obese, were studied in free-living conditions. During the preliminary visit, they were given a resting electrocardiogram validated by a cardiologist (ECG cardimax FX-7202, Fukuda Denshi). They were weighed, and their height, neck, waist and hip circumferences were measured. Moreover, their diastolic and systolic arterial pressure and resting heart rate were measured using a Spengler manual tensiometer. The participants were told to maintain their current habits for the waking period of one day, i.e., free and spontaneous activities. Each participant was instructed to wear an Android smartphone (Samsung Galaxy xCover or LG Nexus4 or Nexus 5 or the participant’s smartphone) in the left pants pocket. The eMouveRecherche application collects the smartphone accelerometry data at 6 Hz. The raw accelerometry data were then sent via Internet to the ActivCollector Web platform (https://activcollector.clermont.inra.fr) where they were immediately compiled and analyzed according to the algorithms designed in [15,16]. The algorithms were validated under controlled and free-living conditions against reference methods (Armband and Fitmate Pro). The mean gaps in absolute value between the total energy expenditure (TEE) estimated by the algorithms and the reference methods in free-living conditions were approximately 5.7% and 8.5%, respectively, in normal weight and overweight/obese participants. The treatments results, i.e., time spent in each activity category expressed in minutes or in percentage, and energy expenditure during the waking period were available on the Web platform.
The protocol was approved by the French Committee for the Protection of Human Subjects (Sud-Est VI). It was registered under the references 2013-A00188-37 and 2013-A01140-45 in the ANSM system, and under the references NCT01995162 and NCT02348554 in Clinical Trials. The participants signed an informed consent form before beginning the clinical trial.
Data collection took place in 2013 and 2014. The data analyses were performed in 2015. The participants’ characteristics are presented in Table 1 and correspond to a population-based approach dedicated to men and women within an extended age range and with a normal BMI in the first group. Being overweight or obese, the participants of the second group were older and had a higher BMI than those of the first group. The mean recording time for the normal weight and overweight/obese participants was 756 min ± 154 min and 805 ± 120 min, respectively.
Table 1. Participants’ characteristics (mean ± SD) and differences between weight statuses and genders. Data collected in Clermont-Ferrand (France) in 2013 and 2014.
Weight status |
Normal-weight |
Overweight/Obese |
Effect |
Gender |
Male |
Female |
Male |
Female |
Weight |
Gender |
Interaction |
n |
15 |
15 |
15 |
15 |
|
|
|
Age (year) |
33.6 ± 10.8 |
32.5± 7.9 |
46.2 ± 8.5 |
45.7 ± 9.5 |
*** |
ns |
ns |
Height (cm) |
173.9 ± 7.0 |
165.6± 8.1 |
174.3 ± 6.6 |
162.9 ± 5.2 |
ns |
*** |
ns |
Weight (kg) |
69.3 ± 6.5 |
59.6 ± 9.2 |
94.6 ± 11.8 |
97.8 ± 15.8 |
*** |
ns |
* |
BMI (kg.m-2) |
22.9 ± 1.4 |
21.6± 2.1 |
31.0 ± 2.4 |
36.7 ± 4.0 |
*** |
** |
*** |
Neck circumference (cm) |
37.2 ± 2.6 |
32.7 ± 1.9 |
42.8 ± 2.2 |
38.4 ± 1.7 |
*** |
*** |
ns |
Hip circumference (cm) |
88.9 ± 4.7 |
91.3 ± 11.7 |
108.2 ± 7.9 |
121.9 ± 9.1 |
*** |
** |
** |
Waist circumference (cm) |
81.5 ± 6.1 |
74.8 ± 7.2 |
107.6 ± 7.6 |
106.4 ± 9.4 |
*** |
* |
ns |
Waist to hip ratio |
0.92 ± 0.05 |
0.82 ± 0.07 |
0.99 ± 0.05 |
0.87 ± 0.05 |
*** |
*** |
ns |
Systolic pressure (mm) |
118.0 ± 12.9 |
112.3 ± 11.8 |
125.0 ± 8.2 |
124.7 ± 11.8 |
** |
ns |
ns |
Diastolic pressure (mm) |
68.0 ± 7.7 |
66.0 ± 6.3 |
74.1 ± 10.9 |
73.2 ± 8.7 |
** |
ns |
ns |
Resting heart rate (beat.min-1) |
63.5 ± 9.1 |
67.1 ± 9.8 |
70.8 ± 11.2 |
66.8 ± 7.9 |
ns |
ns |
ns |
|
|
|
|
|
|
|
|
***: p < 0.001, **: p < 0.01; *: p < 0.05; ns: not significant |
Statistical analyses
A two-way analysis of variance was carried out to determine the effect of weight status, sex and their interaction on time spent in each activity category expressed in minutes or in percentage of the waking period. When time spent in each activity category between weight status or sex differed significantly, the means were compared using a Newman & Keuls test. Statistical significance was set at p<0.05. The linear relationships between variables were studied by calculating the correlation coefficients for the whole sample and by gender.
All statistical analyses were performed using SAS 9.4 software.
Results
Influence of weight status and gender on the anthropometric and physiologic parameters and activity time
All of the results related to participants’ characteristics and time estimations can be downloaded from ActivCollector at https://activcollector.clermont.inra.fr/home/publications/ActivityProfile.
The two-way analysis of variance showed significant differences between both weight status and both genders for the anthropometric measurements. Thus, the neck, hip and waist circumferences were larger in overweight/obese than in normal weight participants (+5.8 cm, p < 0.0001; +24.4 cm, p < 0.0001; +28.9 cm, p < 0.0001, respectively). Moreover, the waist-to-hip ratio was 0.06 higher (p < 0.0001). In terms of the gender effect, men had a larger neck (+4.6 cm, p < 0.0001) and waist circumference (+4.7 cm, p = 0.03), waist-to-hip ratio (+0.11 cm, p < 0.0001), and a lower hip circumference (-7.6 cm, p = 0.003) than women. Moreover, there was a significant weight status*gender interaction on hip circumference (p = 0.007). The increase in hip circumference was higher in women (+30.6 cm) than in men (+19.5 cm) when people move from normal weight to overweight status.
The systolic and diastolic arterial blood pressures were different between the two weight statuses without gender effect. The systolic and diastolic arterial blood pressures were 9.7 and 6.6 mm Hg higher in overweight/obese than in normal weight subjects (p = 0.002 and 0.004, respectively). No difference occurred for resting heart rate (p = 0.23).
Age in the two weight statuses was different without an effect of gender. Thus, the overweight/obese participants were 12.5 years older than the normal weight participants (p < 0.0001).
As regards the activity time, the two-way analysis of variance did not show any difference in total recording time between weight status and gender (Table 2). The average recording time was 780 minutes. However, time spent in immobility or in light-intensity activities differed significantly between the normal weight and the overweight/obese participants without gender effect or gender*weight status interaction. Thus, the overweight/obese participants remained spontaneously immobile (i.e., sitting) 148 minutes more than the normal weight participants during the waking period (p = 0.0003). Expressed in percentage of the waking period, this percentage was also significantly higher (80.9 % vs. 65.2%, p < 0.0001). As regards light-intensity activities (such as slow walking), the overweight participants spent less time (-91 minutes, p < 0.0001) than the normal weight ones. The percentage of time dedicated to this type of activity was also lower (29.5% vs. 15.5%, p < 0.0001) in overweight/obese subjects. In contrast, no difference in moderate or vigorous-intensity activities was observed in either weight group (Table 2). Thus, normal weight and obese people spent 34 and 28 min in moderate-intensity activities, and 3 min and less than 1 min in vigorous-intensity activities. However, for the vigorous-intensity activities, the ANOVA model showed a trend gender effect (p = 0.07) and a trend interaction (p = 0.09) that favored men. Moreover, time spent in vigorous activity was slightly longer in normal weight compared to overweight/obese men, whereas it was similar in women of both weight statuses.
Table 2. Effect of weight status and gender on time spent in each of the four activity categories (Mean ± SD). Data analyses performed in Clermont-Ferrand (France) in 2015.
Variables |
Normal weight |
Overweight/obese |
Weight status effect |
Men |
Women |
Gender effect |
Recording (min) |
|
|
|
|
|
|
Total recording |
756 ± 152 |
805 ± 120 |
ns |
775 ± 132 |
787 ± 145 |
ns |
Immobility |
504 ± 169 |
652 ± 120 |
*** |
556 ± 151 |
601 ± 174 |
ns |
Light activity |
215 ± 90 |
124 ± 119 |
*** |
177 ± 84 |
162 ± 90 |
ns |
Moderate activity |
34 ± 31 |
28 ± 25 |
ns |
38 ± 34 |
24 ± 21 |
ns |
Vigorous activity |
3.0 ± 10.0 |
0.3 ± 0.9 |
ns |
3.5 ± 10.4 |
0.2 ± 0.6 |
t |
|
|
|
|
|
|
|
Recording (%) |
|
|
|
|
|
|
Immobility |
65.2 ± 15.1 |
80.9 ± 7.7 |
*** |
71.1 ± 13.8 |
74.9 ± 14.7 |
ns |
Light activity |
29.4 ± 13.6 |
15.4 ± 6.4 |
*** |
23.3 ± 11.8 |
21.6 ± 13.7 |
ns |
Moderate activity |
4.9 ± 4.6 |
3.6 ± 3.4 |
ns |
4.9 ± 4.6 |
3.5 ± 3.4 |
ns |
Vigorous activity |
0.4 ± 1.5 |
0.005 ± 0.150 |
ns |
0.5 ± 1.5 |
0.02 ± 0.12 |
t |
|
|
|
|
|
|
|
***: p < 0.001; t: p < 0.10; ns: not significant |
|
|
|
|
|
|
Relationships between anthropometric and physiological parameters and the percentage of time spent in the four activity categories for the waking period
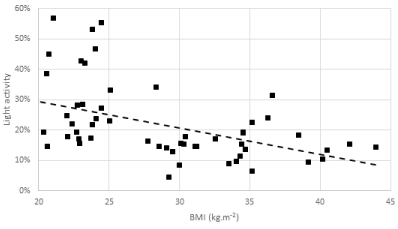
In this section, the significant correlation coefficients were calculated between the behavioral components and the anthropometric or physiological parameters collected on the 60 participants. The BMI and body weight were significantly positively correlated with immobile activity duration (%) (r = 0.47, r = 0.42, p < 0.001) and negatively with light-intensity activity duration (%) (r = -0.46, p < 0.001; r = -0.41, p = 0.001). Thus, when the BMI ranged between 20-25 kg.m-2, time spent immobile can be highly variable (from 32% to 85%), whereas when the BMI was higher than 25, the variability of the time dedicated to immobility was considerably reduced: between 64% and 93% (Figure 1). For time spent in light-intensity activities, the range was on the same order of magnitude: from 15% to 57% and from 4% to 34% for the normal weight and overweight/obese subjects, respectively (Figure 2). The hip and waist circumferences were positively correlated with time spent immobile and negatively with time spent in light-intensity activities (r = 0.49, p < 0.001; r = 0.41, p=0.03; r = -0.50, p < 0.001; r = -0.42, p = 0.002, respectively; Figure 3). Finally, the participant’s age was only marginally correlated with immobile activities (r = 0.23, p = 0.08).
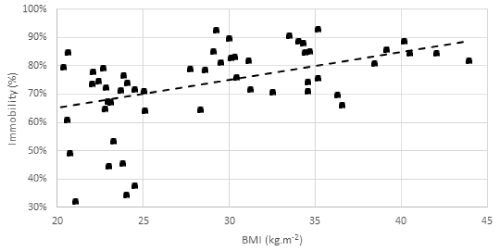
Figure 1. Positive relationship between time spent immobile (%) and BMI

Figure 2. Inverse relationship between time spent in light-intensity activities (%) and BMI
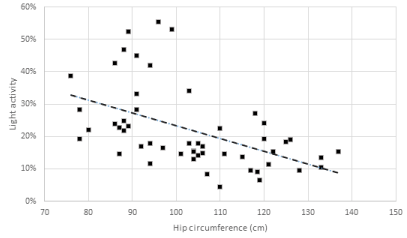
Figure 3. Inverse relationship between time spent in light-intensity activities and hip circumference
Variations in variable association according to gender
The strength of correlations varied according to the variables and between the male and female participants. The BMI, waist circumference and waist-to-hip ratio were more strongly related to immobility (%) in men than in women (r = 0.57, p = 0.001; r = 0.53, p= 0.004; r = 0.39, p = 0.04 vs. r = 0.41, p = 0.01; r = 0.37, p = 0.06; r = -0.17, p = 0.40; Figure 4). The same observations hold between men and women for BMI, waist circumference, waist-to-hip ratio and light-intensity activities (r = -0.57, p = 0.001; r = -0.54, p = 0.003; r = -0.39, p=0.04 vs. r = -0.42, p = 0.02; r = -0.37, p = 0.06; r = 0.20, p = 0.33). Furthermore, in women, the neck circumference and the resting heart rate were not correlated with either sedentary or active times, whereas they were in men. In men, the resting heart rate was positively associated with immobility and negatively with light-intensity activities (r = 0.45, p = 0.01; r = -0.41, p = 0.02; Figure 5). The neck circumference was negatively correlated with light-intensity activity (%) (r = -0.49, p = 0.008; Figure 6) and positively correlated with immobility (r = 0.45, p=0.01). Moreover, the systolic arterial blood pressure was marginally associated with the light-intensity activities in men (r = -0.34, p = 0.06).
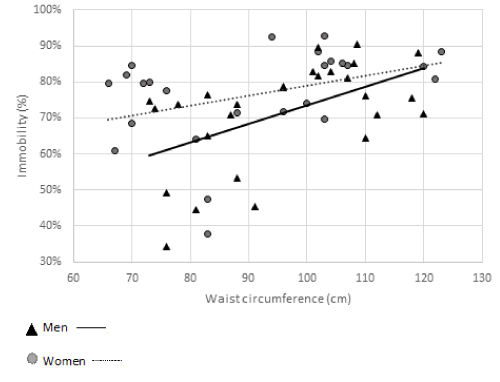
Figure 4. Different relationships between waist circumference and immobility in men and in women
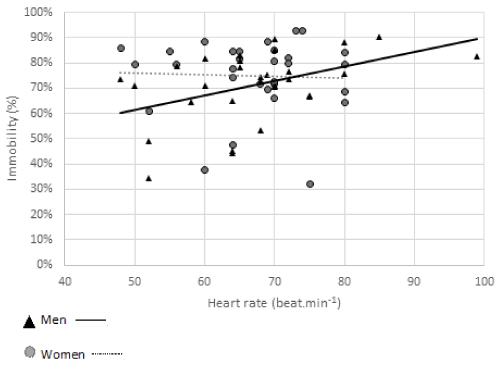
Figure 5. Positive relationship between resting heart rate and immobility (%) only in men
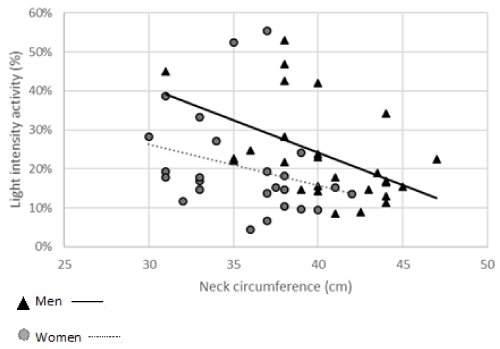
Figure 6. Negative relationship between neck circumference and light-intensity activities (%) only in men
Discussion
The major contribution of our work is to use a common wearable tool (smartphone) that most people own to objectively measure sedentary behavior and physical activity. Because of the work done beforehand [15,16], the results of the present study are expected to be accurate and able to detect small differences in behavior. The results showed different activity profiles between the two weight statuses recorded for one day of spontaneous activity. The difference was related only to the immobile and light-intensity activities. The overweight/obese participants remained immobile almost 11 hours on average, compared to 8 hours for their normal weight counterparts. These immobility durations represented 81% and 65% of the waking period. According to [8], sitting time is associated with obesity in adults. Participants who reported the highest sitting time (>= 8 hours/day) had 62% higher odds of obesity compared to participants who sat less than 4 hours/day. [17] also confirmed that overweight and obese adults reported more TV viewing and lower levels of physical activity than normal weight adults. This work also showed that normal weight participants were, on the one hand, mostly sedentary (8 hours out the waking period on average) and, on the other, this sedentary time varied dramatically depending on the person. This behavior alone might not be sufficient to explain the difference in weight statuses. Other behavioral components should play a key role in BMI management such as physical activity and eating habits. These latter were not studied, and this is a limitation of the work. Conversely, the three intensities of physical activity (light, moderate and vigorous) could be assessed and compared in the two population samples using eMouveRecherche.
The duration of light-intensity activities diverged between the normal weight and overweight/obese participants. Thus, the light-intensity activities were more developed in normal weight than in overweight participants. The overweight/obese participants spent 2 hours less in light-intensity activities than normal weight people. The percentage of time spent in light-intensity activities by the normal weight participants was almost double the percentage spent by the overweight/obese subjects. It was recently shown that the loss of light-intensity physical activity because of increased sedentary time suggests that light-intensity physical activity may have a greater health benefit impact than previously thought [18]. For example, [19] found that one hour more of light-intensity activities decreased mortality by 16%.
Very few of the studies used objective research devices such as ActiGraph to assess light-, moderate- and vigorous-intensity activities in large populations, probably because of the high cost of research devices and/or the need for a laboratory environment. Like the smartphone, ActiGraph uses accelerometry data to assess time spent in different activity categories. [20] used ActiGraph to study physical activity and sedentary behaviors of European participants and found that obese people had a significantly higher odds ratio of sitting more than 10 hours per day than normal weight people. However, regardless of their BMI (< 25, 25 - 30, > 30 kg.m-2), the participants spent about 60-62% of their time in sedentary behavior, 34-35% in light activity, 3-4% in moderate-intensity activities and 0.08-0.4% in vigorous-intensity activities (Electronic Supplementary Material Table S1). In another study using ActiGraph, [18] found that middle-aged adults (22.3% of whom were overweight) spent 61.5% in sedentary time, 25.0% in light-, 12.8% in moderate-, and 0.04% in vigorous-intensity activity. The sedentary behaviors of normal weight subjects were assessed in the same proportion (approximately 60-65%) by eMouveRecherche and ActiGraph. The time percentage spent in light-intensity activity by normal weight participants was situated midway between the percentages indicated by [18,20]. By contrast, these values were far from those concerning the time percentages of the overweight/obese participants. A potential reason for discrepancy in findings could be due to the difference in physical activity estimations given by ActiGraph and eMouveRecherche.
In the present study, the time spent in moderate- and vigorous-intensity activities was similar between the two weight statuses (4.9% vs. 3.6%, 0.4% vs. 0.005%) and close to those observed by [20]. Surprisingly, the mean time spent in moderate-intensity activities was close to the 30 minutes recommended by international physical activity guidelines, regardless of the participant’s BMI. Furthermore, the same proportion of normal weight (53%) and overweight/obese participants (63%) failed to reach the 30 minutes of moderate-intensity activities.
The present results showed on the one hand positive relationships between time spent immobile and BMI or waist circumference or resting heart rate, and on the other negative relationships between time spent in light-intensity activities and waist or hip circumferences. This work confirmed previous significant relationships between sedentary time or physical activity duration measured objectively by monitors and anthropometric characteristics. Thus, [21] measured different behaviors with ActiGraph in normal weight, overweight and obese adults. They found that the longer the sedentary time was, the higher the BMI, waist circumference and systolic arterial pressure would be. [22] also found positive associations between waist circumference, BMI and prolonged sedentary time evaluated in patients with diabetes. Furthermore, higher mean light-intensity physical activity (+30 min.d-1) was significantly linked to lower waist circumference (-1.33 cm—-0.22 cm). In the study of [23] where 30 minutes of sedentary time was replaced by standing time, the waist circumference, fat percentage and BMI decreased significantly (-0.50 cm, -0.29% and -0.17 kg.m-2, p < 0.001, respectively). In the Nhanes 2005-2006 study, [24] also found that replacing 30 minutes per day of sedentary time with MVPA resulted in lower waist circumference, triglycerides, glucose and insulin, and higher HDL-cholesterol. Replacing sedentary time with light-intensity activities was also beneficial on triglyceride and insulin values. Thus, these authors concluded that the reallocation of sedentary time with active behaviors can generally be considered healthy for the population. Furthermore, interrupting prolonged sitting with brief bouts of light walking resulted in a significant lower mean resting heart rate and blood pressure than uninterrupted sitting [25]. [26] also showed that 30 minutes of brisk walking was effective in decreasing acute and next-day systolic blood pressure in young men.
Conclusion
Sedentary behaviors were more developed in overweight/obese than in normal weight subjects. In contrast, light-intensity activities were less performed by the overweight/obese participants. Our results confirm those of other studies that even spontaneous, short-duration light-intensity activities are associated with healthier values of anthropometric or physiological parameters such as waist circumference, BMI, resting heart rate and blood pressure. Because of the positive associations found between health parameters and light-intensity activities, the latter could be more encouraged than they are now, notably in physical activity guidelines.
Acknowledgements
The authors wish to thank the participants for their collaboration in this study and Gail Wagman for proofreading this paper.
Conflict of interest
None
References
- Gill JM, Cooper AR (2008) Physical activity and prevention of type 2 diabetes mellitus. Sports Med 38: 807-824. [Crossref]
- Hallal PC, Andersen LB, Bull FC, Guthold R, Haskell W, et al. (2012) Global physical activity levels: surveillance progress, pitfalls, and prospects. Lancet 380: 247-257. [Crossref]
- World Health Organization, 2017. Physical activity Fact sheet updated February 2017.
- Raiber L, Christensen RAG, Jamnik VK, Kuk JL, et al. (2017) Accelerometer thresholds: accounting for body mass reduces discrepancies between measures of physical activity for individuals with overweight and obesity. Appl Physiol Nutr Metab 42:53-58. [Crossref]
- Solbraa AK, Ekelund U, Holme IM, Graff-Iversen S, Steene-Johannessen J, et al. (2015) Long-Term Correlates of Objectively Measured Physical Activity and Sedentary Time in Norwegian Men and Women. J Phys Activ Health. 12: 1500-1507. [Crossref]
- The Sedentary Behaviour and Obesity Expert Working Group. Sedentary behaviour and obesity: review of the current scientific evidence. Department of Health 2010.
- Biddle SJH, Garcia EB, Pedisic Z, Bennie J, Vergeer I, et al. (2017) Screen time, other sedentary behaviours, and obesity risk in adults: a review of reviews. Curr Obes Rep. 6:134-147. [Crossref]
- Bullock VE, Griffiths P, Sherar LB, Clemes SA, et al. (2017) Sitting time and obesity in a sample of adults from Europe and the USA. Ann Hum Biol 44: 230-236. [Crossref]
- Nemeth LS, Rice LJ, Potts M, Melvin C, Jefferson M, et al. (2017) Priorities and Preferences for Weight Management and Cardiovascular Risk Reduction in Primary Care. Fam Community Health 40: 245-252. [Crossref]
- Montesi L, El Ghoch M, Brodosi L, Calugi S, Marchesini G, et al. (2016) Long-term weight loss maintenance for obesity: a multidisciplinary approach. Diabetes Metab Syndr Obes 9: 37-46. [Crossref]
- Vlahu-Gjorgievska E, Koceski S, Kulev I, Trajkovik V (2016) Connected-Health Algorithm: Development and Evaluation. J Med Syst 40: 109. [Crossref]
- Smedley BD, Stith AY, Nelson AR (Eds.). Unequal treatment: Confronting racial and ethnic disparities in health care. Washington, DC: The National Academies Press. 2002.
- Norton K, Norton L, Sadgrove D (2010) Position statement on physical activity and exercise intensity terminology. J Sci Med Sport 13: 496-502. [Crossref]
- Ainsworth BE, Haskell WL, Herrmann SD, Meckes N, Bassett DR Jr, et al. (2011) 2011 Compendium of Physical Activities: a second update of codes and MET values. Med Sci Sports Exerc 43: 1575-1581. [Crossref]
- Guidoux R, Duclos M, Fleury G, Lacomme P, Lamaudière G, et al. (2017) The eMouveRecherche application competes with research devices to evaluate energy expenditure, physical activity and still time in free-living conditions. J Biomed Inform 69 :128-134 [Crossref]
- Rousset S, Guidoux R, Paris L, et al. (2017) A novel smartphone accelerometer application for low-intensity activity and energy expenditure estimations in overweight and obese adults. J Med Syst. 41:117. [Crossref]
- Cassidy S, Chau JY, Catt M, et al. (2017) Low physical activity, high television viewing and poor sleep duration cluster in overweight and obese adults; a cross-sectional study of 398,984 participants from the UK Biobank. Int J Behav Nut Phys Act. 14 :57 [Crossref]
- Matthews CE, Kozey-Keadle S, Sampson J, Lyden K, Bowles HR et al. (2013) Validation of a previous-day recall measure of active and sedentary behaviors. Med Sci Sports Exerc. 45:1629-1638. [Crossref]
- Loprinzi PD (2017) Light-intensity physical activity and all-cause of mortality. Am J Health Promot. 31:340-342. [Crossref]
- Loyen A, Clarke-Cornwell AM, Anderssen SA, Hagströmer M, Sardinha LB et al. (2017) Sedentary time and physical activity surveillance through accelerometer pooling in four European countries. Sports Med. 47:1421-1435. [Crossref]
- Leiva AM, Martínez MA, Cristi-Montero C, Salas C, Ramírez-Campillo R, et al. (2017) [Sedentary lifestyle is associated with metabolic and cardiovascular risk factors independent of physical activity]. Rev Med Chil 145: 458-467. [Crossref]
- Healy GN, Winkler EAH, Brakenridge CL, Reeves MM, Eakin EG (2015) Accelerometer-derived sedentary and physical activity time in overweight/obese adults with Type 2 diabetes: cross-sectional associations with cardiometabolic biomarkers. Plos One. 10:e0119140. [Crossref]
- Gupta N, Heiden M, Aadahl M, Korshøj M, Jørgensen MB et al. (2016) What Is the effect on obesity indicators from replacing prolonged sedentary time with brief sedentary bouts, standing and different types of physical activity during working days? A cross-sectional accelerometer-based study among blue-collar workers. Plos One. 11:e0154935. [Crossref]
- Buman MP, Winkler AH, Kurka JM, Hekler EB, Baldwin CM et al. (2014) Reallocating time to sleep, sedentary behaviors, or active behaviors: associations with cardiovascular disease risk biomarkers, Nhanes 2005-2006. Am J Epidem. 179:323-334. [Crossref]
- Dempsey PC, Sacre JW, Larsen RN, Straznicky NE, Sethi P, et al. (2016) Interrupting prolonged sitting with brief bouts of light walking or simple resistance activities reduces resting blood pressure and plasma noradrenaline in type 2 diabetes. J Hypertens 34: 2376-2382. [Crossref]
- Miyashita M, Burns SF, Stensel DJ (2008) Accumulating short bouts of brisk walking reduces postprandial plasma triacylglycerol concentrations and resting blood pressure in healthy young men. Am J Clin Nutr. 88:1225-1231. [Crossref]


