It is common for trainees and craftsmen in the informal economy to not use protective equipment. With tinsmiths, exposure to toxic emissions such as fumes of molten metal that may contain metallic particles is likely to lead to uptake of toxic metals.
Aims: The principal aim of this study was to evaluate the biological concentrations of toxic metals and essential trace elements in tinsmiths, craftsmen, and trainees working in the informal sector of Cotonou in Benin.
Materials and Methods: Twenty metallic trace elements were measured in whole blood from 111 adult male tinsmith craftsmen, while only the blood lead level was measured in twenty-four trainees of less than 18 years of age. The blood samples were collected at the ERASME health center of Cotonou, using 6 ml EDTA-K2 trace element tubes. The analyses were performed by ICP-MS (Inductively Coupled Plasma-Mass Spectrometry) with a NexION 350 D (PerkinElmer) spectrometer. The results obtained were then compared to those obtained with a reference population that was not subject to professional exposure.
Results: For three trace elements, more than 25% of the adult tinsmiths exhibited blood concentrations above the biological reference values. By increasing order of uptake, these were antimony (28.8%), tin (31.5%), and lead (71.2%). For trainees under 18year of age, the prevalence of workers with a blood lead level ≥ 100 µg/L was 83%.
Conclusions: Exposure to lead was the greatest concern, and protection and awareness measures should be implemented so as to decrease the health risks linked to lead exposure, particularly among young workers.
Benin, biological monitoring, occupational health, trace elements, tinsmiths, informal economy, blood lead level
Used items are the raw material for the recovery and recycling trade. These items comprise non-biodegradable waste, metal tailings, empty food cans, and all sorts of scrap materials. By reducing the volume of solid waste in the environment, the recycling of metallic waste product trade has an important ecological role [1]. In some cases, the collection of metals is part of the electronic wasterecycling process. However, recycling of metallic waste is an entirely separate activity. It presents a wide range of risks and the most common current forms of poisoning are linked to lead, to cadmium, and to nickel exposure [2].
In Benin, most cottage industries are concentrated in the Littoral department, and the Cotonou administrative area alone is host to approximately 30% of the cottage industries. Among the informal economy workers involved in the recycling of metallic waste are recovery craftsmen (e.g., smelters, tinsmiths, and blacksmiths) and their trainees, who use ferrous or non-ferrous metals as raw materials in their workshops. The poor work conditions and the lack of protective equipment are all the more alarming when the craftsmen are exposed to toxic emissions from a very young age [3,4]. Young individuals are the most vulnerable to toxic metal exposure [5]. However, no investigation has allowed for exposures in Benin to be characterized through determination of the biological level of toxic metals uptake. The existence of reference values for specific toxic elements and biomonitoring of exposures constitute progress in regard to prevention insituations involving professional or environmental exposures [6,7]. Studies of biological concentrations of metallic trace elements in exposed sub-Saharan populations, either due to the environment or because their professional activities, have only taken place recently and they have generally relied on atomic absorption spectroscopy [8,9]. A very limited number of studies have employed Inductively Coupled Plasma-Mass Spectrometry (ICP-MS), a technique known for its sensitivity and its multi-element capacity [10-12]. In Benin, reference values in the general population for metallic trace elements have been recently determined by ICP-MS [13]. It seems essential to compare the values found in potentially exposed professional groups to the 95th percentile reference values (VR95) found in the population in Cotonou that is not subject to professional exposure. The aim of this study was to evaluate the level of uptake for 20 metallic trace elements (essential and toxic metals) in the blood of adult tinsmiths, as well as just blood lead levels in tinsmith apprentices of less than 18 years of age.
This study took place from December 2015 to January 2016 at Midombô, in the 3rd arrondissement of Cotonou. This study received prior approval from the Ethics Committee of the Applied Biomedical Sciences Institute of Benin (approval notification n°74 from 15/09/2015).
Study population
The study population was comprised of 135 tinsmiths who volunteered from the 251 craftsmen working in the Midombô area. All of the tinsmiths were male, and they freely agreed to participate in the study. For individuals under 18 years of age, informed consent was provided by their legal guardian. The population was divided into two categories, namely 111 individuals over 18 years of age and 24 who were under the age of 18.
Sample collections
Precautions were taken to avoid contamination upon sample collection and handling of the samples until they were analyzed. The samples were collected away from the work site at a medical center (the ERASME health center) after rigorous cleaning of the inner elbow collection site with alcohol (70°). EDTA-K2 (di-potassium ethylenediaminetetraacetic acid) trace element tubes of 6 ml (Vacutainer® Becton Dickinson, Le Pont du Clay, France) and siliconized needles (BD Vacutainer®) suitable for use with a venous blood vacuum collection system were used. The collected samples were chilled to -20°C and sent by air on dry ice to the University Hospital Center of Limoges (France). The analyses were performed in an ISO 6 class clean room at the Department of Pharmacology and Toxicology of the Limoges University Hospital.
Elemental analysis
After thawing and homogenization of the blood samples (by successive inversions and by vortexing), the analyses were carried out using ICP-MS with a NexION 350 D (Perkin-Elmer, Courtaboeuf, France) spectrometer according to the instrumental method described previously in the study performed forthe general population, based on blood donors of Cotonou [13]. The total blood was analyzed in regard to 10 toxic chemicals and 10 essential chemicals. The toxic elements considered in this studywere lead (208Pb), arsenic (75As), antimony (121Sb), strontium (88Sr), mercury (202Hg), cadmium (111Cd), beryllium (9Be), barium (138Ba), tin (118Sn), and bismuth (209Bi). The trace elements that were probed for were magnesium (25Mg), chrome (52Cr), selenium (82Se), manganese (55Mn), zinc (64Zn), molybdenum (98Mo), cobalt (59Co), copper (63Cu), iron (56Fe), and vanadium (51V).
Quality assurance
The analysis laboratory of the Departmentof Pharmacology and Toxicology of the Limoges University Hospital is COFRAC ISO 15189 accredited, thus guaranteeing that the technical skills and an appropriate quality management system are in place. To ensure the reproducibility and the accuracy of the measurements throughout the analyses, a Seronorm™ L-2 internal quality control was inserted in each series for every five samples. Furthermore, with the exception of iron and magnesium, for each of the 20 elements of this study the laboratory participated in multi-elemental QMEQAS (Comparison Program of the National Public Health Institute of Quebec) external quality control. For each result submitted to the QMEQAS program, a z-score was calculated to evaluate the analytical accuracy based on unrounded results.
Statistical analysis
The dependent variables were the concentrations in µg/L of the 20 trace elements and toxic metals. For all of the elements, the arithmetic mean, the standard deviation, the median, and the range (minimum and maximum) were determined. For each element, the percentage of adult tinsmiths exhibiting concentrations of trace elements above the references values (VR95) of the population of Cotonou was determined.
The independent variables were the data derived from the socio-professional and medical questionnaire filled out by the tinsmiths. These were their age, their scholastic level, the length of time that they had been working at the workshop, the performance of tasks that directly exposed them to fumes, their arterial pressure, and their body mass index (BMI). The blood lead level results were analyzed as a function of these various independent variables. Only four tinsmiths stated that they smoked on an irregular basis. No specific statistical analysis was carried out for this group (less than 3% of the study population).
The data were analyzed with SPSS.20 software (SPSS Statistics for Windows, Version 20.0. Armonk, NY, IBM Corp). Comparisons of the quantitative variables were performed by Mann-Whitney U-tests. The threshold for significance chosen for the set of statistical analyses was 5%.
The socio-professional and medical characteristics of the tinsmiths are summarized in Table 1.
Table 1. Socio-professional and medical characteristics of the tinsmiths.
Variable |
N |
Percentage |
Age groups (years) |
9-18 |
24 |
17.8 |
18-65 |
111 |
82.2 |
Seniority at the workshop (years) |
5 ≤ |
27 |
20.0 |
[5-10] |
33 |
24.4 |
[10-15] |
31 |
23.0 |
[15-20] |
25 |
18.5 |
> 20 |
19 |
14.1 |
Scholastic level |
No schooling |
51 |
37.8 |
Primary |
74 |
54.8 |
Secondary |
10 |
7.4 |
Tasks directly exposing to fumes |
YES |
52 |
38.5 |
NO |
80 |
59.3 |
Lacking |
3 |
2.2 |
Arterial pressure AP (mm of Hg) |
Normal pressure |
98 |
72.6 |
Hypertension |
37 |
27.4 |
Body Mass Index (BMI)* |
Normal |
95 |
70.4 |
Overweight |
11 |
8.1 |
Obese |
29 |
21.5 |
*according to the OMS and the International Obesity Task Force (1998) |
Quality assurance for the elemental analysis
The results of the QMEQAS external quality controls are presented in Table 2 for the 20 analyzed elements. Z-scores ranging of -2 to +2 were considered to be satisfactory for all of the elements, except for manganese which was slightly elevated. The results of the internal Seronorm™ quality controls showed that our method is sensitive, robust, and reproducible; with satisfactory coefficients of variation (CV ≤ 10%) for all of the elements, including manganese (Table 3).
Table 2. Results of the external QMEQAS quality control program.
Element |
Units |
Target value sample 1 |
Measured value sample 1 |
Z-Score sample 1 |
Acceptable spread sample 1 |
9Be |
µmol/L |
1.83 |
1.87 |
0.15 |
[1.33-2.33] |
25Mg |
|
|
na |
na |
|
51V |
nmol/L |
45.3 |
39.7 |
-0.75 |
[30.2- 60.4] |
52Cr |
nmol/L |
103 |
94.2 |
-0.51 |
[68.7- 137] |
56Fe |
|
|
na |
na |
|
55Mn |
nmol/L |
387 |
501 |
2.49 |
[295-479] |
59Co |
nmol/L |
79.4 |
84.2 |
0.59 |
[63.4- 95.4] |
63Cu |
µmol/L |
18.8 |
17.9 |
-0.7 |
[16.2-21.4] |
64Zn |
µmol/L |
17.7 |
15.5 |
-1.23 |
[14.1-21.3] |
75As |
nmol/L |
189 |
217 |
0.91 |
[126-252] |
82Se |
µmol/L |
1.95 |
1.89 |
-0.26 |
[1.46-2.44] |
88Sr |
nmol/L |
1740 |
1560 |
-1.02 |
[1380-2100] |
98Mo |
nmol/L |
24.2 |
27.3 |
0.68 |
[15.1-33.3] |
111Cd |
nmol/L |
76.9 |
68.7 |
-1.26 |
[63.8-90.0] |
118Sn |
nmol/L |
12.8 |
10.5 |
-0.74 |
[6.63-19.0] |
121Sb |
nmol/L |
57.1 |
58.8 |
0.3 |
[45.9-68.3] |
138Ba |
nmol/L |
13.8 |
13.5 |
-0.12 |
[8.46-19.1] |
202Hg |
nmol/L |
10.2 |
8.33 |
-1.09 |
[6.78-13.6] |
208Pb |
µmol/L |
0.567 |
0.535 |
-0.8 |
[0.488-0.646] |
209Bi |
nmol/L |
8.64 |
7.56 |
-1.21 |
[6.86-10.4] |
Table 3. Internal Seronorm™ L-2 quality control.
Elements |
Target averages (µg/L) |
Measured averages (µg/L) |
Standard deviation |
CV* |
9Be |
5.68 |
5.34 |
0.29 |
5% |
25Mg |
15400 |
13306 |
970 |
7% |
51V |
6.00 |
5.36 |
0.36 |
7% |
52Cr |
11.80 |
10.98 |
0.83 |
8% |
56Fe |
331000 |
307777 |
30841 |
10% |
55Mn |
29.9 |
30.4 |
2.2 |
7% |
59Co |
5.80 |
5.48 |
0.30 |
5% |
63Cu |
1330 |
1229 |
72 |
6% |
64Zn |
6500 |
5735 |
290 |
5% |
75As |
14.3 |
16.3 |
1.2 |
7% |
82Se |
112.0 |
112.5 |
4.4 |
4% |
88Sr |
14.9 |
11.3 |
0.7 |
6% |
98Mo |
6.4 |
6.5 |
0.6 |
9% |
111Cd |
5.80 |
5.08 |
0.20 |
4% |
118Sn |
5.70 |
5.37 |
0.18 |
3% |
121Sb |
30.50 |
29.12 |
1.56 |
5% |
138Ba |
346.00 |
283.30 |
11.77 |
4% |
202Hg |
16.00 |
15.46 |
0.46 |
3% |
208Pb |
310.0 |
295.4 |
8.9 |
3% |
209Bi |
5.18 |
4.99 |
0.15 |
3% |
*CV: Coefficient of variation |
Blood concentrations of metallic trace elements
The results for the blood concentration for the metallic trace elements are presented in Table 4, and they are in regard to tinsmiths over 18 years of age only (N=111). For the 111 blood samples, the following six trace elements were not detectable: 9Be (41.4%), 51V (62.2%), 52Cr (65.8%), 118Sn (6.3%), 138Ba (22.52%), and 209Bi (74.77%).
Table 4. Results for the analyses of trace elements (µg/L) in the blood of tinsmiths (≥ 18 years).
Elements |
LOQ |
% <LOQ |
Average |
SD |
Median |
Minimum |
Maximum |
9Be |
0.01 |
41.44 |
0.09 |
0.08 |
0.06 |
< 0.01 |
0.41 |
25Mg |
1 |
0 |
28384 |
3239 |
28277 |
20635 |
38178 |
51V |
0.1 |
62.16 |
<0.1 |
0.07 |
0.05 |
<0.1 |
0.73 |
52Cr |
0.24 |
65.76 |
<0.24 |
0.22 |
0.12 |
<0.24 |
1.61 |
56Fe |
24.5 |
0 |
448466 |
89131 |
452667 |
144221 |
679804 |
55Mn |
0.1 |
0 |
13 |
3.8 |
12.9 |
5.1 |
33 |
59Co |
0.01 |
0 |
0.56 |
0.21 |
0.5 |
0.31 |
1.29 |
63Cu |
0.24 |
0 |
908 |
130 |
898 |
523 |
1353 |
64Zn |
2.15 |
0 |
4583 |
957 |
4587 |
2202 |
7416 |
75As |
0.02 |
0 |
7.4 |
2.7 |
6.7 |
3.2 |
19.3 |
82Se |
0.1 |
0 |
174.4 |
36 |
171 |
110.2 |
318.6 |
88Sr |
0.01 |
0 |
36.1 |
13.1 |
32.9 |
17.6 |
92.7 |
98Mo |
0.01 |
0 |
4.02 |
6.33 |
1.9 |
0.4 |
40.7 |
111Cd |
0.02 |
0 |
0.26 |
0.16 |
0.23 |
0.01 |
0.89 |
118Sn |
0.1 |
6.31 |
0.43 |
0.32 |
0.4 |
<0.1 |
3.14 |
121Sb |
0.1 |
0 |
9.49 |
8.11 |
8.08 |
5.17 |
66.5 |
138Ba |
0.24 |
22.52 |
0.6 |
0.58 |
0.42 |
<0.24 |
4.43 |
202Hg |
0.02 |
0 |
3.37 |
3.41 |
2.81 |
0.66 |
34.43 |
208Pb |
0.1 |
0 |
103.1 |
46.2 |
93.2 |
30.4 |
304.1 |
209Bi |
0.01 |
74.77 |
0.011 |
0.02 |
<0.01 |
<0.01 |
0.20 |
LOQ: Limit of Quantification; SD: Standard Deviation |
Blood lead levels and independent variables
The results for the blood lead levels for the full set of 135 participants as a function of the independent variables derived from the socio-professional and medical questionnaire were the following:
Blood lead levels as a function of age and the length of time spent working at the workshop: For those under 18 years of age (N=24), the average blood lead level was 152.0 ± 52.1 µg/L, ranging from 63.6 to 252.8 µg/L. For the tinsmiths over 18 years of age, the average blood lead level was lower than for those less than 18 years of age (see Figure 1). The blood lead level was over 100 µg/L for 83.3% of the young workers. An increase in lead in the blood with longer times spent working in the workshops was only seen with those under 18 years of age (r=0.47; p=0.019).
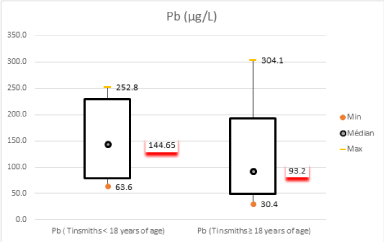
Figure 1. Comparison of blood lead levels (µg/L) in tinsmiths of more than 18 years of age and those of less than 18 years of age.
Blood lead levels as a function of scholastic level: The average blood lead level was lower (in a non-significant manner) in craftsmen who had undergone secondary level education (82.8 ± 30.1 µg/L) relative to craftsmen who had not attended school (105.9 ± 43.9 µg/L) (p=0.11) or who had only reached primary school grade (119.8 ± 55.5 µg/L) (p=0.14).
Blood lead levels as a function of exposure to fumes: The average blood lead level was significantly higher (p<0.0001) in individuals exposed directly to fumes (142.6 ± 62.5 µg/L) vs. (93.5 ± 29.6 µg/L) in individuals who stated not to have been directly exposed.
Blood lead levels as a function of arterial pressure: The average blood lead level was slightly higher in individuals with normal arterial pressure (115.6 ± 53.5 µg/L), although this was not significantly different from individuals with hypertension (101.9 ± 41.3 µg/L) (p=0.10).
Blood lead levels as a function of body weight: The average blood lead level was significantly lower in craftsmen who were overweight than in those who had normal Body Mass Index (92.3 ± 37.9 µg/L vs. 120.0 ± 53.3 µg/L, respectively) (p=0.01).
The strengths of the study
This study allowed blood concentrations to be determined for 20 metallic trace elements in adult tinsmiths, while making use of reference values for the general population of Cotonou. The comparability of the results between the reference population of Cotonou and the population of craftsmen was improved by the fact that the instrumental operational conditions of the two studies were identical. Furthermore, the analyses complied with the COFRAC accreditation quality requirements.
Difficulties linked to the study
Interpretation of the results is a major difficulty with analysis of twenty-odd elements in exposed populations [14]. The limiting reference values, above which one or more undesirable effects can occur, are sometimes largely unknown. Throughout this study, we compared our results with the reference values determined at Cotonou [13] as well as those from recent studies carried out in Ghana among recyclers of electronic waste [12,15]. Our discussion then became mainly focused on blood concentrations of lead, mercury, manganese, and cadmium for which the international regulatory bodies have established limiting biological values.
Comparison of the results of tinsmiths with the Benin reference population
According to Table 5, for three trace elements, at least 25% of the tinsmiths exhibited blood concentrations above the VR95for the reference population. For these three elements (Pb, Sb, and Sn), an illustration of the distribution of the values and their comparison with the general population of Cotonou is presented Figure 2.
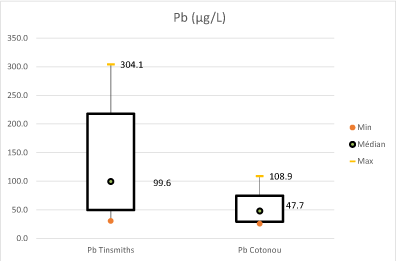
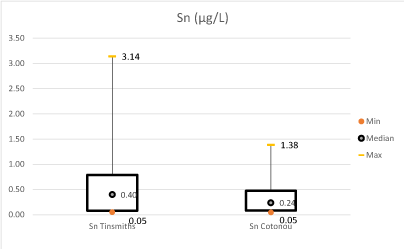
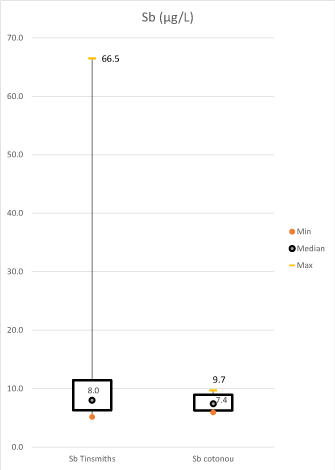
Figure 2. Comparisons of the blood concentrations (µg/L) for the elements (A) Pb (p<0.0001), Statistically significant difference, (B) Sn (p<0.0001), Statistically significant difference, and (C) Sb (p<0.0019), Statistically significant difference in adult tinsmiths and in the reference population of Cotonou.
Table 5. Comparison of the blood concentrations (Pb, Hg,and Cd) of the tinsmiths (≥ 18 years) with the values found for recyclers of electronic waste in Ghana [12].
| |
|
|
|
Percentiles (μgL-1) |
|
|
Average (μgL-1) |
SD |
10% |
25% |
50% |
75% |
90% |
Pb |
Our study of tinsmiths in Benin |
103.1 |
46.2 |
55.0 |
70.9 |
93.2 |
121.6 |
168.5 |
For recyclers in Ghana [12] |
79.3 |
58.0 |
26.3 |
40.1 |
63.5 |
99.8 |
142.2 |
Hg |
Our study of tinsmiths in Benin |
3.4 |
3.4 |
1.3 |
1.9 |
2.8 |
3.8 |
5.6 |
For recyclers in Ghana [12] |
1.8 |
1.4 |
0.5 |
0.7 |
0.9 |
1.3 |
2.4 |
Cd |
Our study of tinsmiths in Benin |
0.3 |
0.2 |
0.1 |
0.1 |
0.2 |
0.3 |
0.4 |
For recyclers in Ghana [12] |
1.7 |
3.0 |
0.2 |
0.5 |
1.2 |
1.6 |
3.1 |
Comparison of the results for tinsmiths with recyclers of electronic waste in Ghana [12]
Unlike blood cadmium, the concentrations of lead and mercury in our study were above the concentrations found in recyclers of electronic waste in Ghana (Table 6). This finding could be due to the fact that the base levels for these elements in the general population at Cotonou were already relatively high due to environmental factors (Table 5). At the electronic waste recycling site of Agbogbloshie in Ghana, cadmium was one of the main soil pollutants, thus resulting in a higher level of uptake being seen with these metal recyclers [15]. Furthermore, the fact that the tinsmiths were exposed very little to cigarette smoke (less than 3%), could explain why the blood concentrations of cadmium (average=0.26 µg/L) are relatively similar to those of the non-exposed reference population [13].
Table 6: Proportions of tinsmiths (≥ 18 years) for who the concentrations were above the VR95 for the reference population of Cotonou.
|
Tinsmiths (>18 years, n=111) |
Element |
VR95 (in µg/L)
of Cotonou [13] |
95thP*
Tinsmiths
(≥ 18 years) |
Proportions (%) above the VR95 of Cotonou |
9Be |
0.196 |
0.22 |
8.1 |
25Mg |
34059 |
33389 |
2.7 |
51V |
0.16 |
0.15 |
4.5 |
52Cr |
0.99 |
0.58 |
1.8 |
56Fe |
553716 |
573298 |
9.0 |
55Mn |
25.14 |
18.56 |
0.9 |
59Co |
1.30 |
1.01 |
0 |
63Cu |
1027 |
1118 |
17.1 |
64Zn |
6668 |
6121 |
1.8 |
75As |
10.55 |
13.2 |
9.0 |
82Se |
205 |
243 |
13.5 |
88Sr |
48.42 |
59.7 |
16.2 |
98Mo |
3.16 |
17.6 |
22.5 |
111Cd |
0.63 |
0.67 |
5.4 |
118Sn |
0.48 |
0.82 |
31.5 |
121Sb |
8.94 |
14.48 |
28.8 |
138Ba |
0.99 |
1.72 |
18.0 |
202Hg |
7.64 |
6.51 |
1.8 |
208Pb |
74.78 |
199.7 |
71.1 |
209Bi |
0.015 |
0.031 |
21.6 |
P*: percentiles; VR95: Reference values representing the 95th percentile of the reference population |
Comparison of the results for the tinsmiths with the biological reference values adhered to by occupational hygienists for mercury, lead, manganese, and cadmium
Blood mercury: Of the 111 tinsmiths 18 years of age and over, 87.4% had blood mercury concentrations lower than 5 µg/L. This value represents the HBM-I (Human Biomonitoring I) or biological concentration set by German hygienists, below which, a priori, no undesirable effects should be detected [7]. The HBM-II represents the biological concentration above which undesirable effects on health occur. This HBM-II value is 15 µg/L for blood mercury, and it is also the limit set for a work shift and for a work week by the ACGIH (the American Conference of Governmental Industrial Hygienists) [7,16]. For 11.7%of the adult tinsmiths, the blood concentrations were comprised between 5 and 15 µg/L, which are values for which undesirable effects are a possibility. Among the tinsmiths, one craftsman exhibited a blood mercury level of 34 µg/L, which is the say double the HBM II value. This individual was twenty-six years of age and had spent15 years working in the workshop, working 10 hours/day, six days per week, and they stated that they were regularly exposed to fumes in the course of their work.
Blood lead levels: Lead is used in the production of various items, along with antimony or tin, in the form of alloys so as to lower the melting point, to increase its mechanical properties, or to improve its electrochemical characteristics. Thus, when lead or it alloys are smelted, there are substantial emissions of fine lead oxide powder that can underlie uptake in the work place [17]. Lead and its inorganic forms have been classified as group 2A (probably carcinogenic to humans) by the International Agency for Research on Cancer (IARC) and as category 2 (human carcinogen) by the Deutsche Forschungsgemeinschaft - MAK Commission (DFG). In light of this, the DFG has suspended the HBM values for blood lead levels in children and adults [18]. According to the ACGIH, the biological value for blood lead that indicates exposure, and below which nearly all workers should not experience adverse health effects, is 300 µg/L. With adult tinsmiths, one craftsman had a blood level of 304.1 µg/L that is to say above the threshold concentration or BEI (Biological Exposure Index) of American hygienists. This was the case for a 23-year-old worker who had been employed in this work setting for 10 years, working 10 hours per day, and who stated that they were regularly exposed to fumes or particulate matter at work. For minors (N=24) who participated in our study, 83.3% exhibited blood lead levels above 100 µg/L; concentrations that are known to lead to changes in neurological development in children [19]. The consumption of food directly in workshops could increase the risk of lead poisoning, particularly in young trainees, as the level of gastrointestinal absorption of lead is 4 to 5 times higher in children than in adults. These results show that tinsmiths are subject to occupational exposure and that individuals under the age of 18 are exposed the most.
Blood manganese: According to the limits of the DFG, the BAR (BiologischeArbeitsstoff-Referenzwerte) reference level is set at 15 µg/L. The BAR value allows usual biological levels of xenobiotics at any given time to be described, in a general population, for working age individuals who are not exposed as a result of their profession. The average blood manganese concentration in our study (13.0 ± 3.8 µg/L) indicates that exposure of tinsmiths to manganese appears to be negligible.
Blood cadmium: The average concentration of cadmium in the blood of the tinsmiths (0.26 ± 0.16 µg/L) was much lower than 5 µg/L, which is the biological exposure index proposed by the American hygienists of the ACGIH [16].
The results obtained in this study show that blood lead levels among tinsmiths were particularly high relative to those for the general population, particularly among young individuals less than 18 years of age. Evaluation of the work conditions and a description of the most at-risk jobs should allow craftsmen to be made aware of the risk, and for excessive exposure to be avoided by having children not perform certain at-risk tasks.
There are no conflicts of interest to be declared.
This investigation was funded within the financial support of the Limousin Region, the Limoges University, and the Faculty of Health Sciences of Cotonou. We would like to thank the workshops foremen, who were instrumental in ensuring that a maximal number of tinsmiths were recruited for this study.
- Martchek, K.J., 2000. The importance of recycling to the environmental profile of metal products. In: eds D. L. Stewart, J. C. Daley and R. L. Stephens. 2000. Recycling of Metals and Engineered Materials. Hoboken: John Wiley & Sons Inc. pp. 19-27.
- Occupational Safety and Health Administration (2008) Guidance for the Identification and Control of Safety and Health Hazards in Metal Scrap Recycling.U.S. Department of Labor.
- Tossou F (2001) Assessment of the working conditions and health of children in the informal sector in Benin: case of apprentice tinsmiths in Cotonou. Arch Occup Dis Environ 62: 385-387.
- Ayelo P, Baloïtcha P, Fayomi B (2010) Situation socio sanitaire des apprentis en milieu artisanal à Cotonou Socio health situation of artisan apprentices in Cotonou. J Int Santé Trav 2: 31-39.
- Nordberg, G., Fowler, B., Nordberg, M., Friberg, L., 2007. Handbook on the toxicology of metals, 3rd ed. Burlington: Elsevier.
- Schulz C, Angerer J, Ewers U, Heudorf U, Wilhelm M (2009) Revised and new reference values for environmental pollutants in urine or blood of children in Germany derived from the German Environmental Survey on Children 2003-2006 (GerES IV). Int J Hyg Environ Health 212: 637-647. [Crossref]
- Angerer J, Aylward LL, Hays SM, Heinzow B, Wilhelm M (2011) Human biomonitoring assessment values: Approaches and data requirements. Int J Hyg Environ Health 214: 348-360. [Crossref]
- Röllin H, Mathee A, Levin J, Theodorou P, Wewers F (2005) Blood manganese concentrations among first-grade schoolchildren in two South African cities. Environ. Res 97: 93-99. [Crossref]
- Ademoroti CMA, Oviawe AP (2006) Blood Lead Levels of People Living in Traffic Areas in Benin City, Nigeria. J Appl Sci 6: 2014-2019.
- Tuakuila J, Kabamba M, Mata H, Mata G (2014) Toxic and essential elements in children’s blood (<6 years) from Kinshasa, DRC (the Democratic Republic of Congo). J Trace Elem Med Biol 28: 45-49. [Crossref]
- Bodeau-Livinec F, Glorennec P, Cot M, Dumas P, Durand S, et al. (2016) Elevated Blood Lead Levels in Infants and Mothers in Benin and Potential Sources of Exposure. Int J Environ Res Public Health 13: 316. [Crossref]
- Srigboh RK, Basu N, Stephens J, Asampong E, Perkins M, et al. (2016) Multiple elemental exposures amongst workers at the Agbogbloshie electronic waste (e-waste) site in Ghana. Chemosphere 164: 68-74. [Crossref]
- Yedomon B, Menudier A, Etangs FLD, Anani L, Fayomi B, et al. (2017) Biomonitoring of 29 trace elements in whole blood from inhabitants of Cotonou (Benin) by ICP-MS. J Trace Elem Med Biol 43: 38-45. [Crossref]
- Guidotti TL (1988) Exposure to hazard and individual risk: when occupational medicine gets personal. J Occup Med 30: 570-577. [Crossref]
- Kyere VN, Greve K, Atiemo SM (2016) Spatial assessment of soil contamination by heavy metals from informal electronic waste recycling in Agbogbloshie, Ghana. Environ Health Toxicol 31: 1-10. [Crossref]
- American Conference of Governmental Industrial Hygienists (2012) 2012 TLVs and BEIs: based on the documentation of the threshold limit values for chemical substances and physical agents & biological exposure indices. ACGIH Signature Publications, Cincinnati, Ohio.
- Lauwerys, R.R. (2007) Toxicologie industrielle et intoxications professionnelle. Elsevier Masson, Paris.
- Wilhelm M, Heinzow B, Angerer J, Schulz C (2010) Reassessment of critical lead effects by the German Human Biomonitoring Commission results in suspension of the human biomonitoring values (HBM I and HBM II) for lead in blood of children and adults. Int J Hyg Environ Health 213: 265-269. [Crossref]
- Centers for Disease Control and Prevention (2012) Recommendations in “Low Level Lead Exposure Harms Children: A Renewed Call of Primary Prevention”.
Editorial Information
Editor-in-Chief
Jin-Wen Xu
Shanghai University, China
Article type
Research Article
Publication History
Received: November 05, 2020
Accepted: December 01, 2020
Published: December 07, 2020
Copyright
©2020 Yedomon B. This is an open-access article distributed under the terms of the Creative Commons Attribution License, which permits unrestricted use, distribution, and reproduction in any medium, provided the original author and source are credited.
Citation
Yedomon B, Menudier A, Dugleux K, Fayomi B, Druet-Cabanac M, et al. (2020) Evaluation of 20 toxic metals and essential elements in the blood of metal recycling tinsmiths of Cotonou (Benin). Biomed Res Rev 4: DOI: 10.15761/BRR.1000139