Rice is a staple food of most Asian diets and a major contributor to high carbohydrate load. The objective of our study was to evaluate factors that affect digestibility of rice and corroborate in vitro estimated Glycaemic Index (GI) with clinically evaluated GI. We hypothesised that in vitro digestibility and thus estimation of GI may be impacted by multiple parameters including amylose content, particle size and method of cooking. In this study, a commonly consumed South Indian white rice variety, was evaluated for various factors that affect in vitro digestibility. Our results suggest amylose content and particle size of rice to be inversely related to digestibility and estimated Glycaemic Index (GI). Of the five different commonly followed consumer cooking methods tested, electric cooking method increased in vitro digestibility. GI was evaluated in fifty healthy volunteers with the selected variety cooked by an optimized method, showed a high GI of 70 ± 3 (SEM). This study thus extends the current knowledge on factors affecting in vitro digestibility of selected variety of rice and suggests an important role of consumer processing methods.
rice, Glycaemic Index, amylose, cooking, clinical, in vitro digestibility
Glycaemic Index (GI) is defined as area under the blood glucose response curve for each food, expressed as a percentage of the area after taking the same amount of carbohydrate from glucose [1]. Consumption of high GI food leads to a two-fold increase in blood glucose levels after meal, as observed by incremental area under curve, compared to a low GI food. Regular consumption of high GI foods results in higher post prandial blood glucose levels, thereby affecting metabolic homeostasis and health [2]. Increased quantities of refined carbohydrates such as polished rice, refined wheat flour, semolina in the Indian diet have been suggested to be associated with increase in prevalence of diabetes [3] and shown to be a major risk factor in development of cardiovascular diseases and metabolic syndrome [4,5]. Rice (Oryza sativa) forms a staple diet in most Asian countries, including India and consumption was estimated to be 97 million metric tons for the year 2016-2017 [6]. The rice grain is composed largely of starch and is consequently a major contributor to the daily dietary carbohydrate load. Structurally, starch is made up of amylose and amylopectin. While amylose is the linear polymer of glucose molecules linked by α(1→4) glucosidic bonds, amylopectin is a highly branched polymer with linear α(1→4) glucosidic bonds and α(1→6) bonds at branch points. The highly branched structure of amylopectin has been suggested to affect the hydrolysis rate by digestion enzymes, whereas amylose polymers have been suggested to attribute resistance to digestion [7-9]. In addition to carbohydrate and amylose content, factors such as pre-processing, fibre content, and consumer processing conditions such as soaking, method of cooking and resistant starch fraction, have been reported to affect GI [4,10-12]. While some studies suggest high amylose content to be associated with low GI [13-15], other studies have shown that amylose content alone is not a predictor of GI [16,17]. Björck and Elmståhl [18] summarised the preventive and therapeutic effect of low GI diet with respect to metabolic syndrome, thus elucidating the importance of identifying low GI foods. Although GI is measured in vivo, however, establishment of an in vitro method which can reliably indicate but not replace GI measurements in vivo, can accelerate the screening process. Predictive methods to estimate in vitro digestibility have been previously developed [19-23]. In this study, we evaluated the effect of carbohydrate content and amylose content on in vitro digestibility using Sona masuri, a commonly consumed medium grain South Indian white rice variety. In addition, the effect of particle size and cooking method on in vitro digestibility was measured. Furthermore, we evaluated the GI of the selected variety by an optimised cooking method, in fifty healthy human volunteers.
Samples and reagents
Rice samples (Sona masuri) was commercially procured from the market. Amylose estimation kit was procured from Megazyme. Pepsin (Sigma P7000), Invertase (I4504), Pancreatin (P7545), Amyloglucosidase (A7095) and glass beads were procured from Sigma. Guar gum from HiMedia was used.
Estimation of in vitro digestibility
In vitro digestibility to estimate free glucose was carried out by previously standardised method [21] with modifications pertaining to reaction termination step. Enzyme mixture was prepared by dissolving 0.5 gm invertase in 6 ml of distilled water. 3 gm pancreatin was dissolved in 20 ml distilled water and centrifuged at 1600 gm for 10 mins. 15 ml supernatant was collected from each tube. For 90 ml of supernatant, 5 ml of Amyloglucosidase and 6 ml invertase solutions previously prepared were added and mixed by inversion. 500 mg available carbohydrate equivalent sample was weighed into 50 ml tubes and 5 ml water was added. 10 ml of pepsin-guar gum mixture (prepared by dissolving 5 gm pepsin and 5 gm guar gum in 1 L 0.05N hydrochloric acid) was added to the test sample. The tubes were incubated in a shaking water bath at 37°C for 30 minutes. 5 ml of 0.5M sodium acetate buffer pH 5.2 and 5 glass beads were then added, mixed and incubated at 37°C for 5 minutes. 5 ml of enzyme mixture prepared above was added, mixed and incubated at 37°C. 200 μl reaction mixture was withdrawn at time intervals of 20, 45, 90 & 180 minutes. The modifications steps were based on three methods of reaction termination. In first method, 4 ml ethanol was added to withdrawn sample. In second method, the withdrawn sample was incubated in boiling water bath for 2 minutes followed by addition of 4 ml ethanol. In the third method, the withdrawn sample was incubated in boiling water bath for 5 minutes followed by addition of 4 ml ethanol. Each of these samples was then centrifuged and supernatant was used for colorimetric estimation of glucose using Glucose oxidase peroxidase reagent. Absorbance was measured at 510 nm and glucose standard curve was used. The following equation as established by Goni et al. [20] was used: C = C∞ (1-e-kt), where C corresponds to the percentage of starch hydrolysed at time t, C∞ is the equilibrium percentage of starch hydrolysed after 180 min, k is the kinetic constant and t is the time (min). Hydrolysis Index (HI) was obtained using area under curve (AUC) of test sample as a percentage of area under curve for reference sample, where AUC is calculated as: AUC = C∞(tf-t0) – (C∞/k)[1-exp(-k(tf-t0))], where C∞ corresponds to the equilibrium percentage of starch hydrolysed after 180 min, tf is the final time (180 min), t0 is the initial time (0 min) and k is the kinetic constant. Expected Glycaemic Index (GI) was estimated using the formula: GI = 39.71 + (0.549 X HI).
Carbohydrate and amylose analysis
Carbohydrate content was obtained by calculation. Amylose content was estimated using amylose estimation kit from Megazyme.
Determination of minimum cooking time
Five grams of rice grains were weighed and cooked in 100 ml of boiling distilled water. Cooking time was checked by taking a few grains from the cooking vessel and pressing between two slides at regular time intervals. The time when >90% of the grains did not show an opaque ungelatinised core, was recorded as the minimum cooking time of the grain [16].
Sample preparation for particle size estimation
Uncooked rice grains were powdered in a mixer grinder and passed through sieves of pore sizes 1000, 850, 500 and 250 microns to obtain samples of different particle sizes.
Cooked sample preparation
Rice sample were cooked by five most commonly practiced methods in south India, viz. pressure cooking, steam cooking, and electric cooking after pre-soaking rice, electric cooking without pre-soaking, and cooking by boiling in an open vessel. The rice: water ratio was maintained as 1:2 for all the five methods of cooking. For pressure cooking, rice and water at the described ratio were placed in a pressure cooker and cooked for 3 whistles. In steam cooking method, the rice and water were placed in a container which was further placed in a pressure cooker and cooked as described above. In case of electric cooker, both pre-soaked and unsoaked methods were tested. In pre-soaked method, rice was pre-soaked in 1:2 quantity of water for twenty minutes then cooked in electric cooker. In the case of unsoaked condition, the grains were directly cooked in electric cooker. Open vessel cooking involved boiling rice grains without pressure in an open container and draining excess water after the grains were cooked.
Glycaemic Index study
Fifty healthy volunteers aged 18-45 years and Body Mass Index (BMI) <25 kg/m2 were selected for testing GI of Sona masuri rice variety. The study was approved by Institutional Ethics Committee and informed consent was taken from all volunteers. Glycaemic Index was measured as previously recommended [24-26]. The test product contained 50 gm of available carbohydrates and steam cooked as described above. 50 gm of glucose in 200 mL water was used as reference product. The volunteers were randomised and received the test as well as reference products in a crossover manner. The volunteers were administered test and reference product after overnight fasting. Blood glucose measurements were taken at -5, 15, 30, 45, 60, 90 and 120 mins. Time of first bite was considered as 0 minute. Test product was served with 200 ml water. Both test and reference products were consumed twice during the study with a two-day washout period. The incremental area under the blood glucose response curves (iAUC) was calculated using the trapezoid rule (ignoring the area beneath the baseline). The GI was calculated as: (iAUC of the test food/iAUC of the reference food) *100.
Evaluation of in vitro digestibility
The method described by Englyst et al. [21] was modified to evaluate efficacy of different methods of reaction termination. The test sample used in this experiment was table sugar (sucrose), known to have a GI of 68 ± 5 [11]. As shown in table 1, the estimated GI as obtained by three methods showed similar values and were not significantly different (p>0.05). However, when reaction was terminated using ethanol alone, the standard deviation was observed to be 1.12 compared to 0.71 and 0.89 when ethanol was in combination with heat treatment for 2 and 5 minutes respectively. The difference in estimated GI as well as the standard deviation was found to be higher than sucrose, when different test sample was used (data not shown). Accordingly, heat inactivation for 5 minutes followed by addition of ethanol was selected for further experiments.
Table 1. Effect of reaction termination methods on estimated GI evaluation
Treatment |
Mean |
SD |
Ethanol |
70.66 |
1.12 |
Ethanol + Heat (2') |
70.63 |
0.71 |
Ethanol + Heat (5') |
71.11 |
0.89 |
Effect of carbohydrate content, amylose content and cooking time
As shown in table 2, the carbohydrate content of tested variety was found to be 76 g/100 g. The amylose content was observed to be in the range of 23% which can be categorised as intermediate category based on classification described by Juliano [27]. When tested for in vitro digestibility, Sona masuri showed a high estimated GI of 83 ± 3. It was observed that cooking time of tested variety was 14 minutes. The results indicate an association between high carbohydrate content and high estimated GI.
Table 2. Carbohydrate and amylose content of rice
Carbohydrate (g/100g) |
Amylose (%) |
Estimated GI |
76 |
23 ± 2 |
83 ± 3 |
Effect of particle size
The effect of sample processing was evaluated by testing powdered uncooked samples of four different particle sizes. As shown in figure 1, lowest estimated GI of 40 ± 0.5 was observed when sample with particle size of 1000 microns was tested. The estimated GI of the tested samples was 40 ± 0.5, 47.8 ± 0.5, 63.7 ± 0.9 and 78.9 ± 0.5 for particle sizes 1000, 850, 500 and 250 microns respectively. The estimated GI significantly increased with decreasing particle size (p ≤ 0.001), thus suggesting an inverse relation between GI and particle size.
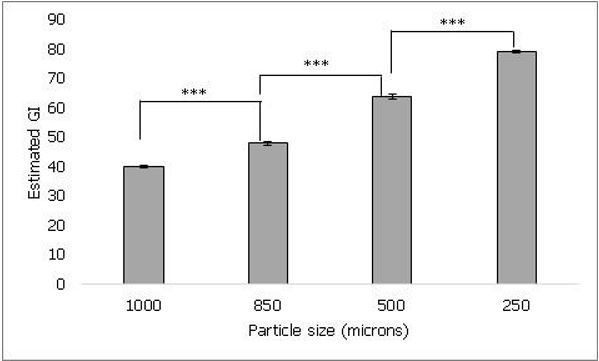
Figure 1. It shows the effect of particle size of rice on estimated GI. As the particle size decreased from 1000 microns to 250 microns, the estimated GI was found to increase. Values represented as mean ± standard deviation. p≤0.001 denoted by ***.
Effect of cooking methods
In order to evaluate effects of cooking methods commonly followed by rice consumers, one of the commonly consumed rice variety (Sona masuri) was cooked by five different methods and GI was estimated. As shown in figure 2, rice cooked in electric cooker without pre-soaking showed significantly higher estimated GI (86 ± 2) than pressure cooked (81 ± 2, p ≤ 0.05), steam cooked (77 ± 5, p ≤ 0.01) and open vessel (80 ± 3, p ≤ 0.01) cooked rice. Rice cooked in electric cooker with pre-soaking (86 ± 2) also showed significantly higher estimated GI than steam cooked (77 ± 5, p ≤ 0.05) and open vessel (80 ± 3, p ≤ 0.05) cooked rice. No significant difference was found between pressure cooked and steam cooked rice samples or pre-soaked and unsoaked electric cooked samples. The data suggests that difference in cooking method for the same rice variety may lead to differences in estimated GI.
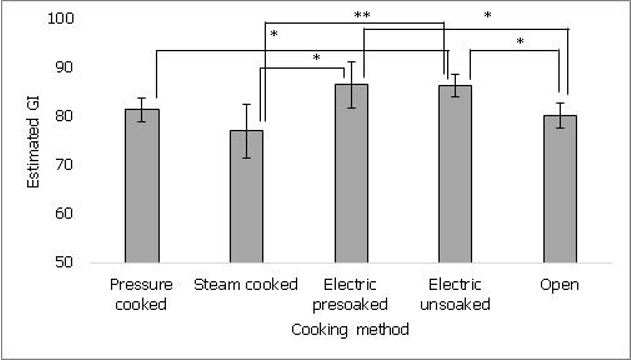
Figure 2. It shows the effect of cooking methods on estimated GI of rice. Steam cooking showed lower estimated GI compared to other methods. Values represented as mean ± standard deviation. p≤0.05 denoted by * and p≤0.01 denoted by **.
Glycaemic Index study
The demographic characteristics of study volunteers are represented in table 3. The mean age was 27.9 ± 6.02 (SD) years and BMI was 22.6 ± 3.94 (SD) kg/m2. The blood glucose response is shown in figure 3. The GI of Sona masuri rice was calculated as 70 ± 3 (SEM) and thus classified as high GI rice.
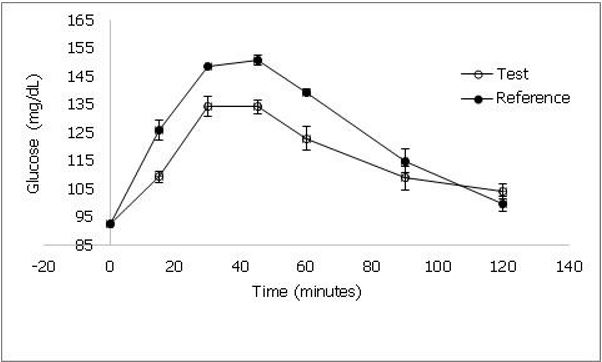
Figure 3. shows the blood glucose response curve of test and reference products when consumed by healthy human volunteers. Values represented as mean ± standard deviation.
Table 3. Demographic characteristics of volunteers
Characteristics |
Mean ± Standard Deviation |
Age (years) |
27.9 ± 6.02 |
Male (n) |
25 |
Female (n) |
25 |
Height (cm) |
163.7 ± 9.51 |
Weight (kg) |
60.1 ± 10.33 |
Waist Circumference (inches) |
31.66 ± 2.94 |
BMI (kg/m2) |
22.6 ± 3.94 |
Rice is a staple diet in most Asian countries and contributes to a large portion of daily carbohydrate intake. Rice is majorly composed of carbohydrate and digestibility of the grain is determined largely by its nutritional composition. American Diabetes Association classifies GI of 55 or less as low GI, 56-69 as medium GI and 70 or above as high GI. Rice has been reported to have GI in the range of 54 to 121 with white bread as reference food and thus falls in all three categories of low, medium and high GI [13]. Increased consumption of carbohydrates and high glycaemic load has been shown to be associated with higher risk of diabetes and cardiovascular diseases [11,28].
Hence for a predominantly rice eating population, it is pertinent to study the factors that affect GI for different varieties of rice, for the evaluation of risks associated with metabolic syndrome. GI of foods is evaluated in vivo, however testing of each variety in a human population can be expensive and challenging. In order to screen a large number of samples, a predictive in vitro method thus serves as an important and cost-effective tool towards prioritization for further in vivo assessments.
Different methods have been reported for testing in vitro digestibility and method established by Englyst et al. [21] is commonly followed. Modification of this method has been reported in the light of both enzyme source and concentration, as well as reaction time and termination [22,29]. In this study, we have shown an optimal method to terminate the enzymatic digestion reaction, aiding higher repeatability of in vitro digestibility estimation. Further, a combination of heat inactivation and absolute ethanol showed least standard deviation when compared to use of absolute ethanol alone. This may be due to incomplete inactivation by ethanol alone as reported earlier when 66% ethanol was shown to be insufficient compared to absolute ethanol for reaction termination [30]. An optimised method may thus aid in screening and estimation of GI for large number of samples.
The carbohydrate content is an important determinant of GI. In rice, the carbohydrate content is largely starch of which amylose is the major component that has been suggested to be associated with GI. Literature suggests rice to contain carbohydrates in the range of 73.6 to 85.2% [31]. The rice variety tested in our study showed carbohydrate content of 76 g/100 g. Juliano [27] suggested classification of rice (based on amylose content) as: waxy (0-2%), very low (5-12%), low (12-20%), intermediate (20-25%) and high (25-33%). The tested variety showed an intermediate amylose content of 23%. We also tested two other varieties, namely, Ponni and Sampada (carbohydrate content of 71 and 73 g/100 g, amylose content of 30 and 29%, estimated GI of 73 and 74 and cooking times of 15 and 14 minutes respectively; data not shown). Carbohydrate and amylose content were not found to be related as reported earlier [16,32]. The inconsistent observation across studies pertaining to relationship between amylose and GI has been summarised by Boers et al. [10]. Such differences in relationship between amylose and GI may be attributed to amylose density and chain length as suggested in some studies [16,17]. We observed carbohydrate content to be directly related to estimated GI. Amylose was found to be inversely related to estimated GI which corroborates with previous studies where high amylose rice and rice products showed lower GI than low amylose test products [13-15]. Furthermore, the gelatinisation of starch granule has been shown to be an important determinant of GI [33]. In this study, all the varieties evaluated, showed similar cooking times indicating that a difference in amylose content alone is not sufficient to affect cooking time.
Food samples to be tested in an in vitro system can be processed by multiple techniques, and estimation of in vitro digestibility thus serves as an important tool to evaluate the effect of these sample processing techniques. Granulation of food samples to varying particle sizes is one such processing method. Earlier studies have shown that particle size of food including different grades of wheat impact GI [33,34]. For the uncooked rice samples with particle size ranging between 1000 to 250 microns, our data suggests that decrease in particle size tends to increase estimated GI. The effect of mastication rate on glycaemic and insulin response has been previously shown as an important determinant of digestibility in addition to food composition [34-36]. Hence, our data corroborates with the inverse relation between decreasing particle size and increasing GI, as reported earlier.
In addition to the nutritional composition, cooking method is an important determinant of consumer preference for rice consumption along with the condiments consumed with rice. Chiu and Stewart [37] have studied the changes in resistant starch upon cooking rice by different methods. While changes in resistant starch were observed, the GI was not affected significantly. In our study, differences in GI were observed when rice was cooked by five different methods. This may be due to the extent of gelatinisation achieved by each method and needs further evaluation.
The commonly consumed white rice variety (Sona masuri) tested by in vitro predictive method showed high estimated GI (77 ± 5) and when studied in healthy human volunteers confirmed a high GI (70 ± 2), thus elucidating the significance of an in vitro screening tool. However, further studies are required to confirm effect of varying cooking methods on GI. Correlation between in vitro and in vivo data has been previously shown by Fitzgerald et al. [38]. Our data shows that in vitro estimate results are in line with the observations of in vivo study, thus serving as a quick and inexpensive screening methodology.
Ley et al. [39] summarized that availability of high calorie food and refined carbohydrates to be major risk factors in prevalence of type 2 diabetes. In view of increased incidence of metabolic disorders in predominantly rice eating population, development of reliable predictive in vitro digestibility method can serve as an affordable screening tool to identify low GI foods. To the best of our knowledge, such data for Sona masuri rice variety has not been reported earlier.
We have shown that nutritional composition, particle size and consumer cooking methods affect in vitro digestibility. Also, our clinical study, corroborates in vitro estimated GI. Hence, in vitro method may be employed as a tool specifically during large number of varieties and processed food samples.
No funding was received from any external agency for this research. The authors are grateful to Dr. Saiprasad Gandra (ITC Life Sciences & Technology Centre) for providing Sampada rice sample.
- Jenkins DJ, Wolever TM, Taylor RH, Barker H, Fielden H, et al. (1981) Glycemic index of foods: a physiological basis for carbohydrate exchange. Am J Clin Nutr 34: 362-366. [Crossref]
- Ludwig DS (2002) The glycemic index: physiological mechanisms relating to obesity, diabetes, and cardiovascular disease. JAMA 287: 2414-2423. [Crossref]
- Mohan V, Radhika G, Vijayalakshmi P, Sudha V (2010) Can the diabetes/cardiovascular disease epidemic in India be explained, at least in part, by excess refined grain (rice) intake? Indian J Med Res 131: 369-372. [Crossref]
- Sun Q, Spiegelman D, van Dam RM, Holmes MD, Malik VS, et al. 2010. White rice, brown rice, and risk of type 2 diabetes in US men and women. Arch Intern Med 170: 961-969. [Crossref]
- Hu EA, Pan A, Malik V, Sun Q (2012) White rice consumption and risk of type 2 diabetes: meta-analysis and systematic review. BMJ 344: e1454. [Crossref]
- Singh SK (2017) Grain and Feed Annual, India. GAIN Report Number: IN7031.
- Srichuwong S, Sunarti TC, Mishima T, Isono N, Hisamatsu M (2005) Starches from different botanical sources I: Contribution of amylopectin fine structure to thermal properties and enzyme digestibility. Carbohydrate Polymers 60: 529-538.
- Sajilata MG, Singhal RS, Kulkarni PR (2006) Resistant Starch - A Review. Comprehensive Reviews in Food Science and Food Safety Vol: 5.
- Ao Z, Simsek S, Zhang G, Venkatachalam M, Reuhs BL, et al. (2007) Starch with a slow digestion property produced by altering its chain length, branch density, and crystalline structure. J Agric Food Chem 55: 4540-4547. [Crossref]
- Boers HM, Seijen Ten Hoorn J, Mela DJ (2015) A systematic review of the influence of rice characteristics and processing methods on postprandial glycaemic and insulinaemic responses. Br J Nutr 114: 1035-1045. [Crossref]
- Foster-Powell K, Holt SH, Brand-Miller JC (2002) International table of glycemic index and glycemic load values: 2002. Am J Clin Nutr 76: 5-56. [Crossref]
- Kaur B, Ranawana V, Henry JK (2016) The glycaemic index of rice and rice products: a review, and table of GI values. Crit Rev Food Sci Nutr 56: 215-236. [Crossref]
- Miller JB, Pang E, Bramall L (1992) Rice: a high or low glycaemic index food? Am J Clin Nutr 56: 1034-1036. [Crossref]
- Frei M, Sidduraju P, Becker K (2003) Studies on the in vitro starch digestibility and the glycemic index of six different indigenous rice cultivars from the Philippines. Food Chem 83: 395–402.
- Trinidad TP, Mallillin AC, Encabo RR, Sagum RS, Felix AD, et al. (2013) The effect of apparent amylose content and dietary fibre on the glycemic response of different varieties of cooked milled and brown rice. Int J Food Sci Nutr 64: 89-93. [Crossref]
- Panlasigui LN, Thompson LU, Juliano BO, Perez CM, Yiu SH, et al. (1991) Rice varieties with similar amylose content differ in starch digestibility and glycemic response in humans. Am J Clin Nutr 54: 871-877. [Crossref]
- Al-Mssallem MQ, Hampton, SM, Frost GS, Brown JE (2011) A study of Hassawi rice (Oryza sativa L.) in terms of its carbohydrate hydrolysis (in vitro) and glycaemic and insulinaemic indices (in vivo). Eur J Clin Nutr 65: 627-634. [Crossref]
- Björck I, Elmståhl H (2003) The glycaemic index: importance of dietary fibre and other food properties. Proc Nutr Soc 62: 201–206. [Crossref]
- Englyst HN, Kingman SM, Cummings JH (1992) Classification and measurement of nutritionally important starch fractions. Eur J Clin Nutr 46: S33-50. [Crossref]
- Goni I, Garcia-AIonso A, Saura-Calixto F (1997) A starch hydrolysis procedure to estimate glycemic index. Nutr Res 17: 3 427-437.
- Englyst KN, Englyst HN, Hudson GJ, Cole TJ, Cummings JH (1999) Rapidly available glucose in foods: an in vitro measurement that reflects the glycemic response. Am J Clin Nutr 69: 448-454. [Crossref]
- Chung HJ, Lim HS, Lim ST (2006) Effect of partial gelatinization and retrogradation on the enzymatic digestion of waxy rice starch. Journal of Cereal Science 43: 353–359.
- Argyri K, Athanasatou A, Bouga M, Kapsokefalou M (2016) The Potential of an in Vitro Digestion Method for Predicting Glycemic Response of Foods and Meals. Nutrients 8: 209.
- Wolever TMS, Jenkins DJA, Jenkins AL, Josse RG (1991) The glycemic index: methodology and clinical implications. Am J Clin Nutr 54: 846-854. [Crossref]
- Brouns F, Bjorck I, Frayn KN, Gibbs AL, Lang V, et al. (2005) Glycaemic index methodology. Nutr Res Rev 18: 145-171. [Crossref]
- Carbohydrates in human nutrition (1998) Report of a Joint FAO/WHO Expert Consultation.
- Juliano BO (1992) Structure, chemistry and function of the rice grain and its fractions. Cereal Foods World 37: 10.
- Liu S, Willett WC, Stampfer MJ, Hu FB, Franz M, et al. (2000) A prospective study of dietary glycemic load, carbohydrate intake, and risk of coronary heart disease in US women. Am J Clin Nutr 71: 1455-1461. [Crossref]
- Anderson GH, Cho CE, Akhavan T, Mollard RC, Luhovyy BL, et al. (2010) Relation between estimates of cornstarch digestibility by the Englyst in vitro method and glycemic response, subjective appetite, and short-term food intake in young men. Am J Clin Nutr 91: 932-939. [Crossref]
- van Kempen TA, Regmi PR, Matte JJ, Zijlstra RT (2010) In vitro starch digestion kinetics, corrected for estimated gastric emptying, predict portal glucose appearance in pigs. J Nutr 140: 1227-1233. [Crossref]
- Devi GN, Padmavathi G, Babu R, Waghray K (2015) Proximate Nutritional Evaluation of Rice (Oryza Sativa L.). Journal of Rice Research 8: 1.
- Zhu LJ, Liu QQ, Wilson JD, Gu MH, Shi YC (2011) Digestibility and physicochemical properties of rice (Oryza sativa L.) flours and starches differing in amylose content. Carbohydrate Polymers 86: 1751–1759.
- Foster-Powell K, Miller JB (1995) International tables of glycaemic index. Am J Clin Nutr 62: 871S-890S. [Crossref]
- Holt SH, Miller JB (1994) Particle size, satiety and the glycaemic response. Eur J Clin Nutr 48: 496-502. [Crossref]
- Ranawana V, Monro JA, Mishra S, Henry CJ (2010) Degree of particle size breakdown during mastication may be a possible cause of interindividual glycemic variability. Nutr Res 30: 246-254. [Crossref]
- Ranawana V, Leow MK, Henry CJ (2014) Mastication effects on the glycaemic index: impact on variability and practical implications. Eur J Clin Nutr 68: 137-139. [Crossref]
- Chiu YT, Stewart ML (2013) Effect of variety and cooking method on resistant starch content of white rice and subsequent postprandial glucose response and appetite in humans. Asia Pac J Clin Nutr 22: 372-379. [Crossref]
- Fitzgerald MA, Rahman S, Resurreccion AP, Concepcion J, Daygon VD, et al. (2011) Identification of a Major Genetic Determinant of Glycaemic Index in Rice. Rice 4: 66–74.
- Ley SH, Hamdy O, Mohan V, Hu FB (2014) Prevention and Management of Type 2 Diabetes: Dietary Components and Nutritional Strategies. The Lancet 383: 1999–2007. [Crossref]