Abstract
Purpose: To prospectively determine whether diffusion-weighted cardiac MR imaging (DWI) is feasible and to determine cardiac DWI patterns in patients with acute myocarditis, by comparison with delayed-enhancement (DE) cardiac magnetic resonance (CMR) sequences.
Method: Fifty-eight consecutive patients referred for CMR with a clinical presentation suggestive of acute myocarditis were included. Rest MR examinations included DWI, black-blood fat-suppressed T2-weighted, first-pass perfusion, and DE sequences. Abnormal DWI areas were matched to abnormal DE areas. The apparent diffusion coefficient (ADC) was measured in involved areas and compared to remote normal areas.
Result: Qualitative assessment of DWI compared with DE images yielded a sensitivity of 92%. DWI patterns were significantly correlated to DE patterns, with focal or multifocal nonsegmental nonsubendocardial hypersignals (DWI, 2.78 ± 0.62 segments vs DE, 3.36 ± 0.63 segments, p = ns), predominantly in an inferolateral location. Qualitative assessment of DWI compared to LGE images yielded a sensitivity of 97% and a specificity of 61%. Segment-by-segment comparison showed a high level of correlation (y = (0.91) x + 0.47, r = 0.9049). The ADC of affected segments vs normal remote myocardium was 74.1 % ± 5.6 %. The absolute ADCs (abnormal DE area 0.00751±0.00042 mm2/s, normal myocardium close to abnormal DE area 0.00824±0.0004 mm2/s, and remote normal myocardium 0.00928±0.00049 mm2/s) and relative ADCs were significantly different between groups (P<0.05) except between abnormal DE area and normal myocardium close to abnormal DE area.
Conclusion: Extent of myocardial involvement in myocarditis is larger, using absolute ADC measurements at DWI imaging, than expected at DE enhancement. Moreover, ADC maps should help better understand inflammatory phenomena such as an underestimated extent of lesions by late-enhancement sequences. Hence, this sequence should help better appreciate the real extent of myocardial injury in myocarditis.
Key words
myocarditis, magnetic resonance imaging, diffusion magnetic resonance imaging
Abbreviations
DWI: Diffusion-Weighted Imaging, EPI: Echo-Planar Imaging, SSFP: Steady State Free Precession, LV: Left Ventricular, 2D: Two-Dimensional, 3D: Three-Dimensional
Introduction
MR imaging has become the cornerstone of the diagnosis of acute myocarditis. The correlation between MR patterns and MR-guided myocardial biopsies has led to a better knowledge of the disease [1-4]. Myocarditis corresponds to an acute injury of the myocardium, resulting in myocyte necrosis at a variable extent [5-7] associated with cellular infiltration and edema. Myocyte necrosis develops in the subepicardial areas then tends to diffuse transmurally at the subacute stage. The involved areas do not correspond to any coronary vascular territory.
Myocarditis can be caused by a variety of diseases but is primarily due to viruses. The clinical aspects are often limited to minor signs like fatigue, palpitations in the days following an acute episode of fever and/or angina. On the other hand, acute myocarditis can appear in certain cases with clinical features of acute cardiac failure. In 10% of the cases approximately, myocarditis can present as a more subacute presentation of a rapidly progressive dilated cardiopathy. Moreover, this disease can progress to chronic myocarditis and dilated cardiomyopathy.
MR examination in acute myocarditis is in general similar to that used in other indications, such as for myocardial viability assessment [8-9]. It has been recently observed that DWI was able to show recent myocardial infarction [10-14], but no study has yet been published in acute myocarditis. The purpose of this preliminary study was to assess the patterns and diagnostic accuracy of diffusion-weighted cardiac imaging with a particular concern to its sensitivity in acute myocarditis, by comparison with classic comprehensive MR acquisitions including black-blood fatsat T2 acquisitions for detection of edema, cineMR sequences, and firstpass perfusion and delayed-enhancement studies.
Material and method
Patients
Sixty-four consecutive patients with acute chest pain suggestive of an ongoing acute coronary syndrome without cardiac failure were prospectively investigated with MR imaging in the acute phase of the disease between September 2009 and August 2014, in a third care referral center specialized in the management of acute myocarditis. All the patients had undergone emergency coronary angiography upon admission. Patients were recruited after a normal coronary angiogram.
All the studies were performed according to the guidelines of the institution board on medical ethics and clinical investigation. Informed consent was obtained from all patients, as required by our institutional review board.
No patient had histological verification by endomyocardial biopsy in both institutions even if it is very sensitive when performed in abnormal MR areas [15], mostly because of its potential severe side-effects, and because the risk-to-benefit ratio may be questionable for a disease which appears benign and spontaneously regressive in most of cases.
The final diagnosis was made on the basis of a normal coronary angiogram with normal, diffuse or non-matched wall motion abnormalities at transthoracic echocardiography, a transient rise in biochemical markers of myocardial injury, followed by a spontaneous resolution of clinical symptoms and of segmental or global wall motion abnormalities, and optionally, a history of a recent infectious episode.
Criteria of exclusion included previous myocardial infarction or known coronary artery disease, MR imaging findings of myocardial infarction (i.e., enhancement involving the subendocardial layer in a vascular territory, or contraindications to MR. Finally, 58 patients were eligible (43 males and 15 females, aged 38.5 ± 3.4 years).
MR Imaging
MR examinations were performed using a GE Twinspeed 1.5 Tesla system (Milwaukee, Wisconsin) with high-performance gradients (amplitude, 40 mT/m, slew rate, 150 mT/m/msec) and a dedicated eight-channel cardiac phased array coil. All the sequences were ECG-gated. Diffusion-weighted imaging (DWI) was added to the comprehensive cardiac MR examination currently used in these patients.
Scout localization was performed using breath-hold real time and steady-state free precession images of true anatomical axes of the heart.
After scout localization, breath-hold DWI was performed in the axial plane in all patients, and in short axis plane in the last 19 patients (short axis DWI acquisitions were not available for the 39 first MR examinations). Typical DWI parameters were single-shot spin-echo EPI, TR/TEeff 3000-4000/60-80 msec (with a TR of 3 to 5 R-R intervals depending on the heart rate), b factor, 300sec/mm2, field-of-view 44x44 cm, section thickness 8 mm with a gap of 1 mm as for other sequences, bandwidth 167 kHz, 16-24 sec acquisition time. Matrix size was 256 x 128. The diffusion gradient was applied in 3 orthogonal directions (x, y, and z), and an average of these measurements was calculated to give the trace of the diffusion tensor. Averaged DW images were processed to generate the trace ADC maps based on pixel-by-pixel calculation of signal intensity according to the following equation: ADC = ln(S0/S1)/ (b1 – b0), where S0 and S1 are the signal intensities on the two DW images with b0 = 0 and b1 = 300 sec/mm2. In a subset of 28 patients, several DWI b-factors were used per-patient, ranging from 250 to 500 by step of 50 sec/mm².
Following DWI, T2-weighted breath-hold black-blood acquisition was based on a triple-inversion fast spin echo technique (typically, TR = 2RR, TE 64msec, IT 140 ms, 8mm slice thickness, matrix 192 x 256, field of view 310 x 310mm), and images were obtained in axial and/or short axis views.
Breath-hold cine SSFP gradient echo images were acquired in short axis and four chamber views with the following parameters: 4.2/1.5 (repetition time msec/echo time msec); flip angle, 60°; field of view, 310 x 310 mm; matrix, 224 x 224; section thickness, 8 mm; about 35 phases per section, according to the cardiac frequency. Twelve views were shared per phase.
The acquisition of myocardial first-pass perfusion data was based on a short axis ECG-gated inversion-recovery T1-weighted multishot gradient-echo EPI sequence with interleaved notched saturation (TR 6.6ms, TE 1.3ms, Flip Angle 25°, TI 240ms). Five to eight 8mm-thick short axis sections (128 x 128 pixels in a 330mm field of view) were acquired for every 2 heartbeats, typically repeated 35 times, according to heart rate. A 3- to 4-second intravenous bolus of 0.2 mmol/kg gadolinium chelate (Dotarem®, meglumine gadoterate, Guerbet, Aulnay-sous-bois, France) was injected, at a rate of 4 ml/sec followed by a 20 ml flush of saline solution at the same rate.
Ten to12 minutes later, delayed-enhancement (DE) study was performed in diastole using an inversion-recovery T1-weighted multishot gradient-echo sequence in short axis, long axis and four chamber views using the following parameters: 3D acquisitions, TR 3.9 msec, TE 1.4 msec, Flip Angle 25°, TI 200-240 msec, FOV 270x340 mm, matrix 192x256, ten 8mm-thick short axis sections for an imaging time of 19sec.
Reading criteria
Qualitative interpretation was made by 3 experienced readers (JPL, with > 10 years of experience in cardiovascular MR imaging; VG and JMS, with > 5 years of experience in cardiovascular MR imaging) in consensus.
Post-processing consisted in a coregistration between DWI and delayed-enhancement abnormalities on the AW software (GE Healthcare, Milwaukee, Wis). Additionally, DWI images were reconstructed in the adequate MPR single or double oblique plane to coregister with delayed enhancement images (Figure 1).
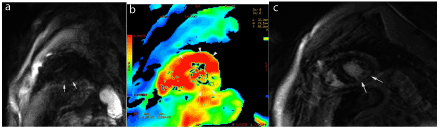
Figure 1. Acute viral myocarditis involving the inferolateral wall. Short-axis DWI images (a) and ADC map (b) show high signal of the lateral wall with decreased ADC (arrows), as well as delayed enhancement images in short axis views (c).
The quality of axial DWI images was interpreted on a 4-point scale: 0 Poor, 1 Fair, 2 Adequate, 3 Good.
On DWI images, the hyperintense regions were considered as diseased, when compared to normal myocardium which displayed no signal. On post-contrast delayed-enhanced sequences, the hyperenhanced regions were defined as distinct myocardial high signal.
Analysis was done segment by segment. The LV myocardium was divided into 17 segments [13] encompassing the entire LV like in echocardiographic segmentation, and a location within the myocardium (subepicardial, centromyocardial or transmural) was described for each diseased segment. No attempt was made for measuring signal intensities of normal and abnormal areas of enhancement.
ADC maps (Functool, GE Healthcare, Milwaukee, Wis) were calculated from regions of interest (ROI) placed on the DWI hypersignal area on images with b factor at 300sec/mm2, and on remote normal myocardium on images with b factor at 0sec/mm2. ADC was measured after having determined ROIs: a) for the area of abnormal hyperintensity on the initial DW image coregistered with the delayed hypersignal on DE image; b) for an area of normal myocardium close to abnormal DE; and c) for a remote normal myocardial area located in the septal wall. Absolute and relative pixel values and mean values were generated for all ROIs on each section of the initial DW image and ADC map. The relative pixel values of ADC or DW image signal intensity were calculated by dividing each pixel value by a reference value (the mean value of the remote normal myocardium). Contrast-to-noise ratio (CNR) of ADC and signal intensity was calculated as follows: [(A – B)/B] x100, where A is the ADC value or signal intensity in the region of disease and B was that of remote myocardial tissue. Quantitative color-coded DW images and ADC maps were generated according to optimal cut-off thresholds for ADC, ADC ratio, and signal intensity ratio obtained by means of statistical analyses of ROI- and pixel-based data (Figure 2).
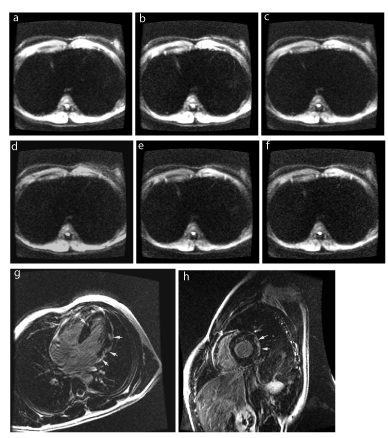
Figure 2. Acute viral myocarditis involving the lateral wall: Axial DWI images of the heart obtained at b factors of 250 sec/mm² (a), 300 sec/mm² (b), 350 sec/mm² (c), 400 sec/mm² (d), 450 sec/mm² (e), and 500 sec/mm² (f), as compared with 4-chamber (g) and short-axis (h) delayed –enhancement images (shot arrows). Hypersignal detection is better seen on image (b).
Statistical analysis
Statistical analysis was performed by using commercially available software (SPSS-PC, version 10.0; SPSS, Chicago, IL). For the statistical analysis of ROI-based data, two-way analysis of variance (ANOVA) was used to compare the mean values of each ROI. Comparisons between the mean values of the ROIs were performed by using a paired t test. The number of segments involved with DWI and DE was analyzed by the chi-square test for the location of abnormalities; and the Mann-Whitney U test for number of segments involved in each group. Additionally, Pearson’s correlation coefficient was used to compare the location of hypersignal areas on DWI and DE acquisitions. Quantitative variables are presented as mean ± standard error of the mean (SEM). A p value <0.05 was considered significant.
Result
Clinical description and outcome
MR studies were performed 4.7 ± 1.1 days (range, 1 to 21 days) after the acute event. No patient had history of prior myocardial infarction. Twenty-three patients had a clinically obvious infectious episode 9.9 ± 2.1 days prior to admission. The primary symptom was acute chest pain in all patients. No patients had dyspnea or sign of cardiac failure. The mean serum concentration of troponin I was 8.1 ± 1.7 ng/ml. Electrocardiographic changes in the ST segment were observed in 17 patients (ST elevation in 11, ST depression in 6 patients) and T waves inversion in 11 patients associated with acute type II atrial-ventricular block in one patient. Echocardiography was normal in 37 patients and revealed regional left ventricle wall motion abnormalities in 21 patients. Coronary angiography revealed no significant coronary stenosis in each of the patients included. All the patients were discharged in the absence of any alternative diagnosis and without any complication; all of them were treated with beta-blockers and ACE inhibitors. At follow-up (6 ± 2 weeks), no patient had any complication (heart failure, arrythmias or sudden death) or any recurrent chest pain episode.
MRI study
All patients could hold their breath during DWI sequence acquisitions. The quality of axial DWI acquisitions was judged adequate or good in 54/58 patients and fair in 4 patients, resulting in a mean score of 2.4. Only 28 (47%) patients displayed interpretable short axis DWI images (Figure 1), double obliquity acquisitions resulting in the remaining patients in major image distortion. The best b-value to detect myocardial involvement in the last 28 patients was 300 sec/mm² (Figure 2).
MR imaging displayed abnormalities in 52 patients and was normal in 6 patients.
Twenty-nine patients had focal edema on T2-weighted images. First-pass perfusion studies were normal in all patients examined. Delayed-enhancement (DE) sequences showed myocardial abnormalities in all these patients. The abnormal enhancement patterns on DE images included hyperenhancing nodules in 11 patients, transmural involvement in a focal form in 5 patients, centromyocardial or subepicardial thick bands in 36 patients, and were normal in 6 patients. There was no correlation between troponin level and the number of segments affected (r = 0.1557, p = 0.46).
DWI displayed a focal hypersignal in 48/52 patients, resulting in a per-patient sensitivity of 92%. The abnormal DWI patterns included hyperintensity nodules in 17 patients, transmural involvement in a focal form in 4 patients, and centromyocardial or subepicardial thick bands in 27 patients (Figure 3 and 4). The ADC maps of diseased areas vs normal remote myocardium showed a relative decrease of the apparent diffusion coefficient in 48 patients (64.2 % ± 4%) and an increase in 4 patients (116.7 % ± 8.8 %), resulting in a mean relative ADC of 74.1 % ± 5.6 %. The increased relative ADC observed in the 4 patients corresponded to an area of diffuse edema. Absolute ADC was 0.00751±0.00042 mm2/s (confidence interval 0.00697–0.00805 mm2/s) in abnormal DE area, 0.00824±0.0004 mm2/s (confidence interval 0.00771–0.00877 mm2/s) in normal myocardium close to abnormal DE area, and 0.00928±0.00049 mm2/s for normal remote myocardium (confidence interval 0.00864–0.00992), P=0.01 or p = 0.02 respectively between abnormal DE area or normal myocardium close to abnormal DE area and remote myocardium (Figure 5). On the opposite, absolute ADCs were not significantly different between abnormal DE area and normal myocardium close to abnormal DE area (P=0.08).
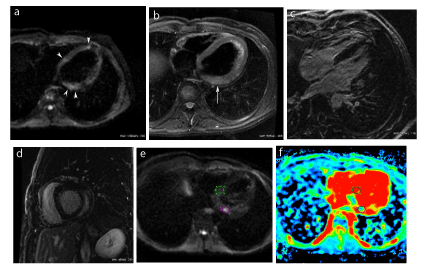
Figure 3. Acute viral myocarditis: Axial DWI image of the heart (a) showing 3 areas of high signal intensity, in a subepicardial location (arrowheads). The corresponding T2-weighted image with fat saturation at the same level (b) only shows a subepicardial high intensity in the basal lateral wall (arrow). Delayed enhancement image in a 4-chamber view (c) shows abnormal enhancement in the same areas as in (a). Laterobasal involvement is also shown on the delayed enhancement image in the short axis view (d). On a DWI slice contiguous to (a), the lateral hypersignal spot in the basal lateral wall (e) displays a decreased apparent diffusion coefficient, approximating one half that of the normal interventricular septum (f).
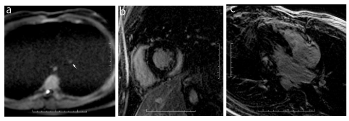
Figure 4. Acute viral myocarditis: Axial DWI images (a) show a spotty hypersignal in the basal lateral wall (small arrow) in the same location as seen on delayed enhancement images in short axis (b) and four chamber views (c).
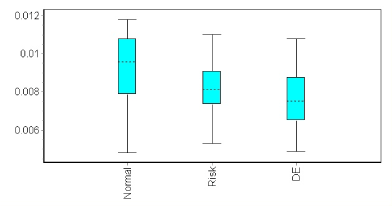
Figure 5. Box plot of ADCs in areas of abnormal delayed enhancement, close to abnormal delayed enhancement (“risk”) and in normal remote normal myocardium.
Both the relative and absolute ADCs were normal in the 6 patients with homogeneous delayed-enhancement pattern.
Comparison of the patterns on DWI and DE sequences
A total of 151 involved segments were detected with DWI, and of 182 involved segments with DE. DWI and DE studies gave similar results for the extent of involvement (2.78 ± 0.62 and 3.36 ± 0.65 segments respectively, p>0.05, range, 1 to 17 segments for both). There was also a good correlation between the two methods in the number of segments involved (Spearman, y = (0.94) x + 0.72, r = 0.96, p < 0.0001). Segment-by-segment comparison showed a high level of correlation (y = (0.91) x + 0.47, r = 0.9049, confidence interval 0.8219 to 0.9763, p < 0.0001).
Among the 31 segments missed at DWI, 17 were located in the inferior wall (segments 4,10 or 15), 8 in the anterior wall (segments 1, 7 or 13), 4 in the lateral wall (segments 5 or 6) and 2 in the septum (segment 14).
Per-patient and-per-segment, there was no false positive DWI study.
Additional findings
Areas of hypersignal of the aortic wall were observed in 21 patients. They were linear (Figure 6) and assumed to be related to viral inflammation in 15 patients, whereas they were scattered and attributed to aortic atheroma in 6 patients (age range 54-66 years), confirmed in these cases by aortic wall irregularities on adequate MR angiographic images. There was no correlation between troponin levels and aortic involvement (9.8 ± 4 ng/mL when positive vs 7.5 ± 3.5 ng/mL when negative, p = 0.36).
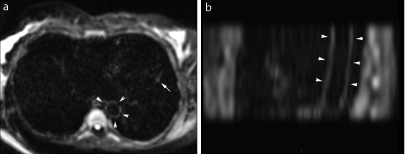
Figure 6. Aortic wall involvement in a 48-year-old male with acute myocarditis and no known factors of cardiovascular disease. Axial DWI images (a) and sagittal oblique reconstructions in the plane of aortic arch (b) show a diffuse thin linear hypersignal of the aortic wall of the descending aorta (arrowheads).
Three patients displayed a simultaneous pericardial effusion, not seen on DWI.
There was no signal abnormality seen on either sequence on peripheral red muscles, including DWI sequences.
Discussion
Our study demonstrated that DWI was able to show myocardial involvement in 92% of patients in less than one minute, with a similar extent assessment as delayed enhancement sequence. Moreover, absolute ADC and signal intensity values in the inflammatory and necrotic regions were significantly different from those of normal tissue. The decreased ADC mainly observed in these patients could be the result of increased cellularity due to inflammatory changes. In the 4 patients with increased ADC, the underlying cause could be mainly myocyte necrosis, and/or mixed cellular infiltration and edema. In no case was observed a normal ADC, which would have reflected T2-shine effect relative to edema [12-13,17].
However, the signal intensity was a better clue than was the ADC or ADC ratio for myocarditis diagnosis. Recent preliminary reports have suggested the usefulness of DWI MR imaging in myocardial infarction [10-11]. In the first case report, the b value used was 50 sec/mm2 whereas in the second study including several patients, the b value was arbitrarily set at 300 sec/mm2. It is known that the b value depends on the body region or organ being imaged, typically 500–1000 sec/mm2 for intraabdominal organs. Small b values (50–100 sec/mm2) result in diffusion restriction in tissues where there are decreased mobile water molecules within vessels such as in ischemic parenchymas, and hence, explore mainly perfusion; whereas higher b values provide diffusion restriction in cellular tissues, values around 1000 sec/mm2 exhibiting bright signal in normal (i.e. neurologic tissue) or abnormal (i.e. tumor) highly cellular tissues [15]. We chose b values of 300 sec/mm2 because it represented the best compromise between these two extreme values. Moreover, it seemed to be the most sensitive after having tested several b values from 250 to 500 sec/mm2.
The most important data provided by this study is that extent of myocardial involvement in myocarditis was more important on absolute ADC measurements with DWI imaging than expected at DE enhancement, as suggested in a previous study using native T1 mapping sequences [16]. This sequence should help better appreciate the real extent of myocardial damage.
MR features usually vary according to the completion date of the examination with regards to the onset of the cardiac clinical signs. One distinguishes a localised form classically the first 5 days, evolving to a more diffuse form as from the following days, although this progression of disease is discussed [2,17,18]. DWI at the present time was able to detect ongoing inflammation until 21 days from onset of disease. Hence, DWI could be helpful in case of delayed MR examination after the onset of symptoms where DE can be inconclusive, due to the diffuse extent of the disease after 8 days. Moreover, the activity of the disease should perhaps be monitored in more subacute forms.
The hypothesis that aortic wall involvement is associated with myocardial inflammation is further supported by our data, as was previously suggested peripheral muscle involvement [4], however not confirmed in the present study.
Our study has some limitations. First, the double oblique short axis DWI plane was not available in a majority of patients and hence, the axial DWI plane used was not optimal to depict anterior and inferior wall involvement. The majority of the missed involved segments with DWI were located in these areas. The coregistration between DWI images and delayed-enhancement images was difficult to obtain and, in some instances, lacked accurate precision. Furthermore, the segment-by-segment comparison probably gave optimistic results, since the evaluation was unblinded. Second, in case of chest pain suggesting an acute coronary syndrome, DWI is not yet able to discriminate between myocardial infarction and acute myocarditis, despite some subtle differences in hypersignal patterns [11]. Indeed, even if the areas of excessive contrast-enhancement seen on DE sequences, either nodular subepicardial or displaying midwall thick bands sparing the subendocardium were also seen on DWI images, they were depicted with less anatomic resolution. The morphologic patterns of DWI abnormalities can help locate the disease but do not yet seem able to provide a differential diagnosis between myocarditis and myocardial infarction.
Third, this sequence needs to be evaluated at different stages of the disease (i.e. acute vs active chronic and quiescent chronic).
Fourth, the underlying mechanisms of DWI hypersignal remain uncertain. Calculation of the apparent diffusion coefficient is important to confirm that a diffusion abnormality is attributable to focal inflammation. However, the main problem is to differentiate cellularity vs edema and perfusion abnormalities with a single b-value of 300 sec/mm2. Focal inflammation, cell necrosis and tissue edema are indeed all implicated as being responsible for excessive subepicardial delayed enhancement seen mainly in the acute phase of myocarditis [12,19-21].
Hence, a single b factor is not able to discriminate between edema (generally depicted on T2-weighted images), perfusion abnormalities and hypercellularity. The use of a fixed b-factor of 300 sec/mm2 is certainly insufficient to optimize characterization of diseased areas, and several b factors should be used to determine the best one exhibiting the disease. We have begun an ongoing study with this concern.
In conclusion, MRI is considered as a reference examination test in suspected acute myocarditis, except in the fulminant forms. DWI imaging, despite yet very low resolution, is feasible within one-minute examination, without use of contrast medium, and should provide additional rapid information in this disease, in particular when subepicardial enhancement is subtle on delayed-enhancement images. ADC maps as well as calculation of absolute ADC should help better understand inflammatory phenomena such as an underestimated extent of lesions by late-enhancment sequences. Hence, like native T1 mapping, this sequence should help better appreciate the real extent of myocardial infection.
It is too early, however, to know if DWI should be integrated or replace as a single fast acquisition the comprehensive and more cumbersome sequences used in this disease.
References
- Lie JT (1998) Detection of acute myocarditis using nuclear magnetic resonance imaging. Am J Med 85: 282-283.
- Friedrich MG, Strohm O, Schulz-Menger J, Marciniak H, Luft FC, et al. (1998) Contrast media-enhanced magnetic resonance imaging visualizes myocardial changes in the course of viral myocarditis. Circulation 97: 1802-1809. [Crossref]
- Gagliardi MG, Polletta B, Di Renzi P (1999) MRI for the diagnosis and follow-up of myocarditis.Circulation99 : 458-459. [Crossref]
- Laissy JP, Messin B, Varenne O, Iung B, Karila-Cohen D, et al. (2002) MR imaging of acute myocarditis: a comprehensive approach based on various imaging sequences. Chest 122 : 1638-1648. [Crossref]
- Feldman AM, McNamara D (2000) Myocarditis.N Engl J Med343 : 1388-1398. [Crossref]
- Aretz HT, Billingham ME, Edwards WD, Factor SM, Fallon JT, et al. (1987) Myocarditis. A histopathologic definition and classification.Am J Cardiovasc Pathol1 : 3-14. [Crossref]
- Magnani JW, Dec GW (2006) Myocarditis: current trends in diagnosis and treatment.Circulation113: 876-890. [Crossref]
- Laissy JP, Hyafil F, Feldman LJ, Juliard JM, Schouman-Claeys E, et al. (2005) Differentiating acute myocardial infarction from myocarditis: diagnostic value of early- and delayed-perfusion cardiac MR imaging.Radiology237: 75-82. [Crossref]
- Abdel-Aty H, Boyé P, Zagrosek A, Wassmuth R, Kumar A, et al. (2005) Diagnostic performance of cardiovascular magnetic resonance in patients with suspected acute myocarditis: comparison of different approaches.J Am Coll Cardiol45 : 1815-1822. [Crossref]
- Okayama S, Uemura S, Saito Y (2009) Detection of infarct-related myocardial edema using cardiac diffusion-weighted magnetic resonance imaging.Int J Cardiol133: e20-21. [Crossref]
- Laissy JP, Serfaty JM, Messika-Zeitoun D (2009) Diffusion-weighted cardiac MR imaging in recent and chronic myocardial infarction. Preliminary experience [in French]. IRM de diffusion cardiaque dans l'infarctus du myocarde récent et chronique : expérience préliminaire. J Radiol 90: 481-484.
- Potet J, Rahmouni A, Mayer J, Vignaud A, Lim P, et al. (2013) Detection of myocardial edema with low-b-value diffusion-weighted echo-planar imaging sequence in patients with acute myocarditis.Radiology269: 362-369. [Crossref]
- Kociemba A, Pyda M, Katulska K, Lanocha M, Siniawski A, et al. (2013) Comparison of diffusion-weighted with T2-weighted imaging for detection of edema in acute myocardial infarction. J Cardiovasc Magn Reson 15: 90. [Crossref]
- Laissy JP, Gaxotte V, Ironde-Laissy E, Klein I, Ribet A, et al. (2013) Cardiac diffusion-weighted MR imaging in recent, subacute, and chronic myocardial infarction: A pilot study. J Magn Reson Imaging 38: 1377-1387. [Crossref]
- Mahrholdt H, Wagner A, Deluigi CC, Kispert E, Hager S, et al. (2006) Presentation, patterns of myocardial damage, and clinical course of viral myocarditis.Circulation114: 1581-1590. [Crossref]
- Cerqueira MD, Weissman NJ, Dilsizian V, Jacobs AK, Kaul S, et al. (2002) Standardized myocardial segmentation and nomenclature for tomographic imaging of the heart. A statement for healthcare professionals from the cardiac imaging committee of the council on clinical cardiology of the American Heart Association. Circulation 105: 539-542. [Crossref]
- Koh DM, Collins DJ (2007) Diffusion-weighted MRI in the body: applications and challenges in oncology.AJR Am J Roentgenol188: 1622-1635. [Crossref]
- Yelgec NS, Dymarkowski S, Ganame J, Bogaert J (2007) Value of MRI in patients with a clinical suspicion of acute myocarditis.Eur Radiol17: 2211-2217. [Crossref]
- Ferreira VM, Piechnik SK, Dall'Armellina E, Karamitsos TD, Francis JM, et al. (2014) Native T1-mapping detects the location, extent and patterns of acute myocarditis without the need for gadolinium contrast agents. J Cardiovasc Magn Reson 16: 36. [Crossref]
- Deux JF, Maatouk M, Lim P, Vignaud A, Mayer J, et al. (2011) Acute myocarditis: diagnostic value of contrast-enhanced cine steady-state free precession MRI sequences.AJR Am J Roentgenol197: 1081-1087. [Crossref]
- Zarka S, Bouleti C, Arangalage D, Chopra H, Chillon S, et al. (2016) Usefulness of Subepicardial Hyperemia on Contrast-Enhanced First-Pass Magnetic Resonance Perfusion Imaging for Diagnosis of Acute Myocarditis.Am J Cardiol118: 440-445. [Crossref]