The living world encompasses an immense diversity of forms and structures, most of which are generated by irregular morphogenetic processes. The functional and metabolic phenomena which take place in living organisms follow non-linear dynamics, rather than the linear law of cause and effect, are irreversible and occur far from thermodynamic equilibrium [1]. Living organisms dissipate energy to ensure an alternation between self perpetuation far from the chaotic state, where entropy is greatest, and their functional and morphological configuration. Morpho-ultrastructural features and enzymatic-metabolic processes appear to be highly organized and correlated through a complex system of interactions. This enables organisms to tolerate a wide spectrum of intracelluar modifications pertaining to physiological events and hence to sustain their capacity for the adaptive response. The words of Johann W. Goethe (1787) are noteworthy in this context: “A tree is a living being which develops a series of organs consecutively in time which form links with each other and with the entire organism, from a unique and identical morphogenetic idea”. In contrast to the traditional vision based on concepts of homeostasis, linearity and reversibility the more recent epistemological approach to Nature is based on a set of coherent principles provided by chaos [1] and by the development of fractal geometry in this century [2]. Both fields have provided a new mathematic language which makes it possible to assess and describe morphological structures with complex qualitative properties, such as nonlinear physiological and tumoral phenomena in living organisms [3-7]. This runs counter to the conventional Euclidean approach, which is mainly suitable for describing ideal geometric bodies and linear phenomena, and is a break with Aristotelian assumptions. It has been argued that the design principle for living organisms follows fractal rules [8]. Over the last decade a large amount of experimental evidence has been accumulated showing that in biological tissues, fractal patterns or self-similar structures can be observed only within a “scaling window” of the length measurement which has to be established experimentally [9]. Within this window, experimental data sets show that the fractal dimension [FD] remains constant despite changes in magnification [10]. The fractal approach has already been used to characterize morphologic components and cellular ultrastructures such as the appearance of nuclear eu-and heterochromatin in hepatocytes [11], mesothelia cells [12], and lymphocytes [13], epithelial cells under hormones and growth factors [14] and during the onset of apoptosis or programmed cell death [15-17]. The need to go beyond subjective descriptions in immunology, morphological oncology, physiology, pathology and for diagnostic purposes has led to the adoption of the fractal approach to resolve optical microscopic images [18-21], to quantitatively describe morpho-histological and cytological features in breast cancer [22,23], in the diagnosis of prostate, oesophagus and colon lesions [24], in skin diseases such as mycosis fungoides and chronic dermatitis [25] and in several other neoplastic conditions, such as squamous cervical epithelioma [26], malignant mesothelioma [27], metastatic lung adenocarcinoma [12], prostatic carcinoma [28] and other cancers [29]. Previous records of physiologic and pathologic states have been used to illustrate the structural and functional complexity of a variety of cells and tissue organelles submitted to a variety of exogenous factors, stimuli and environmental constraints [30]. A specific comment may deserve the human brain, in reason of its anatomical-morphological and functional complexity [31]. Not so long ago there was no analytical method able to objectively describe the complexity of biological systems such as the brain [32]. The intricacy of mammalian brain folds led Mandelbrot to argue that “A quantitative study of such folding is beyond standard geometry, but fits beautifully in fractal geometry”. At that time however, there was no certainty about the brain’s geometry or about neuron branching. Experimental evidence that the complexity of the plane-filling maze formed from dendrites of neural Purkinje cells of cerebellum was more reduced in non-mammalian species than in mammals led Mandelbrot to comment: “It would be very nice if this corresponded to a decrease in D (fractal dimension), but the notion that neurons are fractals remains conjectural” affirmed Mandelbrot in his masterpiece [2]. Since then, a wealth of investigations have documented the fractal organization of the nervous tissue, the connective and immune system and the complex interactions occurring among distinct cellular elements with functional mechanisms of the brain [33]. A substantiating example might lie in a study that ascertained that the recruitment of T-lymphocytes and the activation of microglia are strongly involved in the maintenance of hippocampal neurogenesis and spatial learning abilities in the adult brain. CNS-specific T cells were also found to be required for memory and for the expression of brain-derived neurotrophic factor in the dentate gyrus, implying that a common immune-associated mechanism underlies different aspects of hippocampal plasticity and cell renewal in the adult brain [34].
Fractal geometry is a branch of mathematics much appropriate for describing complex natural and living phenomena. Not only it includes but goes beyond the Euclidian geometry formulated twenty-two centuries ago that pertained only to artificial and cultural realities. Fractal geometry was conceived in the last century and mainly developed by Benoit Mandelbrot in his masterpiece < The Fractal Geometry of Nature >. It provided a ground-breaking and innovative epistemological framework for interpreting the real life and the natural world in a way that avoids any subjective view. Founded upon a body of well-defined laws and coherent principles, including those derived from chaos theory, fractal geometry allows the recognition and quantitative description of complex irregular shapes, living forms, biologic tissues, and organized patterns of morphologic features whose dimensions are characterized by fractal / non-integer values. Fractal elements correlated through a broad network of functional interaction and metabolic processes that shapes adaptive responses and makes the process of life possible, and are the results of an iterative or recursive construction using corresponding algorithm. Obviously, this is in opposition to the conventional vision based on Euclidean geometry and widely adopted concepts, such as homeostasis, linearity, smoothness, and thermodynamic reversibility, which stem from a more intuitive, but artificially ideal, view of the reality. It follows that fractal analysis represents a non traditional mathematical and experimental method derived from Mandelbrot’s theory, and recently reviewed by underlying the relevance of power law relationships in the path to Fractals [35]. Although Mandelbrot’s famous seminal paper on statistical self-similarity and fractal dimension dates back to sixty years of the last century [36] and the first coherent essay on fractal geometry was published about fourthy years ago [37], it is worth here recalling exactly how and when the ‘‘heuristic introduction’’ of this innovative discipline occurred or, more vividly expressed, when ‘‘the irruption of fractal geometry’’ into the life sciences such as biology and medicine actually took place [38]. Although there no precise date can be given, it is generally agreed that fractal geometry was introduced during the ‘‘golden age’‘of cell biology, namely between the 1960s and 1990s, under the impulse of Swiss and French groups [5,39]. It was discovered that biologic elements, unlike deterministic mathematical structures, express statistical self-similar patterns and fractal properties within a defined interval of scales, termed “scaling window,” in which the relationship between the observation scale and the measured size or length of the object can be established and defined as the fractal dimension [FD] [9]. The fractal dimension of a biological component remains constant within the scaling window, constitutes a numerical descriptor that measures qualitative morphological traits and self-similar properties which in turn enables to quantify variations in length, area, or volume of irregular elements through changes of the measuring scale. It has been revealed that most biological elements, whether at cellular, tissue, or organ level, have self-similar structures within a defined scaling domain. However, concrete “fractality” exists only when the experimental scaling range encompasses at least two orders of magnitude, namely spans two decades on the logarithmic scale axis. Data spanning several decades of scale have been previously reported in many other fields: thus, defining a “scaling range” appears an inescapable requisite for assessing the fractality of every biological element. This emphasizes Mandelbrot’s statement “fractals are not a panacea; they are not every where” [2].
Application of fractal geometry to cell biology stemmed from the discovery that cellular membrane systems had fractal properties. What started it all was the uncertainty of observations regarding the extent of cell membranes in the liver, as findings from morphometry studies of liver cell membranes by various laboratories failed to match. This triggered much debate as to which of these estimates was correct, and whether liver cells contained 6 or 11 m2 of membranes per cm3, quite a significant difference. This raised doubts about the reliability of stereological methods, since they yielded conflicting results when measurements were made under different magnifications of the electron microscope. Ultimately, it was found that the estimates of surface density of liver cell membranes increased with increased resolution (Figure 1). Mandelbrot suggested that these results could be attributable to a scaling effect, analogous to the ‘‘Coast of Britain effect’’ [36] that explained why measurements of liver cell membranes at higher magnification yielded higher values than at lower magnification [39]. The scaling effect applies mainly to cellular membranes with a folded surface or an indented profile, such as the inner mitochondrial membrane or the rough endoplasmic reticulum (ER). In fact, the surface density estimate of rough membranes was found to be increased with increasing magnification, while the surface density measure of smooth outer mitochondrial membrane and smooth ER counterpart was only slightly affected by the resolution effect. Particularly at the electron microscopy level, the fractal analysis proved useful for an objective investigation of cell shape and cell phenotype, the fine cytoplasmic structures and the organization of cell membranes and nuclear components and other subcellular organelles, either in normal or pathological tissues or in cell cultures during time [40]. The fractal tool has also been employed to document the feasibility of using ultrastructural changes in cell surface and nuclear inter(eu)chromatin to assess the early phases of apoptotic cell death. Ultrastructural changes which involved a loss in heterochromatin irregularity due to its increased condensation (lower FD), were evident well before the detection of conventional cell markers, which were only measurable during the active phases of apoptosis [16]. Furthermore, the nuclear complexity of human healthy lymphocytes was shown to undergo a reduction of FD during the apoptotic process [17].
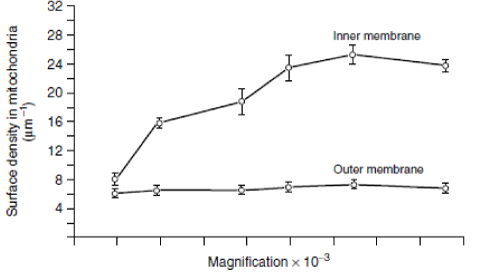
Figure 1. Changes of surface density estimates for outer and inner mitochondrial membranes with increased magnification. Reproduced from Paumgartner D, Losa GA, Weibel ER (1981) J Microscopy 121: 51-63.
The first application of fractal morphometry to non solid cancers came at early last decade of nine hundred century, when human leukemia cells of lymphoid and/or myeloid origin were characterized on electron microscopic images through quantitative measurement of membrane surface properties that could be correlated with specific phenotype markers [41] (Figures 2 and 3). Cells isolated ex vivo from the blood of humans with acute T-lymphoid leukemia revealed pericellular membranes with a nearly smooth outline as documented by fractal dimension values (FD: 1.10-1.11) significantly lower than those found for pericellular membranes of healthy blood cirdulating cells. Indeed, healthy lymphocytes of B-cell lineage had a fractal dimension (FD: 1.20) significantly different from that of lymphocytes of T-cell lineage, ie. CD4-T helper (1.17) and CD8-T suppressor (1.23) cells. Unexpectedly, strongly proliferating T-lymphoid leukemic cells were found to possess a plasma membrane characterized by a low FD value (1.10), close to the FD value measured on the plasma membrane of in vitro growing lymphoblasts derived from mature T-lymphocytes triggered by phytohemagglutinin (PHA), a mitogenic lectin. About 80% of acute leukemia subtypes of the B-cell lineage (c-ALL and pre-B undifferentiated phenotype) showed plasma membranes with FDs ranging from 1.12 to 1.17, below the FD of the plasma membrane of differentiated B-lymphocytes. The remaining cases (20%) of acute lymphoblastic B-leukemia showed a more convoluted cell surface with FD values of up to 1.24. The increase in FD, together with the accentuated coarseness of the nuclear surface, reflects significant changes in the DNA methylation pattern usually localized in heterochromatin nuclear regions and therefore was regarded as a bad prognostic factor for these patients. Taking advantage of the probabilistic method developed for measuring the fractal dimension FD, it was attempted to define wether the cell surface contour of normal lymphocytes and of blasts from distinct lymphoid malignancies could be characterized by a self-similar behaviour, namely, by a uniform or a multiple fractal-based dimension. The fractal dimension FDq calculated for five different moments q in accordance to the method developed by Voss [42] gave the same value: hence the fractal behaviour of cell contour of elements with different origin turns out to be uniform while for a non-uniform fractal the moments may take different values, indicating that such an object is multi-fractal [41]. Remodelling of cell surface before cells enter a physiologic proliferation or undergo a malignant transformation was established in lymphocytes and in leukemia elements for some time. It might occur by budding or shedding of microvesicles from their plasma membranes driven by a multiscale fractal mechanism of membrane microdomains extrusion (Figures 4A-4D). The usefulness of fractal analysis to assess the hematological cell phenotype and to define a clinical group was confirmed some 20 years later [43]. The analyse of nuclei contours of cells belonging to the B lineage, ie. normal lymphocytes and lymphoid cells isolated from patients with chronic lymphocytic leukemia (CLL), follicular lymphoma (FL), and diffuse large B-cell lymphoma (DLBCL) showed that the fractal dimension of perinuclear membranes were significantly different between the groups: reactive lymphocytes (FD= 1.20) were situated between CLL (FD=1.25) and normal cells (FD=1.13), while aggressive lymphoma cells had a significantly higher fractal dimension ranging from 1.23 (FL) to 1.31 (DLBCL). By comparing data from the latter papers dealing with hematological malignancies it turned out that cells isolated from patients with different types of leukemia and/or lymphoma have nuclear chromatin with roughness or complexity (high FD value) increasing with increasing degrees of aggressiveness and malignancy, whereas pericellular membranes acted inversely and looked smoother (low FD value) in cells having a high degree of malignancy. One could infer that hematological tumors did not undergo uniform neoplastic transformations, but rather manifest metabolic and phenotypic changes that imply either an increasing or a decreasing complexity of the morphological surface and an altered organization of cell components mainly dependent upon the cytotype under investigation. This contrasts with the behavior of cell colonies of distinct breast cancer types and experimental tumors, which were observed to obey the same dynamics of proliferation and growth and display contours with self-similar fractal features when submitted to scaling analysis [44]. Measuring the FD of euchromatin and heterochromatin nuclear domains helped to discriminate lymphoid cells found in Mycosis fungoides from those in chronic dermatitis [25]. Cells from hairy-cell leukemia, a chronic type of human leukemia, with a highly convoluted plasma membrane morphology and a completely different surface phenotype, displayed the highest FD-values, namely between 1.32 and 1.36 [41] (Figure 5). Fractal characteristics of chromatin, revealed by light or electron microscopy, have been extensively reported during the last 20 years. Fractal features can easily be estimated in digitalized microscopic images and are helpful for diagnosis and prognosis of neoplasias. High goodness-of-fit of the regression line of the FD is a favorable prognostic factor in acute leukemias and multiple myelomas. The nucleus has fractal and power law organization in several different levels, which might in part be interrelated. Some possible relations between modifications of the chromatin organization during carcinogenesis and tumor progression and an increase of the FD for stained chromatin are suggested. Fractal characteristics of nuclear chromatin were found to be independent prognostic factors in patients with multiple myeloma [45]. For some years an increasing attention is devoted toward the automated detection of leukemia cells and circulating blood cells from blood microscopic images. Features such as Hausdorff dimension, contour signature, shape and texture features were employed to classify blood lymphocytic cells into normal lymphocytes or lymphoblasts. An initial segmentation was performed using K-means clustering which segregates leukocytes or white blood cells (WBC) from other blood components i.e. erythrocytes and platelets. K-means data served to evaluate individual cell shape, texture and other features for final detection of leukemia, while fractal features were implemented for measuring perimeter roughness and hence classifying lymphocytic cell nuclei [46]. Another study of this Indian group deals with a comparative approach to Acute Lymphoblastic Leukemia (ALL) detection, based on WBC nucleus image segmentation and morphological analysis. Color based clustering is employed for segregating various blood components and obtaining the nucleus of the white blood cells. Further fractal geometry, contour signature and texture based techniques are employed for nucleus feature extraction which leads to automatic leukemia detection using a Support Vector Machine (SVM) classifier [47]. During carcinogenesis and tumor progression, an increase of the fractal dimension (FD) of stained nuclei has been shown in intraepithelial lesions of the uterine cervix and the anus, oral squamous cell carcinomas and adenocarcinomas of the pancreas. Furthermore, an increased FD of chromatin is an unfavorable prognostic factor in squamous cell carcinomas of the oral cavity and the larynx, melanomas and multiple myelomas. It was also noticed that in aggressive neoplasias the raise of the chromatin structure complexity may often be accompanied by a loss of heterochromatin and a less-perfect self-organization of the nucleus [48].
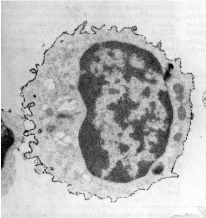
Figure 2 . Electron microscopy view of a healthy human suppressor CD8-decorated T-lymphocyte characterized by a wrinkled cell surface with a fractal Dimension of FD 1.23. Magnification: 18400 X. Reproduced from Losa GA, Baumann G, Nonnenmacher Th P (1992) Path Res Pract 188: 680-86.
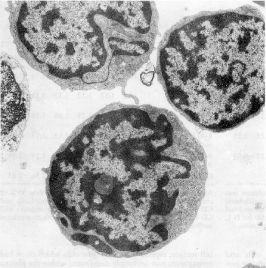
Figure 3. Electron microscopy view of a lymphoblast derived from an acute T-lymphoblastic leukemia characterized by a smooth cell surface with a low fractal dimension of FD 1.1. Magnification: 18400X. Reproduced from Losa GA, Baumann G, Nonnenmacher Th F (1992) Path Res Pract 188: 680-86.
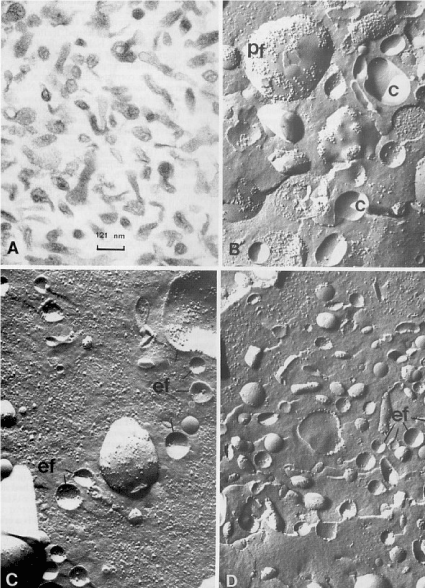
Figure 4. [A]: Electron microscopy view of a membrane pellet obtained by ultracentrifugation of serum from a patient with Common Acute Lymphoblastic Leukemia [c-ALL]. Magnification 82000X.
[B]: Freeze-fracture view of membrane vesicles isolated by ultracentrifugation of culture medium of Nalm-1 (a common acute lymphoblastic leukemia cell line). On freeze-fracture preparations, the fragments with a concave profile, corresponding to the external face of plasma membrane, displayed an intramembrane particle density (range: 0-750 particles / µm2) which is similar to that recorded on the corresponding face of intact Nalm-1 cells positive for the common acute lymphoblastic leukemia antigen and of vesicles shed in the culture medium by Nalm-1 cells. Magnification 64000X.
[C]: and [D]: Membrane fragments pelleted by ultracentrifugation of sera of two patients with c-ALL leukemia. These fragments were characterized by their concave faces with a low intramembrane particle density but similar to the particle density recorded on concave face of intact Nalm-1 cells and Nalm-1 membrane vesicles. Magnification 64000X.
C: indicates the concave external face of Nalm-1 membrane vesicles. Pf: indicates the convex protoplasmic face of Nalm-1 membrane vesicles. ef: indicates the concave face of membrane fragments isolated from sera of patients with c-ALL leukemia. The intramembrane particle density was evaluated only on the concave face of membrane vesicles according to the method described in [49]. Figures 4, B, C, D were reproduced from [49] Losa et al. (1986) Lab Investigation 55: 573-579.
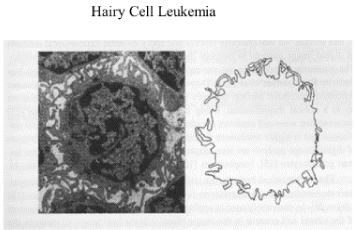
Figure 5. Electron microscopy view of an element isolated from blood with Hairy-cell leukemia, a chronic type of leukemia. A significant elevated fractal dimension of FD 1.32 characterized its membrane surface with a highly convoluted profile. Magnification 18400 X. Reproduced from Losa GA, Baumann G, Nonnenmacher Th F (1992) Path Res Pract 188: 680-86.
Irregularity and self-similarity under scale changes are the main attributes of the morphologic complexity of cells and tissues, both normal and pathologic. In other words, the shape of a self-similar element does not change when scales of measure change because any part of it might be similar to the original from which it derives. However, size and geometric parameters of an irregular object differ when inspected at increasing resolution that reveals more details. Significant progress has been made in understanding how to analyze irregular shapes and structures in biological and medical sciences thanks to the discovery of fractal geometry by Mandelbrot. The application of the principles of fractal geometry, unlike the conventional Euclidean geometry developed for describing regular and ideal geometric shapes practically unknown in nature, enables one to measure the fractal dimension, contour length, surface area, and other dimensional parameters of almost all irregular complex bodies and biological tissues. Hence the fractal dimension is a quantitative descriptor that can be used alone to identify morphological and ultrastructural features of cell components explicating distinct functional peculiarities. The fractal approach applied to measure contour and texture of nuclei, to evaluate the real spatial dimensions of cell surface membranes and intracellular organelles from isolated cells, including normal lymphocytes of distinct T and B lineages, lymphoma elements, acute lymphoblastic and myelogenous leukemia cells and other hematopoietic cells, has revealed its efficacity and led to reach the highly expected purpose, namely to reassess on a quantitative basis hematological cell phenotypes and an objective description of leukemia diseases.
- Prigogine I (1969) Structure, Dissipation and Life. Theoretical Physics and Biology, 1967 Versailles. North-Holland Publ. Company, Amsterdam.
- Mandelbrot B (1983) The Fractal Geometry of Nature. Freeman, San Francisco.
- Smith TG Jr, Marks WB, Lange GD, Sheriff WH Jr, Neale EA (1989) A fractal analysis of cell images. J Neurosci Methods 27: 173-180. [Crossref]
- Rigaut JP (1984) An empirical formulation relating boundary length to resolution in specimens showing ‘‘non-ideally fractal’’ dimensions. J Microsc 41–54:1984.
- Rigaut JP (1989) Fractals in Biological Image Analysis and Vision. In: Losa GA, Merlini D Eds. Gli Oggetti Frattali in Astrofisica, Biologia, Fisica e Matematica 111–145.Edizioni Cerfim, Locarno Switzerland.
- Nonnenmacher TF, Baumann G, Barth A, Losa GA (1994) Digital image analysis of self-similar cell profiles. Int J Biomed Comput 37: 131-138. [Crossref]
- Landini G, Rigaut JP (1997) A method for estimating the dimension of asymptotic fractal sets. Bioimaging 5: 65–70.
- Weibel ER (1991) Fractal geometry: a design principle for living organisms. Am J Physiol 261: L361-369. [Crossref]
- Losa GA, Nonnenmacher TF (1996) Self-similarity and fractal irregularity in pathologic tissues. Mod Pathol 9: 174-182. [Crossref]
- Dollinger JW, Metzler R, Nonnenmacher TF (1998) Bi-asymptotic fractals: fractals between lower and upper bounds. J Phys A: Math Gen 31: 3839–3847.
- Nielsen B, Albregtsen F, Danielsen HE (2005) Fractal Analysis of Monolayer Cell Nuclei from Two Different Prognostic Classes of Early Ovarian Cancer. In: Losa GA, Merlini D, Nonnenmacher TF, Weibel ER (Eds.), Fractals in Biology and Medicine.Vol IV, 175-186. Birkhäuser Press Basel, Switzerland.
- Sepulcre F, Grau J, Garcia-Bonafé M, Moragas A (2005) Fractal approach to the study of chromatin texture. In: Losa GA, Merlini D, Nonnenmacher TF, Weibel ER (Eds.), Fractals in Biology and Medicine 4: 226-230. Birkhäuser Press. Basel, Switzerland.
- Marinelli F, Santoro R, Maraldi NM (2005) Fractal analysis of heterochromatin nuclear domains in lymphocytes. In: Losa GA, Merlini D, Nonnenmacher TF, Weibel ER (Eds.), Fractals in Biology and Medicine 4: 220-225. Birkhäuser Press. Basel, Switzerland.
- Losa GA, Graber R, Baumann G, Nonnenmacher TF (1998) Steroid hormones modify nuclear heterochromatin structure and plasma membrane enzyme of MCF-7 Cells. A combined fractal, electron microscopic and enzymatic analysis. Eur J Histochem 42: 1-9. [Crossref]
- Castelli C, Losa GA (2001) Ultrastructural complexity of nuclear components during early apoptotic phases in breast cancer cells. Anal Cell Pathol 23: 1–9. [Crossref]
- Losa GA, Castelli C (2005) Nuclear patterns of human breast cancer cells during apoptosis: characterization by fractal dimension and (GLCM) co-occurrence matrix statistics. Cell Tissue Research 322: 257-267.
- Santoro R, Marinelli F, Turchetti G, et al. (2002 Fractal analysis of chromatin during apoptosis. In: Losa GA, Merlini D, Nonnenmacher TF, Weibel ER (Eds.), Fractals in Biology and Medicine. Vol III, Basel, Switzerland. Birkhäuser Press 3: 220-225.
- Cross SS (1994) The application of fractal geometric analysis to microscopic images. Micron 25: 101-113. [Crossref]
- Dioguardi N, Grizzi F (2002) Fractal dimension exponent for quantitativee evaluation of liver extracellular matrix in biopsy specimens. In: Losa GA, Merlini D, Nonnenmacher TF, Weibel ER (Eds.), Fractals in Biology and Medicine, Vol III, 113-120. Birkhäuser Press Basel, Switzerland.
- Landini G (2002) Complexity in tumour growth patterns. In: Losa GA, Merlini D, Nonnenmacher TF, Weibel ER (Eds.), Fractals in Biology and Medicine, Vol III, 268-283. Birkhäuser Press Basel, Switzerland.
- Landini G, Rippin JW (1993) Fractal dimensions of the epithelial-connective tissue interfaces in premalignant and malignant epithelial lesionsof the floor of the mouth. Anal Quant Cytol Histol 15: 144-149. [Crossref]
- Einstein AJ, Wu HS, Gil J (1998) Fractal characterization of nuclear texture in breast cytology: frequency and spatial domain approaches. In: Losa GA, Merlini D, Nonnenmacher TF, Weibel ER (Eds.), Fractals in Biology and Medicine. Vol II, 190-.206. Basel, Switzerland, Birkhäuser Press.
- Sharifi-Salamatian V, Pesquet-Popescu B, Simony-Lafontaine J, Rigaut JP (2004) Index for spatial heterogeneity in breast cancer. J Microsc 216: 110–122. [Crossref]
- Weyn B, Jacob W, Van de Wouwer G, Da Silva V, et al. Fractal Dimension, Form and Shape Factors for the Quantification of Nuclear Signature Profiles. In: Losa GA, Merlini D, Nonnenmacher TF, Weibel ER (Eds.), Fractals in Biology and Medicine, Vol III, 47-54. Birkhäuser Press Basel, Switzerland.
- Bianciardi G, Miracco C, Santi MD, et al. (2002) Fractal dimension of lymphocytic nuclear membrane in Mycosis fungoides and chronic dermatitis. In: Losa GA, Merlini D, Nonnenmacher TF, Weibel ER (Eds.), Fractals in Biology and Medicine. Basel, Switzerland, Birkhäuser Press.
- MacAulay C, Palcic B (1990) Fractal texture features based on optical density surface area. Use in image analysis of cervical cells. Anal Quant Cytol Histol 12: 394-8. [Crossref]
- Weyn B, Van De Wouwer G, Koprowski M, Van Daele A, Dhaene K, et al. (1999) Value of morphometry, texture analysis, densitometry, and histometry in the differential diagnosis and prognosis of malignant mesothelioma. J Pathol 189: 581-9. [Crossref]
- Irinopoulou T, Rigaut JP, Benson MC (1993) Toward objective prognostic grading of prostatic carcinoma using image analysis. Anal Quant Cytol Histol 15: 341-4.
- Baish JW, Jain RK (2000) Fractals and cancer. Cancer Res 60: 3683-3688. [Crossref]
- Losa GA (2012) Fractals in Biology and Medicine. In: Meyers R (Ed.), Encyclopedia of Molecular Cell Biology and Molecular Medicine, Wiley-VCH Verlag, Berlin.
- De Felipe J (2011) The evolution of the brain, the human nature of cortical circuits, and the intellectual creativity. Front Neuroanat 1-16.
- Werner G (2010) Fractals in the nervous system: conceptual implications for theoretical neuroscience. Front Physiol 1: 1-28.
- Losa GA (2014) On the fractal design in human brain and nervous tissue. Applied Mathematics 5:1725-1732.
- Ziv Y, Ron N, Butovsky O, Landa G, Sudai E, et al. (2006) Immune cells contribute to the maintenance of neurogenesis and spatial learning abilities in adulthood. Nature Neuroscience 9: 268-275. [Crossref]
- Losa GA, Ristanovic D, Ristanovic D, Zaleteld I, Beltraminelli S (2016) From Fractal Geometry to Fractal Analysis. Applied Mathematics 7: 346-354.
- Mandelbrot B (1967) How long is the coast of britain? Statistical self-similarity and fractional dimension. Science 156: 636-638. [Crossref]
- Mandelbrot B (1977) Fractals, Form, Chance and Dimension. WH. Freeman & Company, San Francisco USA.
- Belaubre G (2006) L’irruption des Géométries Fractales dans les Sciences. Editions Académie Européenne Interdisciplinaire des Sciences (AEIS), Paris.
- Paumgartner D, Losa GA, Weibel ER (1981) Resolution effect on the stereological estimation of surface and volume and its interpretation in terms of fractal dimensions. J Microsc 121:51-63. [Crossref]
- Bizzarri M, Pasqualato A, Cucina A, Pasta V (2013) Physical forces and nonlinear dynamics mould fractal cell shape. Quantitative Morphological parameters and cell phenotype. Histol Histopathol 28: 155-174.
- Losa GA, Baumann G, Nonnenmacher TF (1992) Fractal dimension of pericellular membranes in human lymphocytes and lymphoblastic leukemia cells. Pathol Res Pract 188: 680-686. [Crossref]
- Voss R (1985) Random fractals: characterization and measurement. In: Scaling phenomena in disordered systems, 1-11. Plenum Press, New York USA
- Mashiah A, Wolach O, Sandbank J, Uzie IO, Raanani P, et al. (2008) Lymphoma and leukemia cells possess fractal dimensions that correlate with their interpretation in terms of fractal biological features. Acta Haematol 119: 142–150.
- Brú A, Albertos S, Luis Subiza J, García-Asenjo JL, Brú I (2003) The universal dynamics of tumor growth. Biophys J 85: 2948-2961. [Crossref]
- Metze K, Ferro DP, Falconi MA et al (2009) Fractal characteristics of nuclear chromatin in routinely stained cytology are independent prognostic factors in patients with multiple myeloma. Virchows Archiv 2009;445:7-15.
- Mohapatra S, Patra D (2010) Automated leukemia detection using Hausdorff dimension in blood microscopic image. International Conference on Emerging Trends in Robotics and Communication Technologies (INTERACT).
- Mohapatra S, Patra D, Satpathy S (2012) Unsupervised Blood Microscopic Image Segmentation and Leukemia Detection using Color based Clustering. International Journal of Computer Information Systems and Industrial Management Applications 4: 477-485.
- Metze K (2013) Fractal dimension of chromatin: potential molecular diagnostic applications for cancer prognosis. Expert Rev Mol Diagn 13: 719-735. [Crossref]
- Losa GA, Heumann D, Carrel S, Von Fliedner V, Mach JP (1986) Charaterization of membrane vesicles circulating in the serum of patients with common acute lymphoblastic leukemia. Lab Investigation 55: 573-579. [Crossref]