Gait analysis using an inertial sensor is a convenient and efficient method of providing useful information for health-related applications. The current paper reviews the results of a collaborative testing program with contribution by a retirement community sand a local university. In addition, a useful measure of stability is introduced.
The National Council on Aging publishes this fact sheet, “Falls are the leading cause of fatal and non-fatal injuries for older Americans. Falls threaten seniors’ safety and independence and generate enormous economic and personal costs. However, falling is not an inevitable result of aging. Through practical lifestyle adjustments, evidence-based falls prevention programs, and community partnerships, the number of falls among seniors can be substantially reduced.”
The following is an excerpt from the Johns Hopkins website. It is a synopsis of the current situation.
“Falls can result in serious medical complications including hip fractures and head injuries. In many cases, those who experience a fall have a hard time recovering and their overall health deteriorates. Statistics show that more than 40% of people hospitalized from a hip fracture do not return home and are not capable of living independently again. The good news is that, with adequate knowledge, falls can be prevented.”
This stability testing method is an attempt to further the cause of “adequate knowledge”. Society needs a method of standardized testing and data evaluation. This method may be proactive in measures of mitigation of human suffering and cost of care.
In the absence of standardized testing, a testing routine was devised that included a series of segments. First, the subject was requested to walk forward through the length of a taped line (a distance of approximately 25 feet), turn 180 degrees, and walk forward to the origin.
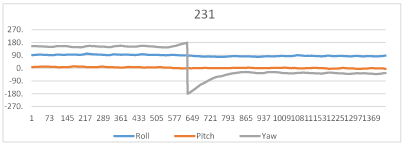
An inertial sensor was used to obtain real time data during the testing. These data were recorded and saved, and then were exported to a spreadsheet program for easier comparison as charts showing the entire scope of each test. For an example of an actual test see Figure 1. In Figure 1, it can be seen that as the subject turned to walk in the opposite direction, the yaw values change by 180 degrees. The plots of roll and pitch continued in a similar pattern as before.

Figure 1. Chart of Roll, Pitch and Yaw for an example test.
The inertial sensor was obtained from Xsens Technologies BV (Netherlands). Model MTw was used during these tests. This sensor includes accelerometers, gyroscopes, and magnetometers in three planes. The battery powered sensor communicates wirelessly with a dongle placed in a USB port on the host computer. The real time data was shown on the host computer screen, was recorded and saved for later evaluation.
The recorded data included roll, pitch and yaw as well as time stamp information. Rotation around the front-to-back axis is called roll. Rotation around the side-to-side axis is called pitch. Rotation around the vertical axis is called yaw.
Each test resulted in more than 15,000 packets of data. After 35 tests, over one-half million packets of data were recorded. The abundance of data has been described well by one author who is quoted as writing, “We are awash in data, but have no information.” Peter Drucker, author of texts on management, has said “Information is data endowed with meaning and purpose.” Our challenge is to find nuggets of golden information.
Software provided by the manufacturer of the inertial sensor is a powerful tool to merge measured data. The most informative data are derived from the Euler angles using Kalman filters. The X, Y and Z values of roll, pitch and yaw are plotted versus time so that a qualitative evaluation may be made, particularly when comparisons are made between subjects.
The recorded data were exported as a delimited text file to a spreadsheet program. The spreadsheet program provided import of the delimited data conveniently to columns in the spreadsheet. Analysis of yaw was necessarily done in segments coinciding with the testing segments. Roll and pitch were analyzed throughout the recorded test.
The analysis method applied this novel technique. The standard deviation of roll, pitch and yaw were calculated and then the length of a three-dimensional vector was determined by the following equation:
Stddev_total = SQRT(stddev_roll^2 + stddev_pitch^2 + stddev_yaw^2)
This method provided a single value that was indicative of the combined excursions of roll, pitch and yaw. It is proposed that this value be known as the Boger number. It may seem counter-intuitive that a higher value should indicate greater deviations in the combined effect of roll, pitch and yaw. However, it may be a convenient method to point to a greater need for physical therapy. The therapy may well begin with physical exercise.
Testing was conducted in collaboration with Samford University, Birmingham, Alabama. Two testing sessions were conducted for residents of a retirement community. During testing sessions various standardized tests were conducted as well as the walking stability tests. The second testing session followed the first by six weeks. It is expected to yield some useful information by comparing results after a period of six weeks.
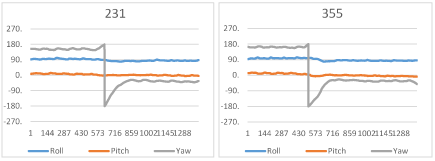
For instance, Figure 2 illustrates tests of participant 15 during the first and second sessions six weeks later. In the second test roll and pitch are somewhat higher and yaw is somewhat lower.

Figure 2. Tests of participant 15 during first and second testing sessions.
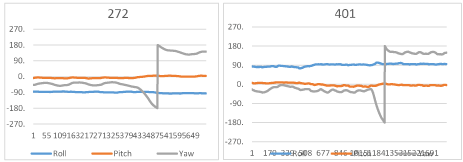
Similarly, Figure 3 illustrates tests of participant 8 during the first and second testing sessions. The second test shows improvement in all respects. It is not known if the participant is recovering from some ailment.

Figure 3. Tests of participant 8 during first and second testing sessions.
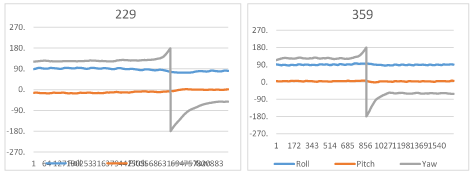
Also Figure 4 illustrates tests of participant 13. The second test shows a worse performance in all respects. Again, it is not known if the participant has suffered a setback of some kind.

Figure 4. Tests of participant 13 during first and second testing sessions.
In a similar fashion, Figure 5 illustrates tests of participant 16. The second test shows about equal roll, but less pitch and yaw.

Figure 5. Tests of participant 16 during first and second testing session.
The overall conclusion is that tests of this nature may be a convenient method to evaluate residents, who may over time require the assistance of a cane, walker or rehab care prior to the catastrophe of a fall.
Figure 6 shows a table of values of “standard deviation total” values (Boger numbers) for the tests illustrated in Figure 2 through Figure 5.
Figure 6. Table of Standard Deviation Values (Boger numbers)
Figure No. |
Participant |
Std dev total test1 |
Std dev total test2 |
2 |
15 |
7.718 |
10.628 |
3 |
8 |
11.102 |
5.675 |
4 |
13 |
9.014 |
12.846 |
5 |
16 |
6.747 |
3.356 |
The author wishes to acknowledge the contribution of the equation for summation of roll, pitch and yaw by Robert Boger. His expertise in applied mathematics has been a great help.
- Bachmann, H., Ammann, W (1987) Bachmann vibrations in structures : induced by man and machines. IABSE-AIPC-IVBH.
- Xsens Technologies B. V (2013) MTw User Manual.
- Van Nimmen, K, Lombaert G, Jonkers I, De Roeck G, Vanden Broeck P (2013) Characterisation of walking loads by 3D inertial motion tracking. J. Sound Vib. 333: 1-15.
2021 Copyright OAT. All rights reserv


