Background: Hematological and immunological parameters are fundamental components of person’s health assessment. Quantitative determination of normal reference range of hematological and immunological parameters of apparently health people used to assist diagnosis of various diseases. The reference values currently used in Asia and Africa have been obtained from researches on populations in developed countries and may not be applicable in most local settings. The local reference values for immunohematological parameters are essential components of evidence based medicine.
Objectives: The aim of the present study was to review exiting literatures and establishing normal reference range of hematological and immunological parameters in Ethiopia.
Result: Meta-analysis by random effect model showed that the estimated pooled mean and 95% CI of red blood cells, white blood cells, and platelets in males was 5.29 x 10¹²/l (95% CI; 5.15-5.44 x 10¹²/l) respectively while the mean and 95% CI of red blood cells, white blood cells, and platelets in females was 4.77 x 10¹²/l (95% CI; 4.61-4.94 x 10¹²/l) respectively.
Conclusion: the estimated pooled mean and 95% CI of hematological and immunological parameters showed some degree of difference with reference range adopted from developed country.
hematological, immunological, meta-analysis, reference interval, Ethiopia
Hematological and immunological parameters are fundamental components of person’s health assessment [1]. Quantitative determination of normal reference range of hematological and immunological parameters of apparently health people used to assist diagnosis of various diseases [2,3]. The reference values currently used in Asia and Africa have been obtained from researches on populations in developed countries and may not be applicable in most local settings [4]. The local reference values for immunohematological parameters are essential components of evidence based medicine [4].
Normal hematological and immunological parameters vary considerably between healthy people by age, gender, ethnicity, genetics, and geographical location [5]. Normal reference intervals (RIs) of hematological and immunological parameters of one population might be the cutoff point of clinical decision for other population [6] This indicates that pre-established hematological reference values from developed countries may lead to misdiagnosis and wrong treatments [7]. That is the reason why Clinical and Laboratory Standards Institute (CLSI) recommended that reference range should be established for each age, gender, ethnicity, and geographical location of the population [8,9].
In clinical practice before clinical decisions are made, patient’s laboratory results are compared with the corresponding reference intervals (RIs) [10,11]. Hematological and immunological RIs used in evaluating the state of health of individuals and/or populations [12], and also used in identifying people at risk for disease, in assessing immune status, disease progression and response to treatment [13,14]. Any deviation from normal hematological and immunological reference range is indicative for several human diseases and therefore constitutes important parameters for diagnosis and patient monitoring particularly in this era of evidence-based medicine [15-17].
Hematological and immunological parameters for example used to screen anemia, blood disorders, diseases of the immune system and infection [12]. Of particular importance is the use of reference values as surrogate markers for monitoring disease progression and response to antiretroviral therapy in HIV-infected individuals. For example, decisions to initiate, continue, or change antiretroviral therapy regimens are determined using CD4+ T lymphocyte cell (CD4) counts [18,19]
To our knowledge no meta-analysis conducted on hematological and immunological profiles in Ethiopia. The aim of the present study was to review exiting literatures and establishing normal reference range of hematological and immunological parameters in Ethiopia. This will help policy maker and it also helps health care worker in evidence based clinical medicine.
Objectives: The aim of the present study was to review exiting literatures and establishing normal reference range of hematological and immunological parameters in Ethiopia.
Types of participants
Participants were apparently healthy people; non pregnant women and HIV negative peoples.
Search strategy
We searched literatures published in English until November 2019 on electronic data bases PubMed, EMBASE, African Journal online (AJO) and Google scholar. We have also searched the reference lists of identified papers. Keywords used in the search included those that express hematological and Immunological parameters (e.g. complete blood count, hematological profiles, Immunological profiles, hematological parameters, Immunological parameters, hematological reference intervals, immunological reference intervals) combined with keywords related to population context of the study (e.g. apparently health people, healthy people, HIV negative people, blood donors, and Ethiopia). Full-text articles were retrieved after review of the title and abstract.
Inclusion and exclusion criteria
Inclusion criteria: Without publication year restrictions all studies published in English until November 25/2019 were included in the review. The review considered studies that include the following outcome measures: Mean, standard deviation and reference interval of hematological parameters (Red blood cells (RBCs), White blood cells (WBCs), platelets, WBCs differentials (neutrophil, eosinophil, basophil, monocytes, lymphocytes and immunological parameters (CD4, CD4%, CD8, CD3). Studies considered in this review were those which conducted hematological and immunological parameters using automated hematological analyzers. There was no restriction to study design made.
Exclusion criteria: Any study conducted on symptomatic patient and/or on pregnant women, and/or on HIV positive patients were excluded from the study. Studies which hematological parameters conducted using manual method were excluded. Studies determined hemoglobin concentration using Sahli-hillage and hematocrit using micro-hematocrit centrifuge method were excluded.
Selection of studies
Two authors (EA and KD) independently checked the titles and abstracts resulting from the searches. References of search results were manipulated using Endnote 5 citation manager. Relevant titles and abstracts were then selected by EA, KD and SA. EA and KD assessed all full-text articles for methodological quality.
Assessment of Methodological Quality
Studies selected for inclusion were assessed for methodological quality by two independent reviewers (EA and KD) using standard critical appraisal instruments of the Joanna Briggs Institute (JBI-MAStARI) [20]. For inclusion in the review, both reviewers agreed that a cut-off score of 60% out of 100% be used to determine acceptable quality for inclusion.
Ten methodological assessment criteria for quality assessment of included study were the following: objective of the study clearly described, study design clearly stated, sample size representativeness, method of analysis of hematological parameters, outcome assessed with the objective criteria, were confounders reported, were potential biases reported, was outcome clearly described, appropriate statistical analysis method used, and if whether the context of the study is Ethiopia.
Data extraction
Data were extracted from eligible study by three investigator (EA, KD, SA) using a standardized data extraction form. Then the extracted data were merged together for meta-analysis. Primary outcomes extracted from each study were, the citation details, sample size, year of publication, location of study, mean, standard deviation, and reference intervals of hematological and immunological parameters. Secondary outcome considered were mean, standard deviation, and reference range of hematological and immunological parameters according to age, sex, and population.
Statistical Analysis
The R software was used to pool the mean from the included studies with user contributed commands for meta-analyses: metamean, metainf, metabias, and metareg. The random-effects meta-analysis models were chosen because heterogeneity was demonstrated and it was used to determine the weighted mean difference (WMD) and 95% confidence intervals.
Risk of bias and sensitivity analysis
Statistical heterogeneity was evaluated using Cochrane Q x2 test and I2 statistic [21]. A significance level of P<0.10 and I2 >50% was interpreted as evidence of heterogeneity [22]. A potential source of heterogeneity was investigated by subgroup analysis and meta-regression analysis [23]. The presence of publication bias was assessed informally by visual inspections of funnel plots [24]. Sensitivity analysis was conducted to explores the effects of the addition/removal of lower quality studies on the results and conclusions of a review was reported [21].
Identified Studies
Following the initial search, 57 studies were reviewed by their title and abstract (Figure 1). Of these, 20 were retrieved for full-text review, 8 did not match the eligibility criteria for the study. Following methodological quality assessment, twelve articles were included in the meta-analysis. In a circumstance two articles reported outcomes from the same study; both articles were treated as a single study [25,26]. So, the final analyses included were 12 independent research studies. In the included studies a total of 8,148 apparently health people assessed for hematological and immunological parameters. All papers were published in English.
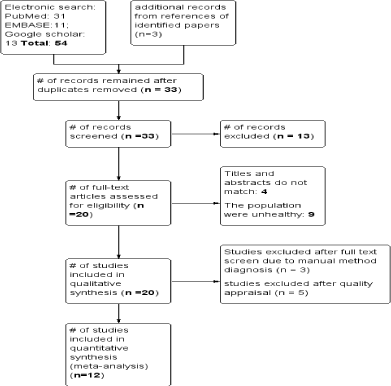
Figure 1. Flow chart of the search and study inclusion
Characteristics of included study
The characteristics of the included studies have been shown in (Table 1). Five studies were conducted on different population of the same town Addis Ababa [25-29]. One study was conducted in Gonder [30], one study in Debre Markos [31], one study in Amhara [32], one study in Bahr Dar [33], one study in Mekele [34], one study in Gojam [35], one study in Jimma [36] and one study was conducted in Gilgil Gibe [4].
Table 1. Characteristics of included study
Author |
Study site |
Year |
sample size |
study design |
study subject |
Aster Tsegaye |
Aqaqi qaliti |
1999 |
142 |
Cross-sectional |
Factory workers |
K Nebecka |
Addis Ababa |
2012 |
1,868 |
Cross-sectional |
Bank worker |
Bamlaku Enawgaw |
Amhara |
2018 |
967 |
Cross-sectional |
Blood donors |
Bayeh Abera |
Bahr Dar |
2012 |
405 |
Cross-sectional |
VCT seeking adult |
Tigist Tadele |
Debre Markos |
2016 |
250 |
Cross-sectional |
Blood donors |
Eskedar Awelachew |
Addis Ababa |
2016 |
360 |
Cross-sectional |
Blood donors |
T. Messele |
Addis Ababa |
1999 |
52 |
Cross-sectional |
Healthy adults |
Afework Kassu |
Aqaqi qaliti |
2001 |
218 |
Cross-sectional |
Factory workers |
Tewelde Tesfaye |
Mekele |
2015 |
2282 |
Cross-sectional |
Factory workers |
Wondemagegn Mulu |
Gojjam |
2017 |
481 |
Cross-sectional |
Community |
Aregawi Yalew |
Gonder |
2016 |
240 |
Cross-sectional |
Blood donors |
Lealem Gedefaw |
Jimma |
2018 |
883 |
community-based Cross-sectional |
Community |
Qualitative summary
From the total of 12 study included in the Meta analysis, all of them were cross-sectional study. Most of the studies conducted hematological and immunological parameters investigation by automated machine.
Meta-analysis outcome
According to data from eight included studies meta-analysis by random effect model showed that the estimated pooled mean of red blood cells is 5.29 x 10¹²/l (95% CI; 5.15-5.44 x 10¹²/l) in male and 4.77 x 10¹²/l (95% CI; 4.61-4.94 x 10¹²/l) in female (Table 2) (Figure 2). Test of heterogeneity showed that it is heterogeneous (Quantifying heterogeneity: t2 = 0.0437; I2 = 99%, P< 0.01) (Figure 3 and 4) (Table 3).
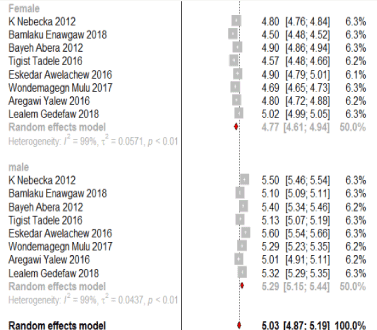
Figure 2. Mean of red blood cells in apparently health male and female in Ethiopia
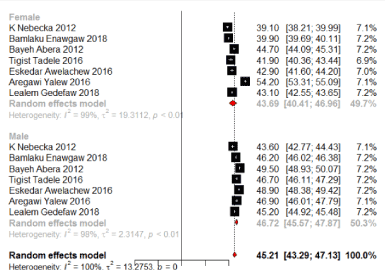
Figure 3. Mean of hematocrit in apparently health people in Ethiopia
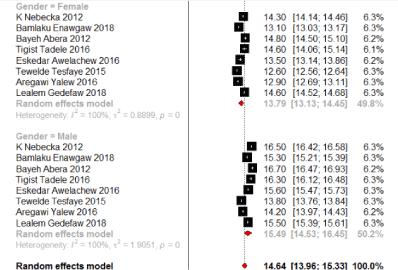
Figure 4. Mean of hemoglobin in apparently health people in Ethiopia
Table 2. The estimated pooled mean and 95% CI of Hematological and Immunological parameters among apparently healthy people in Ethiopia, 2019
Parameters |
Male |
Female |
Mean |
(95% CI) |
Mean |
(95% CI) |
RBCs (1012/l) |
5.29 |
5.25 – 5.44 |
4.77 |
4.61 - 4.96 |
WBCs (109/l) |
6.26 |
3.9 - 6.62 |
6.38 |
5.99 – 6.77 |
Hemoglobin (g/dl) |
15.49 |
14.53 -16.45 |
13.79 |
13.13 -14.45 |
Hematocrit (%) |
46.72 |
45.57 – 47.87 |
43.69 |
40.41 – 46.96 |
MCV (fl) |
90.65 |
85.74 – 95.55 |
90.96 |
85.01 – 96.91 |
MCH (pg) |
29.97 |
28.80 - 31.14 |
29.80 |
28.94 – 30.66 |
MCHC (g/dl) |
33.15 |
31.93 – 34.35 |
32.63 |
31.42 – 33.83 |
RDW |
13.17 |
12.13 – 14.21 |
13.21 |
12.40 – 14.03 |
Platelets (106/mm3) |
194.80 |
69.72 – 319.89 |
264.17 |
222.33 – 306.01 |
Neutrophil (109/l) |
3.52 |
3.27 - 3.77 |
3.64 |
3.24 – 4.04 |
Monocyte (109/l) |
0.42 |
0.30 – 0.54 |
0.40 |
0.23 - 0.56 |
Lymphocyte (109/l) |
1.96 |
1.78 – 2.14 |
2.0 |
1.77 – 2.23 |
CD4 |
734.94 |
674.41 – 795.46 |
839.42 |
750.46 – 928.37 |
CD8 |
679.09 |
603.21 – 754.97 |
620.02 |
574.38 – 665.66 |
CD3 |
1449 |
1234.27 – 1665.13 |
1463.96 |
1335.82 – 1592.10 |
Table 3. Influential analysis (Fixed effect model)
I^2 |
Mean |
95%-CI |
p-value |
tau^2 |
K Nebecka (2012) |
44.4442 |
[44.3374; 44.5511] |
13.6053 |
99.7% |
Bamlaku Enawgaw (2018) |
43.4609 |
[43.3291; 43.5928] |
17.3135 |
99.6% |
Bayeh Abera (2012) |
44.2502 |
[44.1424; 44.3580] |
12.7778 |
99.6% |
Tigist Tadele (2016) |
44.3560 |
[44.2483; 44.4637] |
13.7316 |
99.7% |
Eskedar Awelachew (2016) |
44.2374 |
[44.1292; 44.3457] |
12.9909 |
99.6% |
Aregawi Yalew (2016) |
44.3954 |
[44.2887; 44.5022] |
13.4608 |
99.7% |
Lealem Gedefaw (2018) |
44.3057 |
[44.1914; 44.4199] |
16.3622 |
99.7% |
K Nebecka (2012) |
44.5076 |
[44.4009; 44.6143] |
13.0406 |
99.6% |
Bamlaku Enawgaw (2018) |
46.0353 |
[45.9119; 46.1586] |
5.7873 |
98.9% |
Bayeh Abera (2012) |
44.4221 |
[44.3145; 44.5297] |
13.9281 |
99.7% |
Tigist Tadele (2016) |
44.4426 |
[44.3363; 44.5488] |
13.3383 |
99.7% |
Eskedar Awelachew (2016) |
44.4408 |
[44.3345; 44.5472] |
13.3980 |
99.7% |
Aregawi Yalew (2016) |
44.2915 |
[44.1848; 44.3983] |
11.7934 |
99.6% |
Lealem Gedefaw (2018) |
44.4814 |
[44.3734; 44.5894] |
13.9776 |
99.7% |
Pooled estimate |
44.4306 |
[44.3246; 44.5366] |
13.2753 |
99.6% |
The mean and reference interval of hematological and immunological parameters of apparently healthy people of Ethiopia is summarized in the Table 4 according to the sex of the person.
Table 4. Comparison between current review and Reference range currently used in Ethiopia
Parameters |
Mean of present review |
Mean reference [37] |
RBCs (1012/l) |
Male |
5.29 |
5.4 |
Female |
4.77 |
4.8 |
WBCs (109/l) |
Male |
6.26 |
7.2 |
Female |
6.38 |
Hemoglobin (g/dl) |
Male |
15.49 |
14.3 |
Female |
13.79 |
14.0 |
Hematocrit (%) |
Male |
46.72 |
46.0 |
Female |
43.39 |
42.0 |
MCV (fl) |
Male |
90.65 |
91 |
Female |
90.96 |
MCH (pg) |
Male |
29.97 |
31 |
Female |
29.80 |
MCHC (g/dl) |
Male |
33.15 |
34 |
Female |
32.63 |
RDW |
Male |
13.17 |
12.8 |
Female |
13.21 |
Platelets (106/mm3) |
Male |
185.80 |
280 |
Female |
264.17 |
Neutrophil (109/l) |
Male |
3.52 |
3.0 |
Female |
3.64 |
Monocyte (109/l) |
Male |
0.42 |
0.4 |
Female |
0.40 |
Lymphocyte (109/l) |
Male |
1.96 |
0.9 |
Female |
2.0 |
CD4 |
Male |
734.94 |
753 |
Female |
839.42 |
816 |
CD8 |
Male |
679.09 |
777 |
Female |
620.02 |
692 |
Risk of bias and sensitivity analysis
Subgroup analysis was conducted to see the possible cause of heterogeneity. The possible cause of heterogeneity probably be the altitude of the participants gender as shown on the figure above. Unfortunately, the specific cause of heterogeneity cannot be identified due to limited population characteristic are available.
The funnel plot helped us distinguish between publication bias and other causes of the asymmetry. We demonstrated no publication bias (t = -1.3505, df = 11, p-value = 0.1927). we have also conducted influence analysis of individual studies (Table 3).
The aim of the review was to estimate the mean and 95% confidence interval of hematological and immunological parameters in apparently healthy Ethiopian. In this review some hematological and immunological parameters showed significant difference from the guideline currently used in the country.
In Ethiopia the difference between highest mean hematocrit value and lowest mean hematocrit value was 5.7% [27,33]. In Ethiopia study conducted on commercial bank worker in Addis Ababa showed lowest mean of platelets among male participant [27].
The mean and 95% CI of hematological and immunological parameters varies depending age, gender, and altitude. In this review we demonstrated heterogeneity. Subgroup analysis was conducted to see the possible cause of heterogeneity by variable gender. Unfortunately the specific cause of heterogeneity cannot be identified. The unresolved heterogeneity could be due to merged report of hematological and immunological parameters for both participants of lowland and highland in some of included studies [35]. The possible cause of heterogeneity probably is the altitude of the participants, age of participant and other but we couldn’t able to get data on hematological and immunological parameters according to age category, and altitude of participants residence.
To explain the specific causes of heterogeneity, we did meta-regression and subgroup analyses on various variables including altitude, gender from which heterogeneity might come from. Other potential causes of heterogeneity may include age, sample size, and detection methods. Unfortunately, we did not analyze them, as there were not enough available data. By metabias computation we detected no publication bias (z = -0.98689, p-value = 0.3237).
When compared to national guideline (14.3g/dl) the present review showed higher mean of hemoglobin in male but have comparable mean hematocrit value both in male and female (Figure 4). On the other hand in this review mean hemoglobin concentration (MCH) and platelets counts both in male and female were lower than national guide line (31pg, 280 respectively). The comparable results of the present study and national reference range have been summarized in Table 4 [37].
However this review came up with pooled estimate of mean and 95% confidence interval of hematological and immunological parameters in apparently healthy people, we acknowledge few limitations of the present meta-analysis, which may affect the results. First of all however we conducted pooled mean for both with and without missing value, we reported the result of pooled mean and 95% CI of pooled mean without missing value.
The results of our meta-analysis showed high and/or low mean and 95% CI of hematological and immunological parameters in apparently healthy people when compared to RIs currently used in the Ethiopia.
Conflicts of interest
There are no conflicts of interests to declare.
Availability of data and materials
All the datasets generated and analyzed during the review are included in this article.
Author’s contribution
EA, KD and SA designed the study, extracted, critically reviewed and analyzed data and wrote the first draft of the manuscript, and approved the manuscript.
Funding source
This manuscript was prepared independently without any funding support.
Consent for publication
Not applicable.
Ethics approval and consent to participate
Not applicable.
None.
- Stockham SL, Scott MA (2008) Fundamentals of Veterinary Clinical Pathology. Blackwell Publishing, Hoboken. NJ pp. 53-675.
- WHO (2016) Consolidated Guidelines on the Use of Antiretroviral Drugs for Treating and Preventing HIV Infection: Recommendations for a Public Health Approach. World Health Organization p. 155
- Pekelharing JM (2015) Haematology reference intervals for established and novel parameters in healthy adults. Diagnostic Perspectives 1: 1-11.
- Haileamlak A, Muluneh AT, Alemseged F, Tessema F, Woldemichael K, et al. (2012) Hematoimmunological profile at gilgel gibe field research center, southwest Ethiopia. Ethiop J Health Sci 22: 39-50.
- Hoffmann RG (1971) Establishing quality control and normal ranges in the clinical laboratory. Exposition Press Inc p. 73.
- Rodak BF (2011) Hematology: Clinical Principles and Applications (4th Edn). Elsevier Saunders.
- Patel KV, Harris TB, Faulhaber M, Angleman SB, Connelly S, et al. (2007) Racial variation in the relationship of anemiawithmortality andmobility disability among older adults. Blood 109: 4663-4670.
- Horowitz GL (2008) Defining, establishing, and verifying reference intervals in the clinical laboratory: proposed guideline. CLSI.
- CLSI (2008) Defining, establishing, and verifying reference intervals in the clinical laboratory; approved guideline. (3rd Edn) Clinical and Laboratory Standards Institute.
- Solberg HE (2008) Establishment and use of reference values. In: Burtis CA, Ashwood ER, Bruns DE (Eds). Tietz Fundamentals of Clinical Chemistry (6th Edn), Philadelphia, PA.
- Friedberg RC1, Souers R, Wagar EA, Stankovic AK, Valenstein PN; College of American Pathologists (2007) The origin of reference intervals. Arch Pathol Lab Med 131: 348-357. [Crossref]
- Ritchie RF (2004) Selecting clinically relevant populations for reference intervals. Clin Chem Lab Med 42: 702-709.
- Eller LA (2008) Reference intervals in healthy adult Ugandan blood donors and their impact on conducting international vaccine trials. PLoS ONE 3: e3919.
- Embree J, Bwayo J, Nagelkerke N, Njenga S, Nyange P, et al. (2001) Lymphocyte subsets in human immunodeficiency virus type 1-infected and uninfected children in Nairobi. Pediatr Infect Dis J 20: 397-403.
- Adan A, Alizada G, Kiraz Y, Baran Y, Nalbant A, et al. (2016) Flow cytometry: Basic principles and applications. Crit Rev Biotechnol 8551: 1-14.
- Miri-Dashe T, Osawe S, Tokdung M, Daniel N, Choji RP, et al. (2014) Comprehensive reference ranges for hematology and clinical chemistry laboratory parameters derived from normal Nigerian adults. PLoS ONE 9: e93919.
- 17. I. M. O. Adetifa, et al. Haematological values from a Gambian cohort - Possible reference range for a West African population. International Journal of Laboratory Hematology 31: 615-622.
- O’Brien WA, Hartigan PM, Daar ES, Simberkoff MS, Hamilton JD, et al. (1997) Changes in plasma HIV RNA levels and CD4+ lymphocyte counts predict both response to antiretroviral therapy and therapeutic failure. Ann Intern Med 126: 939-945.
- Cengiz CPJ (2003) HIV and liver diseases: recent clinical advances. Clinics in Liver Disease 9: 647-66.
- Larissa Shamseer (2015) Preferred reporting items for systematic review and meta-analysis protocols (PRISMA-P): elaboration and explanation. BMJ 349: 7647.
- Armstrong R (2007) Guidelines for Systematic reviews of health promotion and public health interventions. Version 2. Melbourne University Australia.
- Thompson SG, Sharp SJ (1999) Explaining heterogeneity in meta-analysis: a comparison of methods. Stat Med 18: 2693-2708. [Crossref]
- The Joanna Briggs Institute (2014) Joanna Briggs Institute Reviewers’ Manual. Edition.
- Egger M, Davey Smith G, Schneider M, Minder C (1997) Bias in meta-analysis detected by a simple, graphical test. BMJ 315: 629-634. [Crossref]
- Kassu A, Tsegaye A, Petros B, Wolday D, Ermias Hailu, et al. (2001) Distribution of Lymphocyte Subsets in Healthy Human Immunodeficiency Virus-Negative Adult Ethiopians from Two Geographic Locales. Clin Diagn Lab Immunol 8: 1171-1176.
- Tsegaye A (1999) Immunohematological Reference Ranges for Adult Ethiopians. Clinical and diagnostic laboratory immunology pp: 410-414.
- Nebeck K, Gelaye B, Lemma S, Berhane Y, Bekele T, et al. (2012) Hematological Parameters and Metabolic Syndrome: Findings from an Occupational Cohort in Ethiopia. Diabetes Metab Syndr 6: 22-27.
- Eskedar Awelachew Eshete, Tewabech Zewde Weldemariam. Hematological and lipid profiles of blood donors at red cross center in addis ababa. Ethiop Med J 54: 1.
- Messele T, Abdulkadir M, Fontanet AL, Petros B, Hamann D, et al. (1999) Reduced naive and increased activated CD4 and CD8 cells in healthy adult Ethiopians compared with their Dutch counterparts. Clin Exp Immunol 115: 443-450.
- Yalew A, Terefe B, Alem M, Enawgaw B (2016) Hematological reference intervals determination in adults at Gondar university hospital, Northwest Ethiopia. BMC research notes 9: 483.
- Tigist T (2016) Hematological Reference Ranges for Apparently Healthy Blood Donors in Debre Markos, North West Ethiopia. Research square.
- Enawgaw B (2018) Haematological and immunological reference intervals for adult population in the state of Amhara, Ethiopia. Tropical Medicine and International Health 23: 765-773.
- Abera B (2018) Immunological and hematological reference values for apparently healthy HIV-negative adults in Bahir Dar Town, Ethiopia. Ethiop J Health Dev 26: 3.
- Gebremaeiam TT, Zelelow YB (2015) Hemoglobin cut-off value for apparently healthy adult population at Mekelle city, Northern Ethiopia. IJPSR 6: 11.
- Wondemagegn Mulu, et al. Haematological and CD4+ T cells referencen ranges in healthy adult populations in Gojjam zones in Amhara region, Ethiopia. PLoS ONE 12: e0181268.
- Bimerew LG, Demie T, Eskinder K, Getachew A, Bekele S, et al. (2018) Reference intervals for hematology test parameters from apparently healthy individuals in southwest Ethiopia. SAGE Open Medicine.
- Barbara J (2006) Bain MBBS, et al. Blood Cells: A Practical Guide.