We propose that Alzheimer’s disease (AD) progression is largely caused by excess reactive oxygen species (ROS) or free radicals created by iron dysregulation. An AD brain is struggling with damage control creating harmful tau tangles and amyloid plaques to deal with the dysregulated iron. We hypothesized that transgenic APP/PS1 (Amyloid precursor protein/ Presenilin-1) and Tau mice would exhibit higher levels of deposits in the brain which can be detected through MRI as well as decreased behavioral performance in radial arm maze tasks. We bred APP/PS1 transgenic mice overexpressing chimeric mouse/human APP-695 with mutations and human PSEN1 carrying the exon-9-deleted variant (PSEN1dE9), and Tau mice overexpressing all six isoforms of hyper-phosphorylated human MAPT (Microtubule associated protein Tau), which were compared with age controlled wild type mice. Mice received a diet of either regular or methionine rich chow as an oxidative stressor. Subgroups received a rescue treatment of either zinc, metformin or clioquinol chow. MRI (Magnetic Resonance Imaging) scans were performed using a Siemens 3 Tesla scanner. Behavioral data was collected using a radial arm maze (RAM) for 2 weeks at each point. Data collection time points were: 1 (baseline), 3, 6 and 9 months. Mean T2 TSE signals from scans on these mice revealed significant signal loss in bilateral hippocampi when compared by age. We also found a significant main effect of genotype and a trend toward significance for genotype and treatment interaction in the mean time mice spent in the RAM. Pairwise comparison showed a significant difference between the time male and female mice spent in the RAM. There was, however, no effect of signal loss or behavior deficit when comparing rescue treatments with or without oxidative insults. The decrease in signal and RAM performance is due to plaque increase and accompanying iron, which offers a possibility to refine the imaging techniques in pursuit of a noninvasive diagnostic biomarker.
Alzheimer’s disease, MRI, transgenic, radial arm maze, amyloid, tau, reactive oxygen species
Alzheimer’s disease (AD) is a progressive neurodegenerative disorder characterized by memory loss and progressive loss of cognitive functions that impede performance of daily activities. It is mostly seen in the elderly population and is the leading cause of dementia. The diagnostic hallmarks of AD are the presence of amyloid beta (Aβ) plaques, neurofibrillary tangles from phosphorylated tau proteins, neurodegeneration and synapse loss [1,2] seen in post mortem brain studies. Formation of such plaques and tangles precedes, up to a decade or more, any clinical symptoms [3,4]. This describes the necessity of sensitive biomarkers for AD that not only help in early diagnosis but also provide information regarding responses to potential treatments that impede disease progression [5-7]. With the number of AD patients increasing steadily each year, AD is becoming a larger financial burden on the world’s population, as well as a psychological and emotional strain on those who live with and take care of patients struck with the disease [8]. Advances in methods for treatment and diagnosis, such as Magnetic Resonance Imaging (MRI), are extremely important for the future of patients with AD; MRI in particular, has already become a widely used tool to study AD [9,10].
Currently, however, MRI is not a perfect tool for diagnosing AD, but it does allow visualization of neuroatrophy and other artifacts not normally observable until after autopsy [11-13]. Unfortunately, many of those artifacts are still not visible using MRI until the advanced stages of AD, and therefore too late for effective preventative care. At advanced stages of AD, increased MR signal dropout is seen localized in areas of Aβ plaque and tau tangle deposition, linking those pathologies to clusters of iron deposits [14]. Both of these proteins are found to have a strong affinity to iron [15-19], and since these iron deposits can be visualized using MRI we might be able to detect AD before it noticeably affects cognition.
Iron plays a very important role in our body as a reactive mineral utilized in many redox reactions required for cells and tissues survival [20]. Cells use this reactive molecule without suffering oxidative damage through tight regulation by various proteins and transcription factors [20,21]. If, however, this regulation is disrupted, available iron will tip the scales in favor of production of reactive oxygen species (ROS), which then increase oxidative stress causing internal damage to the cell [22].
As a reactionary defense mechanism to this oxidative damage, the cell will initiate several pathways including cleavage of the transmembrane protein APP creating the pathogenic Aβ plaques [23]. Aβ and neurofibrillary tangles are seen as the cause of AD. But, these proteins might be working to sequester free iron to limit the oxidative stress. The body recognizes the iron as the source of stress and is simply attempting to alleviate that stress the only way it is programmed how to. This is evidenced by the handful of Iron Response Elements (IRE) that react to increased levels of iron [24]. With iron as the common thread between the developing Aβ plaques and NFTs (Neurofibrillary tangles), oxidative stress and iron dysregulation become even more culpable for the unexplained cases of AD, forming what we call the iron hypothesis.
Central to this iron hypothesis and the dysregulation of iron pathways is homocysteine (HCY). Several diseases, including AD, have been linked to elevated levels of HCY [25-28]. HCY is an amino acid found within the human body, created by the metabolism of the essential amino acid methionine. Methionine utilizes a circular metabolic pathway between itself and several other products, including HCY [29]. This pathway is regulated by diet, as several key vitamins and minerals as well as diet regulated hormones affect methionine’s metabolism, namely: iron, insulin, folate and vitamin B12 [25,30,31]. When levels of HCY are increased it contributes to the dysregulation of iron, and its own creation, by mobilizing stored iron from the metalloprotein, ferritin [32,33]. In response to the elevated levels of HCY, ROS and iron, the body reacts and produces the telltale pathologies of AD, attempting to curtail the oxidative stress and damage on the cell.
We hypothesize that dysregulation of iron storage stimulates oxidative damage to neurons, which in turn promotes amyloid beta, and neurofibrillary tangles deposits. Both of these proteins are found to have strong affinity iron [15-18]; there are studies showing strong association of iron with amyloid beta [19], and with neurofibrillary tangles [34, 35]. Since, these iron deposits can be visualized in magnetic resonance platform; we propose an increase in plaques and tangles in transgenic mice vs wild types that would be seen in MRI as well as mouse behavioral tasks.
To study the possibility of detection of these pathological changes in mice brains, we investigated using APP/PS1 and MAPT transgenic mice together with age matched wild type control mice using two-dimensional T2 weighted turbo-spin echo sequence using a 3T MRI scanner as well as behavioral tasks in an 8-arm radial arm maze (RAM). Double transgenic APP/PS1 mice express both human Presenilin 1 and a chimeric amyloid precursor protein (APP). In these mice, amyloid plaques start depositing by six months of age [36]. MAPT mice are homozygous for the targeted allele and hemizygous for the transgene; they express all six isoforms of human MAPT. The hyper-phosphorylated MAPT can be detected in the brain by three months of age [37]. These mice, therefore, were ideal for our experiment to scan and behaviorally test them at one (baseline), three, six and nine months of their age.
Animals
For this IACUC approved study, mice were purchased from Jackson Laboratories and then bred to produce our colonies. There were a total of 70 mice (30F, 40M) tested in this study. Table 1 shows that all 70 were tested in the radial arm maze, while 54 of those 70 were used in both behavior and the MRI scans.
Table 1. Genotype and Gender by Experiment
Experiment |
WT |
WT Total |
Tau |
Tau Total |
AB |
AB Total |
RAM |
4F |
21M |
25 |
10F |
8M |
18 |
16F |
11M |
27 |
MRI |
4F |
14M |
18 |
10F |
8M |
18 |
7F |
11M |
18 |
There were 18 mice [B6.Cg-Mapttm1(EGFP)Klt Tg(MAPT)8cPdav/J] (10F, 8M) homozygous for MAPT allele and hemizygous for human MAPT transgene, 27 mice APP/PS1 [B6.Cg-Tg (APP695) 3Dbo Tg(PSEN1dE9)S9Dbo/Mmjax] (16F, 11M) double transgenic for human APP and human PS1 and 25 mice [C57BL/6J] (4F, 14M) used as age matched wild type controls. Genotyping was done on these mice to confirm the presence of transgenes. Of the 70 mice run in the maze 68 had baseline measurements, 61 had 3-month measurements, 20 had 6-month measurements, and 10 had 9-month measurements.
Expression of proteins
Western blot analysis performed on 17 APP/PS1, 17 Tau and 18 WT mice for effect of amyloid and tau proteins production. APP/PS1 and MAPT [F (4, 96) = 8.254, p <0.001]. APP/PS1 [F (2, 49) = 14.945, p <0.001] and MAPT [F (2, 49) = 6.263, p =0.004] mice showed significant production of amyloid and tau proteins respectively as compared to other strain types (Figure 1). There was no effect of production of proteins with age.
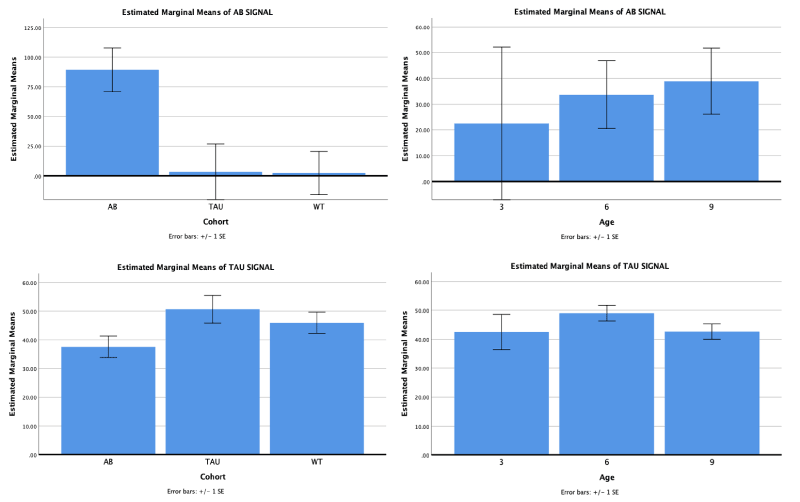
Figure 1. Expression of amyloid beta protein is significantly greater in APP/PS1 mice as compared to MAPT and WT. Tau protein expression was significantly higher in MAPT mice as compared to APP/PS1 but not WT. However, expression of either protein were not significantly different at various age
Diet
Diets outlined on Table 2 were given to the mice ad libitum as follows. All mice received regular chow purchased from Harlan Teklad (TD 8604) until one month of age. Regular chow contained 0.4% of Methionine and 80 mg/kg of zinc. They were however, devoid of Metformin and Clioquinol. Methionine rich diet (10g/kg) purchased from Harlan Teklad (TD 150154) was introduced to half of the mice for a strain type, while the other half continued on the same regular diet. At three months, one mouse per strain from each diet type was sacrificed and tissues harvested for experiments. The remaining mice in each strain from each diet type were further divided into four groups: three groups receiving additional rescue treatment with three drugs (Metformin, Zinc and Clioquinol) and a remaining group continued on the same diet. Mice were given food ad libitum until RAM tasks were started at which point food was restricted to 3-4 hours a day beginning at approximately 6 pm Monday and repeated each day through Friday. Feeding restrictions ensured that the mice would search the maze for food. The mice had ad libitum access to food Friday night through Sunday night since no behavioral testing was done over the weekends. Mice were weighed at the beginning and end of each week during the testing period to verify they maintained a healthy body weight. If mice lost more than 15% of their body weight or seemed lethargic, they were allotted additional time to feed. Only a few mice needed extra time to feed, which only occurred within the first two weeks of RAM testing.
Table 2. Treatment mounts and Treatment groups
|
Treatments |
Concentration (per g of chow) |
Dosage |
Methionine |
10 mg/g |
1500 mg/kg |
Metformin |
0.66 mg/g |
100 mg/kg |
Clioquinol |
0.20 mg/g |
30 mg/kg |
Zinc |
1.33 mg/g |
200 mg/kg |
|
|
|
Group # |
- |
Stress |
Treatment |
1 |
- |
No Stress |
No Treatment |
2 |
- |
Methionine |
No Treatment |
3 |
- |
No Stress |
Metformin |
4 |
- |
No Stress |
Clioquinol |
5 |
- |
No Stress |
Zinc |
6 |
- |
Methionine |
Metformin |
7 |
- |
Methionine |
Clioquinol |
8 |
- |
Methionine |
Zinc |
Anesthesia
Mice were placed in a chamber connected with a constant flow of 3-4% isoflurane mixed with oxygen to induce anesthesia. When the mice were sufficiently anesthetized, they were quickly transferred and placed in a prone position on a specially designed table with a custom nosecone attached to a delivery system that supplied a regular flow of isoflurane mixed with oxygen. During maintenance of anesthesia, the flow was adjusted to 1L/min and concentration of isoflurane to 1.5%. This was delivered with an isoflurane vaporizer/ anesthesia machine (Veterinary Anesthesia Systems, INC.) equipped with Pureline® oxygen concentrator. Eyes were protected with an ophthalmic ointment to prevent any corneal damage. Post scanning, mice were placed in a flat bed and were continuously monitored until they could normally access food and water.
MRI scanning
The structure scans used a two-dimensional T2 weighted turbo-spin echo sequence. The sequence was implemented on a 3T Siemens whole-body scanner (Siemens Medical Systems, Erlangen, Germany) with a custom-made 4-turn Transmit/Receive (TR) solenoid radio frequency mouse coil. The FOV of the scan was 87mm (readout) x 24.5mm (phase) x 0.9mm (slice) and the acquisition matrix was 320 (readout) x 90 (phase encode) and 42 in slices direction (12 slices were used for oversample) which yielded a voxel size equal to 0.27 x 0.27 x 0.9mm. Due to the small voxel size, 16 averages were employed in pursuit of a better signal to noise ratios (SNR), which increased the total acquisition time to 23 minutes. The TR and TE were 8000ms and 115ms respectively, and flip angle was 150 degrees. Other acquisition parameters were a turbo factor of 12, a readout bandwidth of 340 Hz/pixel with a fast mode RF pulse selected and a slice distance of 0.45mm.
Estimation of signal intensities
The OsiriX software platform was used to calculate the signal intensities. An area of 2.001 mm2 (W: 1.694 mm H: 1.504 mm P: 5.0 mm) was chosen over bilateral hippocampi and used as our region of interest (ROI) (Figure 2). The maximum signal intensities from ROI were normalized with the intensities from the ipsilateral eye, which was used as an internal control. The average mean values were analyzed on SPSS software.
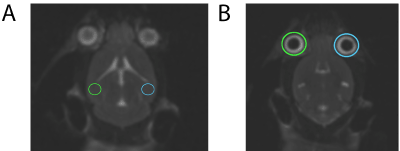
Figure 2. Measurement of T2 signal intensities. A) ROI with specific dimensions were chosen over hippocampi (bilateral) B) Intensity values from A were normalized to values obtained from ipsilateral eyes
Behavior
Mouse behavior was tested using an 8 arm Radial Arm Maze (RAM). Our protocol was designed similarly to Hodges radial arm maze protocol [38]. The radial arm maze, pictured in Figure 3, was constructed out of 7 mm thick opaque, white, plastic. The dimensions of the maze were a 27 inch (685.8 mm) diameter, 3.5 inch (88.9 mm) arm width, 8 inch (165.1 mm) arm height, 9 inch (228.6 mm) arm length, and 1 inch (25.4 mm) hole diameter at the end of each arm for food baiting. The end of each arm had a unique symbol as a visual que for the mouse. The maze was surrounded by a curtain to reduce spatial cues in the room and the varying undergraduate research associates positions or number. Mice were run in the maze at the testing periods of 1(baseline), 3, 6 and 9 months of age. Each testing period lasted for 2 weeks (10 weekday’s total) and consisted of 10 trials a day. Each trial was run for 5 minutes (300 seconds) or until the mouse discovered the baited arm. A specific arm was baited for each mouse until they reached completion criterion, which we determined to be entering the baited arm on the first try, 3 trials in succession. After completion criterion the mouse’s baited arm would switch to a reversal arm, and testing continued until reaching completion criterion again. This was repeated for the duration of the testing periods.

Figure 3. Radial Arm Maze Set Up. 8 Arms each with a unique symbol at the end. A hole at the end contains the bait
Behavior analysis
The videos were analyzed using ANY-maze Behavioral Tracking Software (Stoelting Co.; Wood Dale, IL; version 4.99m). We recorded time spent in the maze, distance run during a trial, and number of errors made, based on the number of times the mouse entered an incorrect (not baited) arm. There was no statistical significance in the distance run by the mice. Statistics on those values were calculated using SPSS by performing a multivariate ANOVA and correcting for multiple comparisons using a Bonferroni correction.
MRI signal intensity
Eighteen APP/PS1 mice, 18 Tau, and 18 WT mice were imaged and analyzed separately for the effect of time on mean T2 TSE signal. APP/PS1 [F (3, 21) =5.410, p=0.006] and Tau [F (3, 21) =11.861, p<0.001], but not WT [F (3, 21) =0.705, p=0.560] mice showed a significant signal decline with age in the left hippocampus. Likewise, APP/PS1 [F (3, 21) =4.720, p=0.011] and Tau [F (3, 21) =8.384, p=0.001], but not WT [F (3, 21) =0.493, p=0.691] mice showed a significant signal decline with age in the right hippocampus. There was no effect of oxidative insult or diet rescue on T2 TSE signal. Expected accumulation of the pathological proteins, beta-amyloid and tau, in the hippocampus of the respective APP/PS1 and Tau transgenic mice appeared to result in a measurable T2 signal decay compared with that of WT mice. However, the oxidative stress and rescue treatments did not affect the outcome. Future studies include histological and Western blot confirmation.
Time in RAM
Each mouse was placed in the RAM and given a total of 5 minutes (300 seconds) to explore the different arms and discover the hidden treat in the baited arm. If the mouse found the baited arm the trial was ended immediately. We saw a statistically significant main effect of genotype [F (2,25) = 13.505, P = 0.000] and a trend towards significance for genotype and treatment interaction [F (11,23) = 1.900, P = 0.094]. Post hoc analysis of the genotypes showed that WT and tau had a mean difference of the time spent in the maze of 34.225 [+/- 9.607: P = 0.003] and surprisingly APP and tau had a mean time difference of 50.167 [+/- 8.913; P = 0.000]. (Figure 4-A) Female mice spent a mean time of 21.745 seconds [+/-6.726: P = 0.002] longer in the maze then the males in the study. (Figure 4-C)
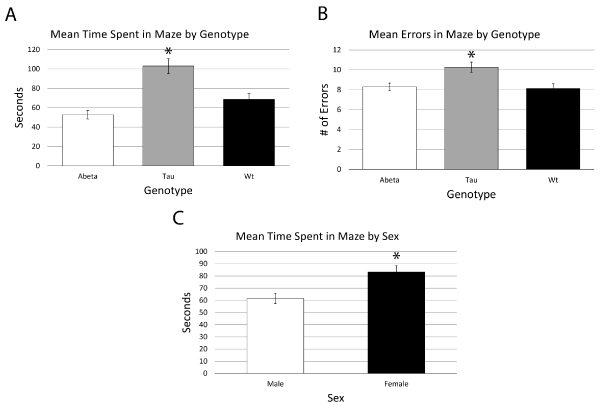
Figure 4. A) Mean time spent in the maze by genotype for mice. B) Mean Errors in maze by genotype for mice. C) Mean time spent in the maze by sex
Errors in RAM
An error was calculated each time that a mouse entered an incorrect (unbaited) arm during the duration of each of a mouse’s trials. There was a trend towards significance for genotype in number of errors made [F (2,10) = 3.377, P = 0.074]. Post hoc analysis of the genotypes showed that WT and tau had a mean difference of the number of errors of 2.144 (+/- 6.95: P = 0.015) and again surprisingly APP and tau had a mean error difference of 1.973 [+/-0.635: P = 0.024]. (Figure 4-B) Like what was seen with mean time, female mice had a trend toward significance in mean errors with a mean difference of 1.012 (+/-0.512: P = 0.064).
MRI signal intensity
While there have been studies showing evidence of plaques in human brain tissues using a 7.1 T (300 MHz) magnet [39], and in mice models [37,40]; the usefulness of MRI in diagnosis and in evaluation of AD in humans is still limited. We demonstrated a T2 signal decrease in bilateral hippocampus of human transgenic mice for AD, and believe that this is due to accumulation of iron in the lesions associated with disease: amyloid beta plaques and neurofibrillary tangles. Presence of iron contributes T2 signal loss due to field inhomogeneity [41-43] which alters the brain water content [44]. Figure 5 and 6 show the average signal intensities and Figure 7 shows estimated marginal means measured on APP/PS1, MAPT and WT mice over one, three, six and nine months. These data show a significant drop in the mean T2 signals among transgenic mice to be highest between one and three months of age suggesting early pathology. These mice were modeled to produce pathological lesion by three to six months, but with oxidative stress, they began early. With oxidative stress treatment started at one month, neurons robustly tried to manage neuronal damage by sequestering free iron. This overwhelming process of sequestering iron is reflected as loss of signals in hippocampus, where we expect these pathological changes to happen in abundance. By three months, when rescue treatments were started, much of neuronal damage has already happened and was likely irreversible. Signals measured at and after three months did not have significant differences. This corresponds to ineffectiveness of rescue measures taken after irreversible damage that had already happened. Since, WT do not produce any plaques or tangles, they effectively managed oxidative insult by homocysteine, which was reflected as no significant changes in their T2 signals.
Axial 3.0T T2 weighted images, however, did not show any observable differences, between strains 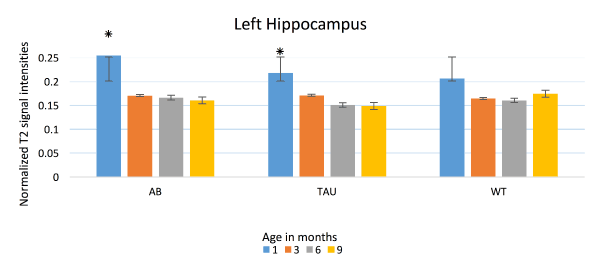
Figure 5. T2 signal intensities: Left Hippocampus. Mean T2 signal intensities (Y axis) from the left hippocampus, compared between APP/PS1 (AB), MAPT (Tau) and WT at one, three, six and nine months. Significant signal decline seen in AB and Tau between one and three months. WT does not show any significant loss in signal intensities
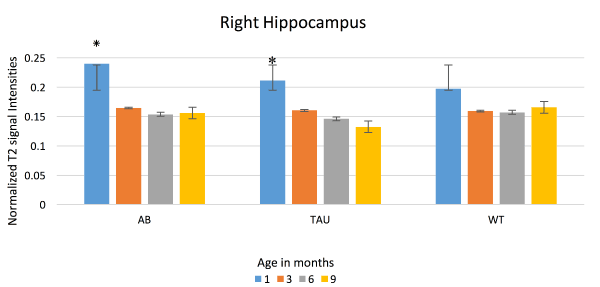
Figure 6. T2 signal intensities: Right Hippocampus. Mean T2 signal intensities (Y axis) from the right hippocampus, compared between APP/PS1 (AB), MAPT (Tau) and WT at one, three, six and nine months. Significant signal decline seen in AB and Tau between one and three months. WT does not show any significant loss in signal intensities
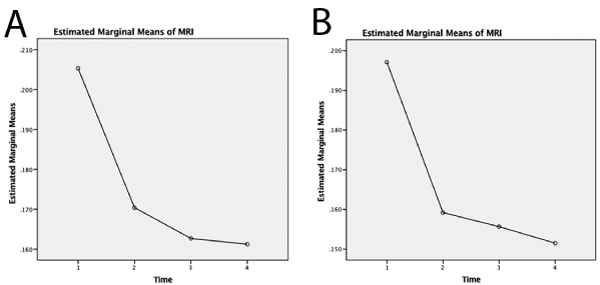
Figure 7. Estimated marginal means of MRI on bilateral hippocampus against time (1= one month, 2=three month, 3=six month and 4=nine month). Both left (A) and right (B) hippocampi show significant decrease in means between one and three months
at different ages, with or without treatments. Iron deposits in various parts of brain have been successfully studied using T2 weighted MRI [43,45]. Hallgren and Sourander have demonstrated, MRI sensitivity to iron quantity in different brain regions, corresponding to qualitative MRI observation [42]. The amount of iron present in plaques of a mice brain is too small to be sensitive enough to be observed in an image. Stronger magnetic fields have better sensitivity for observing small quantities of iron, because T2 signal decrease which is related to the iron contribution is linearly dependent on magnetic field [42]. Higher SNR offers better image quality with contrast features, but this comes with longer acquisition time; which makes it much more difficult to scan humans, and in many cases, animals as well. The limitation of our imaging techniques to visualize iron on T2 weighted images being translated to human studies is therefore, time. However, despite that limitation our study did show a correlation between T2 weighted MRI signal and neuropathological changes in mice model for AD, especially at early age.
Behavior
One of the first evidences of neuropathological changes that patients and the family members of those afflicted with AD notice is altered behavior; for this reason behavior and memory have become a widely tested measure in the many models of AD [46]. We observed this same behavioral degeneration in our tau cohorts regardless of whether they were receiving the rescue treatment or not, but surprisingly the APP mice performed just as well as the WT mice. Aβ plaques have long been the culprit for the loss of memory and decrease in cognition, but recently amyloid has been shown to have varying effects on the memory and cognition in both humans and animal models [47]. The variation may come from differing plaque types, solubility of the Aβ peptides, and location of the deposition in the brain [48,49]. Rogalski et. al. even examined 10 “SuperAgers”, who they defined as people over the age of 90 who test at a cognitive level of an average person age 50-60. Upon autopsy, up to half of these “SuperAgers” had moderate to high densities of neuritic Aβ plaques, yet had above average cognitive performance [50]. Another study using APP/PS1 transgenic mice found that treatment with estrogen improved spatial learning tasks in both the T-maze and the RAM, while not affecting the Aβ accumulation and plaque formation [51]. Our lack of difference in memory tasks might be attributed to these same variations in the Aβ peptides and plaques.
Variation of AD between sex has also become a heavily debated subject between dementia researchers. While most sources would state that there is roughly a 3:2 disparity between women and men with AD, some sources say that the difference only appears in the higher age groups of AD patients [52-54] When looking specifically at visuospatial memory tasks, men routinely perform better than women with or without AD [55]. Examining mouse studies there is hardly a consensus about the performance of transgenic and non-transgenic mice, with evidence of either gender outperforming the other, or having equal results [56-58]. We add our results to the handful of mouse models and the human studies that show decreased female performance compared to males. The reason for this difference is less clear as we showed no significant difference of T2 signal decrease between the mice based on sex, despite the overall levels for both sexes of transgenic mice being decreased due to increased plaque deposition.
A caveat to these results is that there were reduced numbers of mice in each of the cohorts which reduces the statistical power of the experiment. With 2 oxidative treatments, 3 rescue treatments and 3 time points, our cohorts were left with only 1 or 2 mice each. In the future we hope to repeat the experiment and focus in on select cohorts thereby increasing the number of mice per group and hopefully the power as well. We also plan to continue the study further by examining the deposition of the Aβ proteins and plaques and tau tangles, among other proteins, through histology, western blot and NMR.
The model we used shows neurodegeneration in the hippocampus of transgenic mice due to plaque and tangle accumulation and iron deposit. This was evidenced by the signal decrease seen in the MRI images of both the APP/PS1 and Tau transgenic mice. The behavior of the tau mice was also evidenced this conclusion when compared to WT mice. Female mice show the same behavioral degeneration compared to males. While the diets failed to impact either the decreased signal seen in the MRI scans or the behavioral deficits, it is possible that is due to lack of numbers. In the future, in addition to completing the histological and western blot analysis we will focus on improving the numbers used in each cohort of the study.
The authors wish to thank the following funding sources: NIH/NIA 1 R21 AG037843; Brigham Young University, College of Life Sciences, Mentoring Environment Grant; Brigham Young University, School of Family Life, Gerontology Program; Brigham Young University, Magnetic Resonance Imaging Research Facility Seed Grant; Dr. Sarah M. McGinty Neuroscience Graduate Student Research Fellowship; Neurodar, LLC; Limitless Worldwide, LLC.
- Katzman R (1986) Alzheimer's disease. N Engl J Med 314: 964-973. [Crossref]
- Coleman P, Federoff H, Kurlan R (2004) A focus on the synapse for neuroprotection in Alzheimer disease and other dementias. Neurology 63: 1155-1162.
- Morris JC, Storandt M, McKeel DW, Rubin EH, Price JL, et al. (1996) Cerebral amyloid deposition and diffuse plaques in``normal''aging: Evidence for presymptomatic and very mild Alzheimer's disease. Neurology 46: 707-719.
- Haroutunian V, Perl DP, Purohit DP, Marin D, Khan K, et al. (1998) Regional distribution of neuritic plaques in the nondemented elderly and subjects with very mild Alzheimer disease. Arch Neurol 55: 1185-1191.
- Knoll J (1983) Deprenyl (selegiline): the history of its development and pharmacological action. Acta Neurol Scand 68: 57-80.
- Anderson DK, Waters TR, Means ED (1988) Pretreatment with alpha tocopherol enhances neurologic recovery after experimental spinal cord compression injury. J Neurotrauma 5: 61-7.
- Growdon JH (1999) Biomarkers of Alzheimer disease. Arch Neurol 56: 281-283. [Crossref]
- Karlawish J, Jack CR Jr, Rocca WA, Snyder HM, Carrillo MC (2017) Alzheimer's disease: The next frontier-Special Report 2017. Alzheimers Dement 13: 374-380. [Crossref]
- de Leon MJ, Golomb J, George AE, Convit A, Tarshish CY, et al. (1993) The radiologic prediction of Alzheimer disease: the atrophic hippocampal formation. AJNR Am J Neuroradiol 14: 897-906.
- de Leon M, Bobinski M, Convit A, Wolf O, Insausti R (2001) Usefulness of MRI measures of entorhinal cortex versus hippocampus in AD. Neurology 56: 820-823.
- Frings L, Yew B, Flanagan E, Lam BY, Hull M, et al. (2014) Longitudinal grey and white matter changes in frontotemporal dementia and Alzheimer’s disease. PloS one 9: e90814.
- Johnson KA, Fox NC, Sperling RA, Klunk WE (2012) Brain imaging in Alzheimer disease. Cold Spring Harbor perspectives in medicine 2: a006213.
- Vemuri P, Jack CR Jr (2010) Role of structural MRI in Alzheimer's disease. Alzheimers Res Ther 2: 23. [Crossref]
- Meadowcroft MD, Peters DG, Dewal RP, Connor JR, Yang QX (2015) The effect of iron in MRI and transverse relaxation of amyloid-beta plaques in Alzheimer's disease. NMR Biomed 28: 297-305. [Crossref]
- Wan L, Nie G, Zhang J, Luo Y, Zhang P, et al. (2011) β-Amyloid peptide increases levels of iron content and oxidative stress in human cell and Caenorhabditis elegans models of Alzheimer disease. Free Radic Biol Med 50: 122-129.
- Zheng W, Xin N, Chi ZH, Zhao BL, Zhang J, et al. (2009) Divalent metal transporter 1 is involved in amyloid precursor protein processing and Aβ generation. FASEB J 23: 4207-4217.
- Bouras C, Giannakopoulos P, Good PF, Hsu A, Hof PR, et al. (1997) A laser microprobe mass analysis of brain aluminum and iron in dementia pugilistica: comparison with Alzheimer's disease. Eur Neurol 38: 53-58.
- LeVine SM (1997) Iron deposits in multiple sclerosis and Alzheimer's disease brains. Brain research 760: 298-303.
- Meadowcroft MD, Connor JR, Smith MB, Yang QX (2009) MRI and histological analysis of beta‐amyloid plaques in both human Alzheimer's disease and APP/PS1 transgenic mice. J Magn Reson Imaging 29: 997-1007.
- Wang J, Pantopoulos K (2011) Regulation of cellular iron metabolism. Biochem J 434: 365-381. [Crossref]
- Ganz T, Nemeth E (2012) Hepcidin and iron homeostasis. Biochim Biophys Acta 1823: 1434-1443. [Crossref]
- Morris G, Berk M, Carvalho AF, Maes M, Walker AJ, et al. (2018) Why should neuroscientists worry about iron? The emerging role of ferroptosis in the pathophysiology of neuroprogressive diseases. Behav Brain Res 341: 154-175.
- Guo LY, Alekseev O, Li Y, Song Y, Dunaief JL (2014) Iron increases APP translation and amyloid-beta production in the retina. Exp Eye Res 129: 31-37. [Crossref]
- Huang XD, Moir RD, Tanzi RE, Bush AI, Rogers JT (2004) Redox-active metals, oxidative stress, and Alzheimer's disease pathology. Redox-Active Metals in Neurological Disorders 1012: 153-163.
- Tessari P, Coracina A, Kiwanuka E, Vedovato M, Vettore M, et al. (2005) Effects of insulin on methionine and homocysteine kinetics in type 2 diabetes with nephropathy. Diabetes 54: 2968-2976.
- Sullivan JL (2006) Is homocysteine an iron-dependent cardiovascular risk factor? Kidney Int 69: 642-644. [Crossref]
- Miwa K, Tanaka M, Okazaki S, Yagita Y, Sakaguchi M, et al. (2016) Increased total homocysteine levels predict the risk of incident dementia independent of cerebral small-vessel diseases and vascular risk factors. J Alzheimers Dis 49: 503-513.
- de Farias CC, Maes M, Bonifacio KL, Matsumoto AK, Bortolasci CC, et al. Parkinson's Disease is Accompanied by Intertwined Alterations in Iron Metabolism and Activated Immune-inflammatory and Oxidative Stress Pathways. CNS Neurol Disord Drug Targets 16: 484-491.
- Baggott JE, Tamura T (2007) Iron-dependent formation of homocysteine from methionine and other thioethers. Eur J Clin Nutr 61: 1359-1363. [Crossref]
- Shea TB, Rogers E (2014) Lifetime requirement of the methionine cycle for neuronal development and maintenance. Curr Opin Psychiatry 27: 138-142.
- Ratnam S, Maclean KN, Jacobs RL, Brosnan ME, Kraus JP, et al. (2002) ormonal regulation of cystathionine beta-synthase expression in liver. J Biol Chem 277: 42912-42918.
- Dwyer BE, Raina AK, Perry G, Smith MA (2004) Homocysteine and Alzheimer's disease: a modifiable risk? Free Radic Biol Med 36: 1471-1475. [Crossref]
- Wagner KR, Hua Y, Broderick JP, Nishimura RN, Lu SY, et al. (2000) Tin-mesoporphyrin, a potent heme oxygenase inhibitor, for treatment of intracerebral hemorrhage: in vivo and in vitro studies. Cell Mol Biol (Noisy-le-grand) 46: 597-608.
- Good PF, Perl DP, Bierer LM, Schmeidler J (1992) Selective accumulation of aluminum and iron in the neurofibrillary tangles of Alzheimer's disease: a laser microprobe (LAMMA) study. Ann Neurol 31: 286-292.
- Benveniste H, Einstein G, Kim KR, Hulette C, Johnson GA (1999) Detection of neuritic plaques in Alzheimer's disease by magnetic resonance microscopy. Proc Natl Acad Sci USA 96: 14079-14084.
- Savonenko A, Xu GM, Melnikova T, Morton JL, Gonzales V, et al. (2005) Episodic-like memory deficits in the APPswe/PS1dE9 mouse model of Alzheimer's disease: relationships to β-amyloid deposition and neurotransmitter abnormalities. Neurobiol Dis 18: 602-617.
- Andorfer C, Kress Y, Espinoza M, de Silva R, Tucker KL, et al. (2003) Hyperphosphorylation and aggregation of tau in mice expressing normal human tau isoforms. J Neurochem 86: 582-590. [Crossref]
- Hodges H (1996) Maze procedures: the radial-arm and water maze compared. Brain Res Cogn Brain Res 3: 167-181. [Crossref]
- Benveniste H, Einstein G, Kim KR, Hulette C, Johnson GA (1999) Detection of neuritic plaques in Alzheimer’s disease by magnetic resonance microscopy. Proc Natl Acad Sci USA 96: 14079-14084.
- Savonenko A, Xu GM, Melnikova T, Morton JL, Gonzales V, et al. (2005) Episodic-like memory deficits in the APPswe/PS1dE9 mouse model of Alzheimer's disease: relationships to β-amyloid deposition and neurotransmitter abnormalities. Neurobiol Dis 18: 602-617.
- Bizzi A, Brooks RA, Brunetti A, Hill JM, Alger JR, et al. (1990) Role of iron and ferritin in MR imaging of the brain: a study in primates at different field strengths. Radiology 177: 59-65.
- Vymazal J, Brooks RA, Patronas N, Hajek M, Bulte JW, et al. (1995) Magnetic resonance imaging of brain iron in health and disease. J Neurol Sci 134: 19-26.
- Vymazal J, Brooks RA, Zak O, Mcrill C, Shen C, et al. (1992) T1 and T2 of ferritin at different field strengths: effect on MRI. Magnetic resonance in medicine 27: 368-374.
- Miot E, Hoffschir D, Poncy JL, Masse R, Pape AL, et al. (1995) Magnetic resonance imaging in vivo monitoring of T2 relaxation time: quantitative assessment of primate brain maturation. J Med Primatol 24: 87-93.
- HALLGREN B, SOURANDER P (1958) The effect of age on the non-haemin iron in the human brain. J Neurochem 3: 41-51. [Crossref]
- Puzzo D, Lee L, Palmeri A, Calabrese G, Arancio O (2014) Behavioral assays with mouse models of Alzheimer's disease: practical considerations and guidelines. Biochem Pharmacol 88: 450-467.
- Van Bergen JM, Li X, Hua J, Schreiner SJ, Steininger SC, et al. (2016) Colocalization of cerebral iron with amyloid beta in mild cognitive impairment. Sci Rep 6: 35514. [Crossref]
- Malek-Ahmadi M, Perez SE, Chen K, Mufson EJ (2016) Neuritic and diffuse plaque associations with memory in non-cognitively impaired elderly. J Alzheimers Dis 53: 1641-1652.
- Van Helmond Z, Miners JS, Kehoe PG, Love S (2010) Oligomeric Aß in Alzheimer's Disease: Relationship to Plaque and Tangle Pathology, APOE Genotype and Cerebral Amyloid Angiopathy. Brain Pathology 20: 468-480.
- Rogalski E, Gefen T, Mao Q, Connelly M, Weintraub S, et al. (2019) Cognitive trajectories and spectrum of neuropathology in S uper A gers: The first 10 cases. Hippocampus 29: 458-467. [Crossref]
- Heikkinen T, Kalesnykas G, Rissanen A, Tapiola T, Iivonen S, et al. (2004) Estrogen treatment improves spatial learning in APP+ PS1 mice but does not affect beta amyloid accumulation and plaque formation. Exp Neurol 187: 105-117.
- Mazure CM, Swendsen J (2016) Sex differences in Alzheimer's disease and other dementias. Lancet Neurol 15: 451-452. [Crossref]
- Ruitenberg A, Ott A, van Swieten JC, Hofman A, Breteler MM (2001) Incidence of dementia: does gender make a difference? Neurobiol Aging 22: 575-580. [Crossref]
- Alzheimer's disease facts and figures. Alzheimers Dement 2016; 12: 459-509.
- Millet X, Raoux N, Le Carret N, Bouisson J, Dartigues JF, et al. (2009) Gender-related differences in visuospatial memory persist in Alzheimer's disease. Arch Clin Neuropsychol 24: 783-789.
- Stevens LM, Brown RE (2015) Reference and working memory deficits in the 3xTg-AD mouse between 2 and 15-months of age: a cross-sectional study. Behav Brain Res 278: 496-505.
- Giménez-Llort L, García Y, Buccieri K, Revilla S, Sunol C, et al. (2010) Gender-specific neuroimmunoendocrine response to treadmill exercise in 3xTg-AD mice. Int J Alzheimers Dis 2010: 128354.
- Clinton LK, Billings LM, Green KN, Caccamo A, Ngo J, et al. (2007) Age-dependent sexual dimorphism in cognition and stress response in the 3xTg-AD mice. Neurobiol Dis 28: 76-82.