Elevated intra-ocular pressure (IOP) and mean IOP are considered the main risk factors for the development and progression of glaucoma. However, some patients still progress with IOP apparently in the target range. This observation has been explained on the basis that other non-IOP dependent risk factors are contributing to the glaucoma pathogenesis in these individuals.
An alternative explanation is that progression occurs at least in - part due to high IOP peaks not detected during routine eye examinations. Several studies have demonstrated that peak IOP may be a better predictor of glaucoma progression. IOP peak assessment has been used recently to verify if the peak pressure of a given patient is in target range, to evaluate glaucoma suspect risk, the efficacy of hypotensive drugs and to detect early loss of IOP control. These are important aims to be addressed in glaucoma management. Several methods have been described to assess IOP peaks. The costs and labor involved in this make the determination of the 24-hour IOP or contact lens-sensor difficult if not impossible in all patients. Recently the water drinking test (WDT) has been used as a surrogate marker for outflow reserve to detect IOP instability and to estimate IOP peak pressure.
Peak IOP elicited by this test may be an indicator for the likelihood of progression and efficacy of hypotensive drugs. The aim this manuscript is to present the importance of detecting IOP peaks in glaucoma management.
Glaucoma; Peak intraocular pressure; Water drinking test
IOP: Intra-Ocular Pressure; WDT: Water Drinking Test
Since 2001, several studies showed that approximately 15% of glaucoma treated patients become blind during 6-15 years of follow-up [1-5]. It has been suggested that a subset of patients with glaucoma may be particularly susceptible to progression, possibly because of non-IOP-related factors 5. In other words, it is unknown why 15% of the treated patients became blind in an average time of 7.2 years after diagnose. Elevated intra-ocular pressure (IOP) and mean IOP are considered the main risk factors for the development and progression of glaucoma. As a result, reduction of IOP to an individualized target is the main treatment strategy.
The pressure at which glaucoma occurred, the target IOP and response to treatment are most often determined by a series of single measurements over time during office hours.
However, some patients still progress with IOP apparently in the target range. This observation has been explained on the basis that other non-IOP dependent risk factors are contributing to the glaucoma pathogenesis in these individuals [6]. An alternative explanation is that progression occurs at least in - part due to high IOP peaks not detected during routine eye examinations.
Although IOP fluctuation [7-9] is a suggested risk factor for glaucoma progression, recent studies have demonstrated that peak IOP may be a better predictor of glaucoma progression [10-12].
IOP peak assessment has been used recently to verify if the peak pressure of a given patient is in target range, to evaluate glaucoma suspect risk, the efficacy of hypotensive drugs and to detect early loss of IOP control. These are important aims to be addressed in glaucoma management. Several methods have been described to assess IOP peaks. Twenty-four-hour IOP monitoring is likely to provide the purest understanding of an individual’s IOP control including mean IOP, IOP fluctuation and peak IOP [13,14]. However, with the patient in supine position during sleeping time there are other parameters that may interact with the of IOP peak in the pathogenesis of glaucoma damage such as CSF pressure, episcleral venous pressure, blood flow rate. The costs and labor involved in this make the determination of the 24-hour IOP course is difficult if not impossible in all patients. Continuous monitoring using Contact Lens Sensor is time and resource-consuming test, may cause corneal damage, be inaccurate based on corneal curvature, thickness and hysteresis and does not allow for estimating the IOP value in millimeters of mercury corresponding to the relative variations of the electrical signal measured. An inexpensive, non-invasive, time efficient and accurate means of measuring 24-hour IOP is yet to become available.
Current methods are time and resource-intensive and are not always feasible in routine practice. It is because of these limitations that the water - drinking test (WDT) is useful in estimate IOP peak that does occur during day-time period.
The WDT was originally conceived as a diagnostic test for glaucoma, but was ultimately abandoned for this purpose because of low sensitivity, low specificity and low diagnostic value [15,16]. Recently, this test was revived with a new focus: as a surrogate marker for outflow reserve to detect IOP instability and to estimate IOP peak pressure. Peak IOP elicited by this test may be an indicator for the likelihood of progression [17,18] and efficacy of hypotensive drugs [19- 23]. Several studies have shown that peak IOP obtained with this test is strongly correlated and in agreement with the IOP peaks that occur during the day [24-26]. Usually but not always, eyes with higher IOP peaks after water ingestion take to return to baseline IOP levels than eyes with lower IOP peaks, which may reflect the status of the drainage system of the eye.
It has been postulated that a more rapid return to baseline IOP following the WDT may reflect improved outflow [27]. Independent of the mechanism that increases IOP following the WDT, an intact and active outflow should be associated with rapid IOP recovery whereas impaired outflow is more likely to lead to sustained IOP elevations. Maybe for this reason medically controlled patients with glaucoma have a greater IOP increase with the WDT than patients who have undergone filtration surgeries despite similar baseline IOP [28-31]. The observations that trabeculectomy blunts the WDT response, and therefore IOP peak, may explain why filtering surgeries decrease or halt glaucoma progression better when compared with medical treatment. The peak IOP elicited by this test is highly reproducible between days and associated with disease severity [3,7] [8-12]. Recently, it has been suggested that the WDT could also be used as a stress test to evaluate retinal ganglion cell function and hence have potential application for risk assessment [12].
It is important to note that peak IOP values occurred outside normal office hours in 54.7% of patients and 13.8% of patients, the peak IOP over 24 hours was at least 12 mmHg higher than the clinic peak. Measuring IOP in a clinical set three times a year which is about 15 seconds IOP time measurements may not reflect the IOP behavior during the year, which has 31.104.000 seconds. Despite that, and the high IOP fluctuation during the day in glaucoma patients, ophthalmologists still rely on one or three IOP measurements during the year, to make decisions in glaucoma treatment as well as to establish target IOP. There is clear evidence that high IOP levels (peak IOP) and mean IOP are associated with increased risk, but the same level of evidence is not seen for IOP fluctuations as an independent risk factor. Peak IOP detection depends only on appropriated IOP checks at office visits, whereas the mean IOP requires longitudinal IOP data collection and may be affected by the interval between visits. Establishing a target peak IOP is clinically easier and more useful than seeking to establish a target mean IOP.
Eligible patients [32-38] (i.e., those who are not on fluid restriction because of systemic conditions) liquid-fast for 2-hours before the WDT. The patient’s baseline IOP is then measured following which the patient drinks 800ml (27ounces) of water in 5 min. IOP is measured 15, 30, and 45 minutes after ingestion. The maximum IOP of the three IOP measurements is considered the peak IOP [32-38].
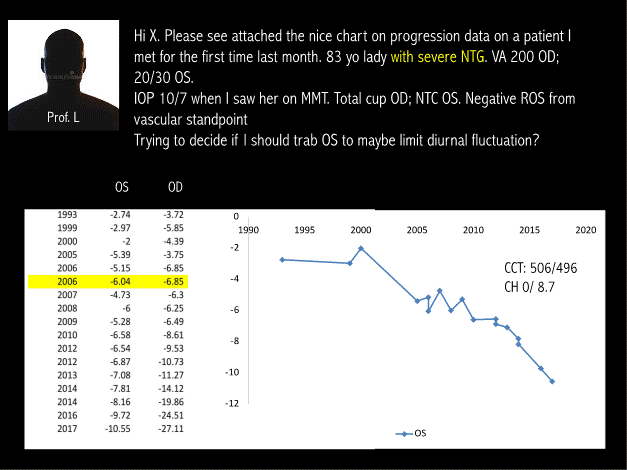
The examples below show the importance of estimating the IOP peak in glaucoma clinical practice. In a well-known University in USA, Prof L ask for an opinion to prof. X (Figure 1).

Figure 1. Chart on progression data on a patient
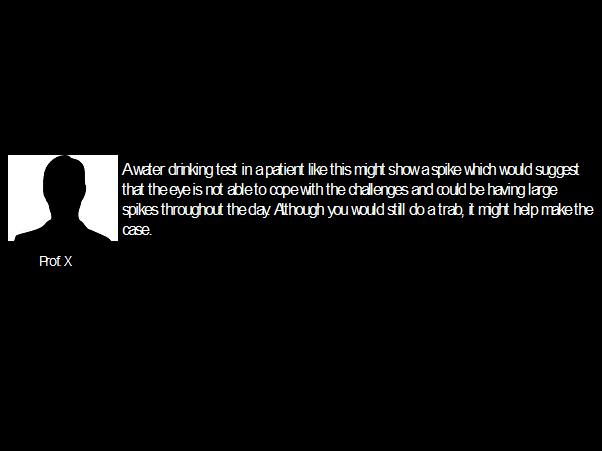
This example explains at least in - part the high rate of “NTG” and progression with “normal IOP” (Figure 2).

Figure 2. Water drinking test
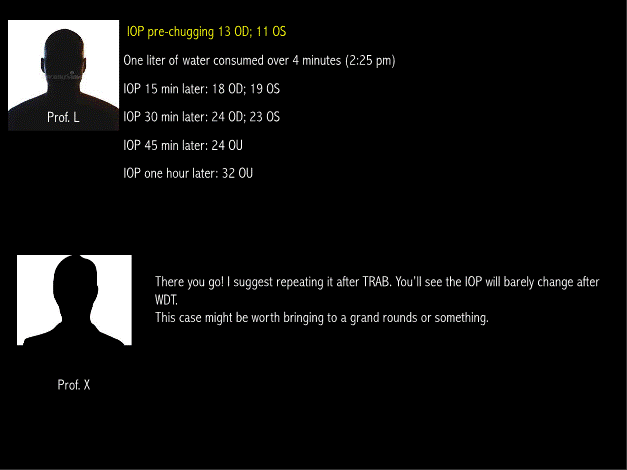
If the IOP peak had been assessed years ago, the surgery would be done earlier, avoiding blindness of the OD and the large loss in VF in the OS (Figure 3).

Figure 3. IOP pre-chugging
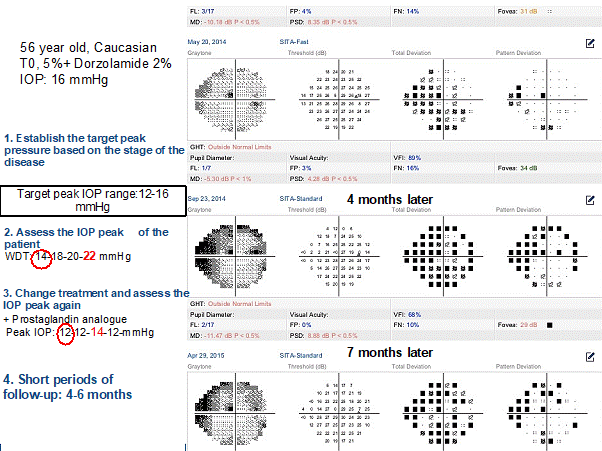
This other example above shows how to optimized IOP control. This patient presented a fast progression with IOP of 16mmHg, in the “target IOP range”. However, the peak IOP of 22mmHg is well above the target intraocular pressure (figure 4).

Figure 4. Showing different stages
After adding prostaglandin analog, there was only 2 mmHg reduction on baseline IOPs, but IOP peaks reduction was 8 mmHg. This example shows the importance to estimate and reduce IOP peak.
In conclusion, evaluating IOP peaks and IOP instability is an important step in glaucoma management to better control glaucomatous patients. Patients that are at risk of glaucoma progression, that are progressing despite IOP in the “target pressure range”, and patients with moderate or advanced glaucoma are those patients that most needed to have their IOP peak assessed.
- Hattenhauer MG, Johnson DH, Ing HH, Herman DC, Hodge DO, et al. (1998) The probability of blindness from open angle glaucoma. Ophthalmology 105: 2099-2104. [Crossref]
- Kwon YH, Kim CS, Zimmerman MB, Alward WL, Hayreh SS, et al. (2001) Rate of visual field loss and long-term visual outcome in primary open-angle glaucoma. Am J Ophthalmol 132: 47-56. [Crossref]
- Chen PP (2003) Blindness in patients with treated openangle glaucoma. Ophthalmology 110: 726-733.
- Peters D, Bengtsson B, Heijl A (2013) Lifetime risk of blindness in open-angle glaucoma. Am J Ophthalmol 156: 724-730.
- Malihi M, Filho ERM, Hodge DO, Sit AJ (2014) Long-term trends in glaucoma-related blindness in Olmsted County, Minnesota. Ophthalmology 121: 134-141.
- Collaborative Normal-Tension Glaucoma Study Group (1998) Comparison of glaucomatous progression between untreated patients with normal-tension glaucoma and patients with therapeutically reduced intraocular pressures. Am J Ophthalmol 126: 487-497.
- Asrani S, Zeimer R, Wilensky J, Gieser D, Vitale S, et al. (2000) large diurnal fluctuations in intraocular pressure are an independent risk factor in patients with glaucoma. J Glaucoma 9: 134-142.
- Nouri-Mahdavi K, Hoffman D, Coleman AL, Liu G, Li G, et al. (2004) Predictive factors for glaucomatous visual field progression in the Advanced Glaucoma Intervention Study. Ophthalmology 111: 1627-1635.
- Caprioli J, Coleman AL (2008) Intraocular pressure fluctuation a risk factor for visual field progression at low intraocular pressures in the advanced glaucoma intervention study. Ophthalmology 115: 1123-1129 e3. [Crossref]
- Konstas AG, Quaranta L, Mikropoulos DG, Nasr MB, Russo A, et al. (2012) Peak intraocular pressure and glaucomatous progression in primary open-angle glaucoma. J Ocul Pharmacol Ther 28: 26-32.
- De Moraes CG, Juthani VJ, Liebmann JM, Teng CC, Tello C, et al. (2011) Risk factors for visual field progression in treated glaucoma. Arch Ophthalmol 129: 562-568.
- Gardiner SK, Johnson CA, Demirel S (2012) Factors predicting the rate of functional progression in early and suspected glaucoma. Invest Ophthalmol Vis Sci 53: 3598-3604.
- Drance SM (1963) Diurnal Variation of Intraocular Pressure in Treated Glaucoma. Significance in Patients with Chronic Simple Glaucoma. Arch Ophthalmol 70: 302-311.
- Barkana Y, Anis S, Liebmann J, Tello C, Ritch R, et al. (2006) Clinical utility of intraocular pressure monitoring outside of normal office hours in patients with glaucoma. Arch Ophthalmol 124: 793-797.
- Rasmussen KE, Jorgensen HA (1976) Diagnostic value of the water-drinking test in early detection of simple glaucoma. Acta Ophthalmol (Copenh) 54: 160-166.
- Roth JA (1974) inadequate diagnostic value of the waterdrinking test. Br J Ophthalmol 58: 55-61.
- Susanna R Jr, Vessani RM, Sakata L, Zacarias LC, Hatanaka M, et al. (2005) The relation between intraocular pressure peak in the water drinking test and visual field progression in glaucoma. Br J Ophthalmol 89: 1298-1301.
- Susanna R Jr, Hatanaka M, Vessani RM, Pinheiro A, Morita C (2006) Correlation of asymmetric glaucomatous visual field damage and water-drinking test response. Invest Ophthalmol Vis Sci 47: 641-644. [Crossref]
- Susanna R Jr, Sheu WP (2004) Latin American Glaucoma S. Comparison of latanoprost with fixed-combination dorzolamide and timolol in adult patients with elevated intraocular pressure: an eight-week, randomized, openlabel, parallel-group, multicenter study in Latin America. Clin Ther 26: 755-768.
- Vetrugno M, Sisto D, Trabucco T, Balducci F, Delle Noci N, et al. (2005) Water-drinking test in patients with primary open-angle glaucoma while treated with different topical medications. J Ocul Pharmacol Ther 21: 250-257. [Crossref]
- Facio AC, Reis AS, Vidal KSM, de Moraes CGV, Suzuki R, et al. (2009) A comparison of bimatoprost 0.03% versus the fixed-combination of latanoprost 0.005% and timolol 0.5% in adult patients with elevated intraocular pressure: an eight-week, randomized, open-label trial. J Ocul Pharmacol Ther 25: 447-451.
- Hatanaka M, Grigera DE, Barbosa WL, Jordao M, Susanna R Jr, et al. (2008) An eight-week, multicentric, randomized, interventional, open-label, phase 4, parallel comparison of the efficacy and tolerability of the fixed combination of timolol maleate 0.5%/brimonidine tartrate 0.2% versus fixed combination of timolol maleate 0.5%/dorzolamide 2% in patients with elevated intraocular pressure. J Glaucoma 17: 674-679.
- Hatanaka M, Reis A, Sano ME, Susanna R Jr (2010) Additive intraocular pressure reduction effect of fixed combination of maleate timolol 0.5%/dorzolamide 2% (Cosopt) on monotherapy with latanoprost (Xalatan) in patients with elevated intraocular pressure: a prospective, 4-week, open-label, randomized, controlled clinical trial. J Glaucoma 19: 331-335.
- Kumar RS, de Guzman MHP, Ong PY, Goldberg I (2008) Does peak intraocular pressure measured by water drinking test reflect peak circadian levels? A pilot study. Clin Exp Ophthalmol 36: 312-315.
- Vasconcelos-Moraes CG, Susanna R Jr (2008) Correlation between the water drinking test and modified diurnal tension curve in untreated glaucomatous eyes. Clinics (Sao Paulo) 63: 433-436. [Crossref]
- De Moraes CG, Furlanetto RL, Reis AS, Vegini F, Cavalcanti NF, et al. (2009) Agreement between stress intraocular pressure and long-term intraocular pressure measurements in primary open angle glaucoma. Clin Exp Ophthalmol 37: 270-274.
- Clement C, Goldberg I (2006) Water drinking test: new applications. Clinical & experimental ophthalmology 44: 87-88.
- Danesh-Meyer HV, Papchenko T, Tan YW, Gamble GD (2008) Medically controlled glaucoma patients show greater increase in intraocular pressure than surgically controlled patients with the water drinking test. Ophthalmology 115: 1566-1570.
- Medeiros FA, Pinheiro A, Moura FC, Leal BC, Susanna R Jr, et al. (2002) Intraocular pressure fluctuations in medical versus surgically treated glaucomatous patients. J Ocul Pharmacol Ther 18: 489-498.
- Guedes RA, Guedes VM, Chaoubah A (2005) [Use of water drinking test after non-penetrating deep sclerectomy]. J Fr Ophtalmol 28: 1076-1080.
- Chen CH, Lu DW, Chang CJ, Chiang CH, Chou PI, et al. (2000) The application of water drinking test on the evaluation of trabeculectomy patency. J Ocul Pharmacol Ther 16: 37-42. [Crossref]
- Susanna R, Hatanaka M, Vessani RM, Pinheiro A, Morita C, et al. (2006) Correlation of asymmetric glaucomatous visual field damage and water-drinking test response. Invest Ophthalmol Vis Sci 47: 641-644.
- De Moraes CG, Susanna R, Sakata LM, Hatanaka M (2017) Predictive value of the water drinking test and the risk of glaucomatous visual field progression. J Glaucoma 26: 767-773.
- Susanna R, Vessani RM, Sakata L, Zacarias LC, Hatanaka M, et al. (2005) The relation between intraocular pressure peak in the water drinking test and visual field progression in glaucoma. Br J Ophthalmol 89: 1298-1301. [Crossref]
- Gameiro G, Monsalve P, Golubev I, Ventura L, Porciatti V, et al. (2018) Neurovascular changes associated with the water drinking test. J Glaucoma 27: 429-432.
- Susanna R, Clement C, Goldberg I, Hatanaka M (2017) Applications of the water drinking test in glaucoma management. Clin Exp Ophthalmol 45: 625-631. [Crossref]
- Hatanaka M, Alencar LM, De Moraes CG, Susanna R (2013) Reproducibility of intraocular pressure peak and fluctuation of the water-drinking test. Clin Exp Ophthalmol 41: 355-359.
- Babic M, De Moraes CG, Hatanaka M, Ju G, Susanna R, et al. (2015) Reproducibility of the water drinking test in treated glaucomatous patients. Clin Exp Ophthalmol 43: 228-233. [Crossref]


