Researchers of the University of Minnesota Medical School reported the first prospective randomized placebo-controlled trial (RCT) in evaluating the role of hydroxychloroquine (HCQ) as post-exposure prophylaxis (PEP) against COVID‐19. The trial's primary result reported by the authors was that, within four days after moderate or high-risk exposure to Covid-19, HCQ did not show benefit over placebo to prevent illnesses compatible with Covid-19 or confirmed infection (P=0.351, Fisher exact test). In this re-analysis, we show why the authors’ oversimplified analysis led to an incorrect conclusion from the data.
We re-analyzed the dataset by applying multiple correspondence analysis (MCA) and hierarchical cluster analysis (HCA), which are noise reduction methods used in large data sets. We used the same primary outcome measures as the authors (incidence of COVID-19-compatible disease by day 14) and the same statistical test that the authors used, such as the two-sided Fisher's exact test and others. The results obtained indicate that the individuals' age is a determining factor in the chemopreventive efficacy exerted by HCQ. Thus, in contradiction to the original authors' conclusions, the full data set's risk analysis shows that HCQ exhibits a chemopreventive effect for the group of subjects of ≤ 50 yrs that does not reach significance (P=0.083). However, not considering the analysis of the moderate-risk exposure group, we confirm that the high-risk exposure group (N=719) demonstrates a significant effect of HCQ in the under 50 age group (p=0.025). We also show, using MCA and the Mantel test, systematic differences between the treatment and placebo groups in their clinical characteristics, specifically asthma, and other-comorbidities which act as confounders that add noise to the data, such that the genuine effect of the drug is not seen in a standard analysis. After correcting these differences, the risk analysis showed that HCQ is also useful as a prophylactic agent for people over 50 years of age. This study, therefore, provides evidence of the necessity for higher-order analytics (such as MCA) in the presence of large data sets that include unknown confounders. In this case, it shows that the published conclusion of the group – that HCQ does not prevent COVID-type infective symptoms – was fundamentally flawed and should be reconsidered.
COVID‐19, post-exposure prophylaxis (PEP), hydroxychloroquine (HCQ), pattern recognition, multiple correspondence analysis (MCA), mantel's permutation test
The coronavirus disease 19 (COVID-19) is a global epidemic with high morbidity and mortality, caused by a novel enveloped, RNA, beta-coronavirus. This was first reported from Wuhan-China in late 2019, by the end of March 2020, and spread worldwide [1,2]. Currently, several drugs and vaccines are being tested for their potential activity against COVID-19. Several mini and comprehensive reviews are available, offering differing perspectives on its effectiveness and potential drawbacks [3-5].
Hydroxychloroquine (HCQ) and chloroquine (CQ), also known as antimalarial drugs, are widely used to treat systemic autoimmune diseases and have been increasingly recognized in many other diseases in addition to malaria. Thus, they have shown to display various biological activities, such as anti-inflammatory, antithrombotic, antiviral, and antineoplastic activities [6-8]. Concerning their antiviral properties, very recently, Pastick et al. [9] reported an overview of HCQ and CQ and their pharmacology and the possible mechanisms of action against SARS-CoV-2. Although there is no clinically approved antiviral drug available against COVID-19, up to date, HCQ is perhaps the therapeutic option more studied than any other potential COVID-19 drug [10]. Several authors have addressed the clinical effectiveness and incidence of HCQ toxicity when administrated to prevent and treat COVID-19. On this and other topics, a comprehensive study has been reported recently [11].
With the ongoing pandemic, prophylaxis is a particularly critical factor in breaking the spread and rapid rate of increase of SARS-CoV-2 infection, especially in patients at risk of severe forms. Pre-exposure (PrEP) and post-exposure (PEP) prophylaxes are both required components as public health measures, and the safety and efficacy of prophylactic use of HCQ have been reviewed recently [11]. Researchers of the University of Minnesota Medical School reported the first prospective randomized placebo-controlled trial (RCT) in evaluating the role of HCQ as PEP against COVID‐19 [12]. The trial was conducted on 821 people recruited for the study. The participants were identified as moderate or high risk of contracting COVID-19, based on time, distance, and protection systems at the time of close contact with someone with confirmed Covid-19. The trial's primary result reported by Boulware et al. [12] was that, within four days after moderate or high-risk exposure to Covid-19, HCQ did not show benefit over placebo to prevent illnesses compatible with Covid-19 or confirmed infection. However, the authors' conclusion about the ineffectiveness of HCQ for the prevention of Covid-19 has been subject to numerous criticisms. On the one hand, some critics were addressed on limitations in the study's experimental design, as pointed by Cohen and others [13]. On the other hand, according to Watanabe and others [11,14], perhaps the critics most important is referred to as the fact that HCQ will be useful as post-exposure prophylaxis only when it is used in the shortest possible time (0-2 days) after exposure.
Pattern Recognition (PR) methods, also referred to as chemometrics or multivariate statistics, are commonly used in rational drug design [15-17], and in general, in areas such as the analysis of clinical data as well as in the biomedical and biology fields, among others [18,19]. The PR term describes any mathematical or statistical method that may be used to detect or reveal patterns in data, which is deemed to be particularly advantageous when dealing with complex systems since PR-methods considers the behavior of multiple variables simultaneously providing useful information that would not get with only an evaluation between two variables. Thus, by applying several chemometric approaches, systematic information can be extracted from a diversified dataset.
Considering the criticisms mentioned above raised on Boulware's study, the present work aimed to re-analyze the Minnesota-study data by applying multivariate methods such as multiple correspondence analysis, principal component, and hierarchical cluster analysis. It is relatively frequent that the differences between the original trial studies and the reanalysis occurred due to different statistical or analytical methods, or ways of defining outcomes or handling missing data [20]. Thus, in the present study, the post-application analysis of chemometric techniques mentioned before was based on the same outcome primary as the authors defined in the original work (incidence of Covid-19 disease by day 14) and the same statistical test that the authors used, such as the two-sided Fisher's exact test and others.
The de-identified dataset understudy was obtained from the authors through the site www.covidpep.umn.edu. Before carrying out any new analysis, the dataset was checked by performing several analyzes repeated in the same way described in the study's published report. For clarity in presentation, Table 1 summarizes participants' demographic and clinical characteristics at baseline used in the present study. For details of trial design, characteristics of the participants, enrollment, assignment of interventions, and outcomes [12].
Table 1. Participant’s demographic and clinical characteristics at baseline used in this study
|
Hydroxychloroquine
N=414 |
Placebo
N=407 |
Column
Difference |
Demographic characteristics |
(Count) |
(Count) |
(Count) |
Gender |
|
|
|
Male |
192 |
197 |
-5 |
Female |
218 |
206 |
+12 |
Not Answer |
4 |
4 |
0 |
Age (yrs) |
|
|
|
[18-50] |
310 |
316 |
-6 |
[51-89] |
104 |
91 |
+13 |
Weight (lb) |
|
|
|
weight <170 |
233 |
222 |
+11 |
weight >170 |
181 |
185 |
-4 |
Clinical characteristics |
|
|
|
Hypertension |
51 |
48 |
+3 |
Diabetes |
12 |
16 |
-4 |
Asthma |
31 |
31 |
0 |
Other-Comorbidities |
25 |
31 |
-6 |
The data matrix was constructed by variables in the columns and individuals in the rows. The demographic variables considered in this study were age (AG) and weight (WT), both continuous variables, and the gender (sex) nominal variable. Concerning the clinical variables, and according to the chronic health conditions of participants at the time of enrollment such as reported in the original study, the following variables were assessed: hypertension (P), diabetes (D), asthma (A), and one defined by the authors in the original work, so-called other-comorbidities (OT), which included all others chronic health conditions of participants in addition to those previously mentioned. The others variables assessed were treatment and no-treatment (placebo) with HCQ (labeled as HCQ-1 and HCQ-2, respectively), and the primary outcome (labeled with positive or negative signs) such as defined by the authors in the original work: incidence of Covid-19 disease by day 14 based on PCR-confirmed (20/107) or based on symptom-based criteria (103/107). The clinical, interventional, and gender variables are categorical or nominal and comprise several levels, where each of these levels is coded as a dichotomous variable. This fact can be illustrated with the gender (F vs. M) variable, one nominal with two levels where a male respondent's pattern will be '1' and '0' for a female.
In the present work, the analysis of data matrix was carried out by using the following statistical methods: multiple correspondence analysis, principal component, and hierarchical cluster analysis. Principal component analysis (PCA) is a method of orthogonal projection commonly used to express multivariate data with fewer dimensions. These new dimensions, so-called principal components, are linear combinations of the original variables. PCA's primary objectives are to evaluate the underlying dimensionality (complexity) of the data and get an overview of the data's dominant patterns or significant trends. The other method here used was multiple correspondence analysis (MCA). It is a powerful exploratory multivariate approach for the graphical and numerical analysis of a data matrix, which is based on the use of chi-squared metrics. MCA is also a dimensional reduction technique, and can conceptually be considered a technique analog to principal components analysis but applied for categorical variables. Thus, as in PCA, the factorial axes are ranked by their order of importance in accounting for the system's total inertia (variance). Factorial maps are then drawn by plotting any two of these orthogonal axes and displaying the projections of the row and column points. In the case of continuous variables (quantitative data), the MCA analysis can also be performed, but prior to the discretization of such variables. A crucial feature of MCA is the possibility to assess the relationships between the variables and study the associations between the categories by means to analyze the generated multidimensional maps [21]. Finally, a hierarchical cluster analysis (HCA) was used in the present work. The HCA method explores the organization of variables or observations in groups and among groups depicting a hierarchy. HCA's result is usually presented in a diagram, so-called dendrogram, which is a plot that shows the hierarchical relationship between objects (variables or observations). Thus, this method was applied to obtained MCA maps, where the hierarchical grouping of categorical variables was performed according to Ward's minimum variance method [22]. The MCA, PCA, and HCA analysis were performed by using the Minitab 17.0 version and Statgraphics-centurion 18.0 version software packages. Mantel's test was performed by XLSTAT 2020 software.
Exploratory analysis using principal component analysis (PCA)
To reveal the dominant patterns and possible groupings in the complete dataset (N=821), a PCA was carried out based on the correlation matrix of the age, weight, and gender demographic variables. The first principal component (PC1) accounted for 45.9% and the second principal component (PC2) for 33% of the variance in variables considered. In Figure 1 the two-dimensional scatterplot of the loadings is displayed.
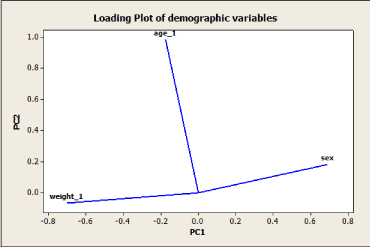
Figure 1. Loading plot of PCA model based on PC1 and PC2 components
The loading plot shows that the PCA model's first dimension mostly reflects individuals' weight and sex, both unrelated to each other and with an opposite linkage. In contrast, the age of individuals dominates the second dimension. In Figure 2, the score plot shows the projection of all the observations (individuals) onto space spanned by the PC1 and PC2 components. The PCA model's interpretation can be facilitated by simultaneously looking at both plots shown in Figures 1 and 2.
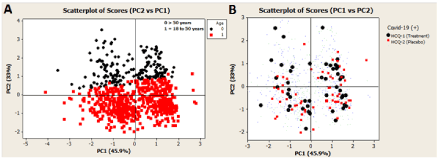
Figure 2. Score plot of the PCA model based on PC1 and PC2 components. (A) The black squares represent individuals (observations) older than 50 years of age. (B) The 107 individuals (observations) assigned positive for COVID-19 are highlighted. Group treated with HCQ (HCQ-1) are denoted with black circles. Red squares characterize the placebo group (HCQ-2)
On analyzing the graphs A and B showed in Figure 2, in an initial look, one notes a data structure relatively homogeneous concerning the demographic variables. However, a close examination of these graphs reveals differences in the effect of HCQ among the group of people under and over 50 years of age. The authors' subgroup analyses in the original work confirm this (table S6, appendix of ref. 12). The authors perform an absolute risk difference analysis for three age-subgroups: 18-35 yrs (P=0.108), 36-50 yrs (P=0.387), and>50 yrs (P=0.125). However, if one performs a risk analysis considering only two age-subgroups; that is, a group of ≤ 50 yrs and other group of >50 yrs, finds statistical evidence at a>90% confidence level for the group of subjects of ≤ 50 yrs (P=0.083), that HCQ show benefit over placebo to prevent illnesses compatible with Covid-19. Further, if one performs the same age-subgroup analysis (≤ 50 and>50 yrs) but for the high-risk exposure group (N=719), one finds statistical evidence again, but this time at a>95% confidence level for the group of subjects of ≤ 50 yrs (P=0.025). Taking into account the symptom-based criteria used by Boulware et al. in the assignment of subjects as illness compatible with Covid-19, this last finding is particularly important because of the lower degree of expected error in the COVID-19 illness assignment method for the high-risk exposure group. Table 2 summarizes these results.
Table 2. Analysis of risk on effects of HCQ as post-exposure prophylaxis for COVID-19
Participants
Age in years |
Treatment with HCQ |
Placebo |
Test and CI for
risk difference |
P Value
(two-tailed test) |
Complete Dataset (N=821) |
N N Events |
N N Events |
|
|
≤ 50 |
310 37 |
316 53 |
-0.048(-0.094, -0.002)a |
0.083(c) |
> 50 |
104 12 |
91 5 |
0.060(-0.004, 0.125)a |
0.125 |
High-Risk Exposure Group (N=719) |
|
|
|
|
≤ 50 |
275 31 |
272 49 |
-0.067(-0.126, -0.008)b |
0.025(d) |
> 50 |
90 12 |
82 5 |
0.072 (-0.015, 0.160)b |
0.104 |
(a) 90% confidence level, (b) 95% confidence level, (c) P=0.088 (Fisher’s exact test), (d) P=0.029 (Fisher’s exact test).
In light of these results, several important considerations must be highlighted. First and foremost, taking into account that the COVID-19 pandemic has and will continue to impact economics and public life profoundly, the fact that HCQ exhibits a chemopreventive effect on the population of 50 or less than 50 years of age is of vital importance. Evidence of this is a report dated August 14, 2020, from CDC and the U.S. Department of Health and Human Services that summarizes the pandemic's dramatic effects on the U.S. population's mental health. Strikingly, the most affected population was the youngest population. For example, people among 18 to 24 yrs (25.5% of respondents) and 25 to 44 yrs (16.0% of respondents) seriously considered suicide in the past 30 days, as can be observed in Table 1 of that report, among others adverse mental health outcomes [23].
The other aspect to highlight is about the age-subgroup analysis performed in the present study, which suggests the influence of sample size on the P-value, an issue that an editorial of Nature has recently appraised [24]. This fact becomes evident by carrying out a comparative analysis. For example, the two age-groups (18-35 and 36-50 yrs) that Boulware et al. analyzed in the original work correspond to a sample size of 296 and 330 individuals (observations). Now, if both groups are analyzed as a single group, as done in the present work, the sample size increases to 626 subjects, and the P-value decreases to the point of being statistically significant at a>90% confidence level. However, it is essential to note that the assumption of sample size's influence about the decrease of P-value is valid only when the observed differences between treatment and control groups respond to a causal origin, as in this case, and not at the random source. Following this line of analysis, it is also clear that incorporating the group of people over 50 years of age implies an increase of sample size from 626 to 821. However, the P-value now does not decrease but grows and is not statistically significant at a>90% confidence level. Although it is not clear which are the latent factor (s) that explain this change in the effect of HCQ for this age-group, it is likely related to several chronic health conditions present in older people. Thus, to obtain insights into the impact of HCQ for this age-group, a multiple correspondence analysis (MCA) was performed by using, in addition to demographic variables, several clinical and interventional variables.
Multiple correspondence analysis (MCA)
A first multiple correspondence analysis (MCA-1) was carried out using the data matrix's demographic and clinical variables. The aim of not including interventional variables in this initial exploratory analysis was to evaluate at baseline of demographic and clinical variables and the association and grouping patterns. As previously mentioned, PCA handles continuous variables, whereas MCA handles categorical variables. Thus, the age (AG) and weight (WT) variables were discretized in two categories: between ≤ 50 yrs and>50 yrs for age and between<170 lbs and>170 lbs for weight. The interval selected for the age variable was discussed before, whereas the mean value was the weight variable's criteria. Concerning the demographic and dichotomous variable, gender (labeled as sex-1 and sex-2, M vs. F), eight participants (rows in data array) were excluded from analysis since they did not respond to the quiz on gender. Consequently, the dataset used in all MCA was with an N=813. The clinical variables included in the MCA were hypertension (P), diabetes (D), asthma (A), and other-comorbidities (OT). Such variables were labeled as follows: P1 or P0, D1 or D0, A1 or A0, and OT1 or OT0, respectively, where '1' and '0' indicate the presence or absence of a particular condition. The scree plot was used to determine the number of factors to retain in the analysis. In Figure 3 are represented the results of MCA-1 based on the indicator matrix for the first 3 dimensions.
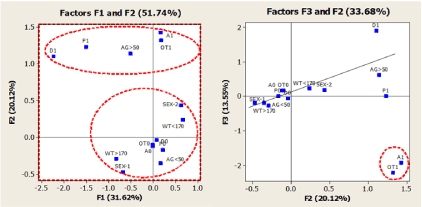
Figure 3. Multiple correspondence analysis maps for projections of demographic and clinical variables on the first three dimensions. See text for details of categorical variables
As shown in Figure 3, the first three principal factorial axes, describe a substantial proportion (65.29%) of the total inertia (variance) in the data matrix. The relative positions of the category points in these maps indicate certain similarity or association levels between the categories. On analyzing the graph of F1 vs. F2, one observes two major groups, first characterized by the clinical categories P1, D1, A1, and OT1 along with the demographic category AG>50 yrs, indicating that chronic health conditions such as hypertension, diabetes, asthma, and other-comorbidities are associated with the people over 50 years. These observations are in line with the results obtained from several population-based studies regarding age-related chronic diseases, which provide evidence that comorbidities are typically more common in older age groups. A comprehensive study on this topic corresponds to a recent review by Marengoni et al. [25]. The other group was formed between the AG ≤ 50 yrs category and the demographic types gender (sex) and weight (WT), along with the clustering around the origin of P0, D0, A0, and OT0 clinical categories. In this last group, also are observed associations between the categories WT> 120 and sex-1 (male) and WT <120 and sex-2 (female). Several studies on the association between gender and weight have been reported [26]. On the other hand, on the F2-F3 graph analysis, the A1 and OT1 location shows they are the farthest from the origin, clustered together far-right. This strong association observed between asthma and the OT1 variable suggests that in the population analyzed in the present study, the participants with asthma also had other comorbidities. The association and the impact of comorbidities on asthma have been recently reviewed by Rogliani et al. [27].
Whether or not all associations or interrelationships discussed above influence the effectiveness of HCQ as a chemopreventive agent will be discussed later. As shown in Figure 4, a hierarchical cluster analysis (HCA) using Ward's method was applied to information extracted by the first three principal factorial axes. The categories' observed grouping summarizes and confirms the performed previous analysis of the maps obtained using MCA-1.
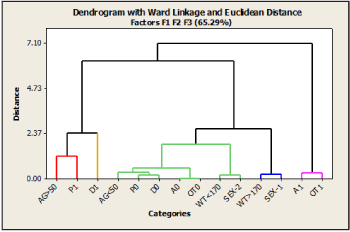
Figure 4. Dendrogram of Hierarchical Cluster Analysis (HCA) on the first three MCA-1 dimensions, showing the grouping clinical and demographic categories according to Ward’s minimum variance method
A second multiple correspondence analysis (MCA-2) was performed, including, in addition to the clinical and demographic variables, the following dichotomous variables: the treatment and no-treatment (placebo) with HCQ (labeled as HCQ-1 and HCQ-2, respectively), and the primary outcome labeled with positive or negative signs. In Figure 5 are represented the results of MCA-2 based on the indicator matrix for the first three dimensions.
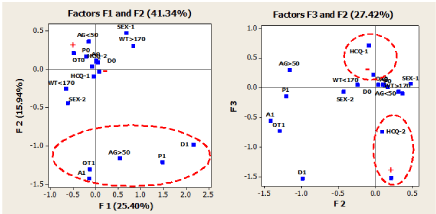
Figure 5. Multiple correspondence analysis maps for projections of demographic, clinical, and interventional variables on the first three dimensions. See text for details of categorical variables
Basing on the eigenvalues and according to the scree plot, four factors were retained for the analysis. The first factor accounted for 25.40% of the data matrix variance, the second for 15.94%, the third for 11.48%, and the fourth for 11.13% of the variance. Altogether, the factors extracted accounted for about 64% of the variance in the matrix data. On analyzing the F1 vs. F2 relationship in Figure 5, it is clear that the clustering pattern of categories P1, D1, A1, OT1, and AG>50 yrs is similar to that observed in the MC1 map shown in Figure 4. In contrast, the relationship between F3 vs. F2 showed in Figure 5 presents a different association pattern compared to the one observed in Figure 4. This difference arises in the third factorial axis (F3), which is mostly loaded by the interventional categories HCQ and the primary endpoint, and therefore, a separate discussion should be devoted. This Factor contains information that clearly discriminates (negative vs. positive coordinates along the F3 axis) between the HCQ-1 and negative primary endpoint (-) group and the other group formed by HCQ-2 and positive primary endpoint (+). In other words, this F3 vs. F2 map contains information explicitly expressed by the association between the interventional variables, thus, suggesting that positive COVID-19 subjects correspond or are more associated with the placebo group, and vice versa. Considering the four-dimensional nature of the developed MCA-2 model, a hierarchical cluster analysis (HCA) using Ward's method was applied to the first four principal factorial axes. The corresponding dendrogram is shown in Figure 6.
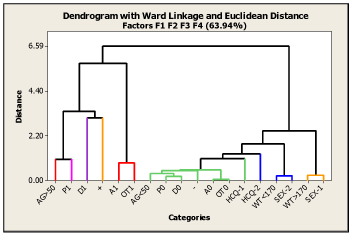
Figure 6. Dendrogram of Hierarchical Cluster Analysis (HCA) on the first four MCA-2 dimensions, showing the grouping clinical, demographic, and interventional categories according to Ward’s minimum variance method
Some issues should be in mind to overview obtained results by using the PCA, MCA, and HCA chemometric approaches. First and foremost, the individuals' age is a determining factor in the chemopreventive efficacy exerted by HCQ, which is demonstrated by the results shown in Table 2. Second, the statistical techniques here used are basically exploratory methods, and therefore they do not provide statistical significance of the displayed clustering patterns. However, admitting this, the associations between the categories revealed by all MCA-maps strongly suggest two things: in the first place, for the studied population sample, participants over 50 years of age presented at the time of enrollment several age-related chronic diseases, which could be one of the factors for the ineffectiveness of HCQ for this age population group. However, this remains an open issue, as discussed later. Secondly, the association between the placebo group (HCQ-2) and the group corresponding to positive COVID-19 subjects shown in the F3 vs. F2 map of MCA-2 (Figure 5), again suggests the effectiveness of HCQ as a chemopreventive agent. Finally, as previously mentioned, the MCA maps showed a distinctive behavior of A1 and OT1 concerning the rest of the clinical categories. Consequently, to assess these variables' possible effect on the homogeneity/heterogeneity of the population under study, a comparative analysis between the data matrix of treatment and placebo groups was performed.
HCQ-Treatment and placebo matrix comparison
One of the RCTs' distinguishing characteristics is that both the treatment and control groups do not present systematic differences about all baseline and on-treatment variables that could influence the outcome, except for the study treatment. For example, if groups are not comparable to key demographic factors, then between-group differences in treatment outcomes cannot be attributed solely to the intervention study. The technique usually used to avoid systematic differences between treatment and control groups and eliminate or minimize the influence of confounding variables is the so-called randomization. Thus, bearing in mind the observed atypical behavior of A1 and OT1 versus the rest of the clinical categories according to results obtained from the MCA maps, a comparative study between the treatment and control groups was performed to assess the possible confounding effect of these variables. The study was performed by using the Mantel's permutation test, which is based on calculating the Pearson correlation coefficient between two (dis)similarity or distance matrices, and then a randomization procedure or a parametric approximation is applied to evaluate whether the observed correlation is different from random [28]. The procedure's basic assumption carried out in this study is that the MCA-eigenvectors matrix of two similar samples (e.g., treatment and placebo) should explain similar amounts of variance in these samples. Thus, the procedure applied can be expressed as follows: first, a separate MCA was performed for both the treatment group (N=410) and the placebo group (N=403), obtaining the corresponding matrices of the principal coordinates (eigenvectors). The MCA applied to each group was carried out using the demographic (AG, WT, Sex) and clinical (P, D, A. OT) variables and extracting the maximum number of principal coordinates (seven in this case) to account for the data matrix's 100% variance. The next step consisted of translating these eigenvector matrices into the corresponding distance matrices to finally apply the Mantel test to evaluate the association between such distance matrices. The Figure 7 shows the results obtained after applying the Mantel test.
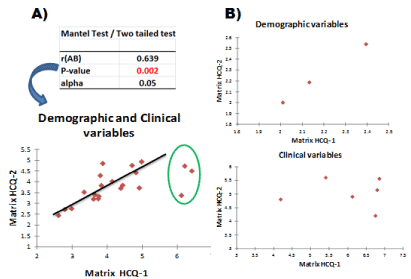
Figure 7. Mantel test for correlation between MCA-eigenvectors distance matrix of the treatment group and placebo group. The labels “Matrix HCQ-1” and “Matrix HCQ-2” correspond to the MCA-eigenvectors distance matrix of the treatment group (N=410) and placebo group (N=403), respectively
As shown in Figure 7A, the Mantel test revealed a modest but statistically significant correlation between both the treatment and placebo distance matrices (r=0.639, P=0.002). However, a close examination of this graph shows that three data points have values that significantly deviate from the other data points, causing the low correlation coefficient observed between both matrices. On the other hand, Figure 7B shows the graphs after applying the Mantel test to the distance matrices of both the treatment and placebo eigenvector matrices but obtained separately for the demographic and clinical variables. The procedure followed was exactly the one mentioned above: extraction of the maximum number of MCA-principal coordinates to obtain 100% of the data matrix variance, followed by translating into the corresponding distance matrices and finally applying the Mantel test. Looking at both graphs in Figure 7B, it is evident that the low obtained correlation between both matrices showed in Figure 7A is due to the total absence of correlation between the matrices based only on clinical variables and not on those based on demographic variables, which showed an almost perfect correlation. The identification of the anomalous data points shown in Figure 7A reveals that they correspond to the intercorrelations between the first, third, and fourth principal coordinates of the treatment and placebo matrices. Figure 8 shows the relationships between these coordinates; that is, the first and third MCA-principal coordinates of both the treatment and placebo matrices. The obtained graphs clearly reveal that finally, the categories A1 and OT1 are the responsible for the anomalous behavior previously mentioned.
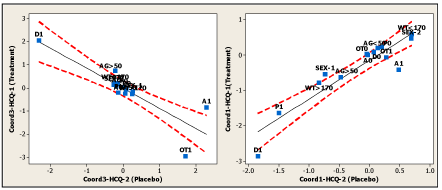
Figure 8. Simple regressions between first and third MCA-principal coordinates of both the treatment and placebo matrices, displaying at 95% confidence intervals (equations not shown)
In summary, the developed Mantel test reveals systematic differences between the treatment and placebo groups in their clinical characteristics, specifically regarding asthma and other-comorbidities (A1, OT1). Thus, admitting this fact and considering that clinical categories A1 and OT1 present a strong association with the variable AG> 50 yrs as shown in MCA-maps, a risk analysis was performed in order to gain further insight on the effectiveness of HCQ as a prophylactic agent but excluding of analysis the individuals with these clinical characteristics (A1 and OT1 rows in data array). Table 3 summarizes these results.
Table 3. Analysis of risk on effects of HCQ as post-exposure prophylaxis for COVID-19 excluding of analysis the individuals belonging to the A1 and OT1 clinical categories
Participants |
Treatment with HCQ |
Placebo |
Test and CI for
Risk Difference |
P Value
(two-tailed test) |
Complete Dataset |
N N Events |
N N Events |
|
|
N=710 |
361 40 |
349 54 |
0.044(-0.086, -0.0021)a |
0.084c |
High-Risk Exposure Group |
N=620 |
319 35 |
301 50 |
-0.056(-0.111, -0.0021)b |
0.042d |
(a) 90% confidence level, (b) 95% confidence level, (c) P=0.0966 (Fisher’s exact test), (d) P=0.047 (Fisher’s exact test)
The results shown in Table 3 are very encouraging because HCQ also appears to show effectiveness as a prophylactic agent for people over 50 years of age when the test and control groups present similar characteristics about all baseline variables.
The results obtained in the present study are consistent with the findings of several recently reported studies based on the pre and post-exposure prophylactic use of HCQ. This is the case, for example, of an interesting retrospective study conducted by Bhattacharya et al. [29], which was based on pre-exposure prophylaxis for COVID-19 among 106 health care workers (HCWs) exposed to COVID-19 patients at a tertiary care hospital in India. The study showed solid positive results from HCQ prophylaxis (Relative Risk=0.193; 95% CI=0.071-0.526; p=0.001), but what is to highlight is that the mean ± standard deviation age of the study population for both HCQ and control group was 26.46 ± 3.93 and 27.71 ± 7.24 years, respectively; which is in complete agreement with the obtained results in the present study: chemopreventive efficacy exerted by HCQ for people under 50 years. Another important retrospective Indian study was conducted by Mathai et al. [30], which also was based on pre-exposure prophylaxis for COVID-19, including subjects younger than 50 years. The mean ± standard deviation age of this study's 604 participants was 33.18±8.25 years. The relative risk was 0.1046 (95% confidence interval: 0.0510–0.2147, P<0.0001), indicating an effective chemoprophylactic role of HCQ for people of 50 or less than 50 years again. Following a similar line analysis, the study conducted by Dhibar et al. [31] also included subjects younger than 52 years, but in this case, the study corresponded to a post-exposure prophylaxis control trial, including 317 participants. The mean ± standard deviation age of this study's 317 participants was 37.2 ± 13.9 years, being the overall relative risk of 0.59 [95% confidence interval (CI), 0.33–1.05]. Thus, Dhibar's study again reveals that HCQ is prophylactically effective for this age population group.
On the other hand, an interesting study on the seroprevalence of COVID-19 amongst HCWs from India has been recently reported by Goenka et al. [32]. This observational study (N=1,122) shows solid positive results from HCQ prophylaxis (see Table 1, [32]). It should highlight that of the 1,122 participants, 1,029 corresponded to youngers to 50 yrs. Finally, important additional support to this finding comes from the review recently published by Chuan Yang et al. [33], which reported that most studies on using HCQ as a prophylactic agent showed a beneficial effect supporting their use independent of the age population. To this end, the results here showed on re-analysis performed on Boulware's study have been recently confirmed by Wiseman and co-workers [34]; that is, the prophylactic efficacy of HCQ for people under 50 years of age.
Two important consequences emerge from the present report.
Firstly, the obtained results evidence that the individuals' age is a determining factor in the chemopreventive efficacy exerted by HCQ. Thus, taking into account that the COVID-19 pandemic has and will continue to impact economics and public life profoundly, the fact that HCQ exhibits a chemopreventive effect on the population of 50 or less than 50 years of age is of essential importance. Besides, it is important to note that considering the results obtained by jointly applying the MCA models and the Mantel test, the HCQ also appears to show effectiveness as a prophylactic agent for people over 50 years of age, but when the characteristics of subject populations are similar in test and control groups. These results are in complete agreement with and extend the implications of those reported by Chuan Yang et al. [33].
Secondly, this study provides evidence for the great potential of the chemometric approaches for dealing with complex systems since principal component-like methods, such as MCA, consider the behavior of multiple variables simultaneously providing useful information that would not get with only an evaluation between two variables.
I cordially thank Prof. Dr. Samir A Saidi for careful reading of the manuscript and for his friendly support. The present work was supported by grants from University of San Luis and CONICET, Argentine.
Not applicable.
The author declares no conflict of interest, financial or otherwise.
- Huang C, Wang Y, Li X, Ren L, Zhao J, et al. (2020) Clinical features of patients infected with 2019 novel coronavirus in Wuhan, China. Lancet 395: 497-506.
- Lu R, Zhao X, Li J, Niu P, Yang B, et al. (2020) Genomic characterisation and epidemiology of 2019 novel coronavirus: Implications for virus origins and receptor binding. Lancet 395: 565-574.
- Amawi H, Deiab GA, Aljabali AAA, Dua K, Tambuwala MM (2020) COVID-19 pandemic: an overview of epidemiology, parthenogenesis, diagnostics and potential vaccines and therapeutics. Ther Deliv.
- Nittari G, Pallotta G, Amenta F, Tayebati SK (2020) Current pharmacological treatments for SARS-COV-2: A narrative review. European Journal of Pharmacology 882: 173328.
- Ortiz-Prado E, Simbaña-Rivera K, Gomez-Barreno L, Rubio-Neira M, Guaman LP, et al. (2020) Clinical, molecular, and epidemiological characterization of the SARS-CoV-2 virus and the Coronavirus Disease 2019 (COVID-19), a comprehensive literature review. Diagnostic Microbiology and Infectious Disease 98: 115094. [Crossref]
- Solomon VR, Lee H (2009) Chloroquine and its analogs: A new promise of an old drug for effective and safe cancer therapies. European Journal of Pharmacology 625: 1-3,220-233.
- Ben-Zvi I, Kivity S, Langevitz P, Shoenfeld Y (2012) Hydroxychloroquine: From Malaria to Autoimmunity. Clin Rev Allergy Immunol 42: 145-153.
- Hashem AM, Alghamdi BS, Algaissi AA, Alshehri FS, Bukhari A, et al. (2020) Therapeutic use of chloroquine and hydroxy-chloroquine quine in COVID-19 and other viral infections: A narrative review. Travel Med Infect Dis 35: 101735.
- Pastick KA, Okafor EC, Wang F, Lofgren SM, Skipper CP, et al. (2020) Review: Hydroxychloroquine and Chloroquine for Treatment of SARS-CoV-2 (COVID-19). Open Forum Infectious Diseases 7: ofaa130. [Crossref]
- Hsiehchen D, Espinoza M, Hsieh A (2020) Deficiencies in the designs and interventions of COVID-19 clinical trials. Med (N Y) 1: 103-104. [Crossref]
- Covid Analysis, Effects reported in all Covid-19 hydroxychloroquine studies, 2021, https://c19study.com/.
- Boulware DR, Pullen MF, Bangdiwala AS, Pastick KA, Lofgren SM, et al. (2020) A randomized trial of hydroxychloroquine as postexposure prophylaxis for covid-19. N Engl J Med 383: 517-525. [Crossref]
- Cohen MS (2020) Hydroxychloroquine for the prevention of covid-19—Searching for evidence. N Engl J Med 383: 585-586.
- Watanabe M (2020) Efficacy of Hydroxychloroquine as Prophylaxis for Covid-19. arXiv: 2007.09477v2 [q-bio.QM].
- Brown N, Ertl P, Lewis R, Luksch T, Reker D, et al. (2020) Artificial intelligence in chemistry and drug design. Journal of Computer-Aided Molecular Design 34: 709-715.
- Luco JM (1999) Prediction of the brain-blood distribution of a large set of drugs from structurally derived descriptors using partial least-squares (PLS) modeling. Journal of Chemical Information and Computer Sciences 39: 396-404.
- Luco JM, Marchevsky E (2006) QSAR studies on blood-brain barrier permeation. Current Computer-Aided Drug Design 2: 31-55.
- Paolanti M, Frontoni E (2020) Multidisciplinary Pattern Recognition applications: A review. Computer Science Review 37: 100276.
- Saidi SA (2004) Independent component analysis of microarray data in the study of endometrial cancer. Oncogene 23: 6677-6683.
- Ebrahim S, Sohani ZN, Montoya L, Agarwal A, Thorlund K, et al. (2014) Reanalyses of randomized clinical trial data. JAMA 312: 1024-1032. [Crossref]
- Michael Greenacre and Jorg Blasius Eds. (2006) In: Multiple Correspondence Analysis and Related Methods. Chapman and Hall/CRC ISBN 9781584886280.
- Ward JH Jr (1963) Hierarchical grouping to optimize an objective function. J Am Stat Assoc 58: 236-244.
- Czeisler ME, Lane RI, Petrosky E, Wiley JF, Christensen A, et al. (2020) Mental health, substance use, and suicidal ideation during the COVID-19 pandemic—united states. MMWR 69: 1049-1057. [Crossref]
- Amrhein V, Greenland S, McShane B (2019) Scientists rise up against statistical significance. Nature 567: 305-307.
- Marengoni A, Angleman S, Melis R, Mangialasche F, Karp A, et al. (2011) Aging with multimorbidity: A systematic review of the literature. Ageing Research Reviews 10: 430- 439.
- Chiriboga DE (2008) Gender differences in predictors of body weight and body weight change in healthy adults. Obesity 16: 137-145.
- Rogliani P, Sforza M, Calzetta L (2020) The impact of comorbidities on severe asthma. Curr Opin Pulm Med 26: 47-55.
- Mantel N (1967) The detection of disease clustering and a generalized regression approach. Cancer Research 27: 209-220.
- Bhattacharya R, Chowdhury S, Mukherjee R, Nandi A, Kulshrestha M, et al. (2021) Pre-exposure Hydroxychloroquine use is associated with reduced COVID19 risk in healthcare workers. International Journal of Research in Medical Sciences 9.
- Mathai SS, Behera V, Hande V (2020) Hydroxychloroquine as Pre-exposure prophylaxis against COVID 19 in health care workers: A single center experience. J Mar Med Soc 22: 98-104.
- Dhibar DDP, Arora DN, Kakkar DA, Singla N, Mohindra R, et al. (2020) Post-exposure prophylaxis with hydroxychloroquine for the prevention of COVID-19, a myth or a reality? The PEP-CQ Study. Int J Antimicrob Agents 56: 106224. [Crossref]
- Goenka M, Afzalpurkar S, Goenka U, Das SS, Mukherjee M, et al. (2020) Seroprevalence of COVID-19 amongst health care workers in a tertiary care hospital of a metropolitan city from India. J Assoc Physicians India 68: 14-19. [Crossref]
- Chuan Yang A, Guduguntla LS, Yang B (2020) Hydroxychloroquine and interferons for the prophylaxis and early treatment of covid-19-current clinical advances. J Clin Cell Immunol 11: 596.
- Wiseman DM, Kory P, Saidi SA, Mazzucco D (2020) Effective post-exposure prophylaxis of Covid-19 is associated with use of hydroxychloroquine: Prospective re-analysis of a public dataset incorporating novel data. December 12, 2020, medRxiv preprint doi: https://doi.org/10.1101/2020.11.29.20235218.
Editorial Information
Editor-in-Chief
Ying-Fu Chen
Kaohsiung Medical University, Taiwan
Article Type
Research Article
Publication history
Received date: January 19, 2021
Accepted date: February 08, 2021
Published date: February 12, 2021
Copyright
©2021 Luco JM. This is an open-access article distributed under the terms of the Creative Commons Attribution License, which permits unrestricted use, distribution, and reproduction in any medium, provided the original author and source are credited.
Citation
Luco JM (2021) Hydroxychloroquine as post-exposure prophylaxis for Covid-19: Why simple data analysis can lead to the wrong conclusions from well-designed studies. Trends Med 21: DOI: 10.15761/TiM.1000268

Figure 1. Loading plot of PCA model based on PC1 and PC2 components

Figure 2. Score plot of the PCA model based on PC1 and PC2 components. (A) The black squares represent individuals (observations) older than 50 years of age. (B) The 107 individuals (observations) assigned positive for COVID-19 are highlighted. Group treated with HCQ (HCQ-1) are denoted with black circles. Red squares characterize the placebo group (HCQ-2)

Figure 3. Multiple correspondence analysis maps for projections of demographic and clinical variables on the first three dimensions. See text for details of categorical variables

Figure 4. Dendrogram of Hierarchical Cluster Analysis (HCA) on the first three MCA-1 dimensions, showing the grouping clinical and demographic categories according to Ward’s minimum variance method

Figure 5. Multiple correspondence analysis maps for projections of demographic, clinical, and interventional variables on the first three dimensions. See text for details of categorical variables

Figure 6. Dendrogram of Hierarchical Cluster Analysis (HCA) on the first four MCA-2 dimensions, showing the grouping clinical, demographic, and interventional categories according to Ward’s minimum variance method

Figure 7. Mantel test for correlation between MCA-eigenvectors distance matrix of the treatment group and placebo group. The labels “Matrix HCQ-1” and “Matrix HCQ-2” correspond to the MCA-eigenvectors distance matrix of the treatment group (N=410) and placebo group (N=403), respectively

Figure 8. Simple regressions between first and third MCA-principal coordinates of both the treatment and placebo matrices, displaying at 95% confidence intervals (equations not shown)
Table 1. Participant’s demographic and clinical characteristics at baseline used in this study
|
Hydroxychloroquine
N=414 |
Placebo
N=407 |
Column
Difference |
Demographic characteristics |
(Count) |
(Count) |
(Count) |
Gender |
|
|
|
Male |
192 |
197 |
-5 |
Female |
218 |
206 |
+12 |
Not Answer |
4 |
4 |
0 |
Age (yrs) |
|
|
|
[18-50] |
310 |
316 |
-6 |
[51-89] |
104 |
91 |
+13 |
Weight (lb) |
|
|
|
weight <170 |
233 |
222 |
+11 |
weight >170 |
181 |
185 |
-4 |
Clinical characteristics |
|
|
|
Hypertension |
51 |
48 |
+3 |
Diabetes |
12 |
16 |
-4 |
Asthma |
31 |
31 |
0 |
Other-Comorbidities |
25 |
31 |
-6 |
Table 2. Analysis of risk on effects of HCQ as post-exposure prophylaxis for COVID-19
Participants
Age in years |
Treatment with HCQ |
Placebo |
Test and CI for
risk difference |
P Value
(two-tailed test) |
Complete Dataset (N=821) |
N N Events |
N N Events |
|
|
≤ 50 |
310 37 |
316 53 |
-0.048(-0.094, -0.002)a |
0.083(c) |
> 50 |
104 12 |
91 5 |
0.060(-0.004, 0.125)a |
0.125 |
High-Risk Exposure Group (N=719) |
|
|
|
|
≤ 50 |
275 31 |
272 49 |
-0.067(-0.126, -0.008)b |
0.025(d) |
> 50 |
90 12 |
82 5 |
0.072 (-0.015, 0.160)b |
0.104 |
(a) 90% confidence level, (b) 95% confidence level, (c) P=0.088 (Fisher’s exact test), (d) P=0.029 (Fisher’s exact test).
Table 3. Analysis of risk on effects of HCQ as post-exposure prophylaxis for COVID-19 excluding of analysis the individuals belonging to the A1 and OT1 clinical categories
Participants |
Treatment with HCQ |
Placebo |
Test and CI for
Risk Difference |
P Value
(two-tailed test) |
Complete Dataset |
N N Events |
N N Events |
|
|
N=710 |
361 40 |
349 54 |
0.044(-0.086, -0.0021)a |
0.084c |
High-Risk Exposure Group |
N=620 |
319 35 |
301 50 |
-0.056(-0.111, -0.0021)b |
0.042d |
(a) 90% confidence level, (b) 95% confidence level, (c) P=0.0966 (Fisher’s exact test), (d) P=0.047 (Fisher’s exact test)


