Introduction: Despite the fact that exocrine pancreatic cancer ranks as one of the most lethal forms of neoplasm, with a mortality/incidence rate nearing 98% in both industrialized and developing countries, little improvements has been made in recent decades by means of standard cytotoxic treatment. New effective and non-toxic methods are badly needed.
Objective: To further evaluate the therapeutic impact of the method of competitive inhibition of tumor enzymatic activity by means of structural analogs (CISA protocol) on pancreatic cancer patients, and to assess the robustness of our previous conclusions considering an improved N value.
Methods: The clinical outcome of 27 pancreatic cancer patients undergoing the CISA protocol (Competitive Inhibition with Structural Analogs), with no other concomitant therapy, were tabulated to determine overall survival and one-year survival rates. Tumor remission and progression-free survival were also evaluated. Measurements of the effect size were chosen over statistical significance as a means of evaluation of relevant data.
Results: Following up on a previous Randomized Controlled Clinical Trial on the metabolic therapy of exocrine pancreatic cancer, these authors have found that the one-Year Survival rate (YS) of our study (N=27) has remained above 70%, while overall survival (OS) increased to 27,82 (4-76) months. The YS of the subset of patients with no metastasis at the time of diagnosis stayed at 100%. It has become apparent that OS of the treated group has come to be 5.6 times the OS reported worldwide, which stands at 4,5 (3-6) months.
Conclusion: The magnitude of the observed effects suggests that the metabolic therapy of pancreatic cancer allows for a substantial increase in both parameters of survival, particularly in patients with no metastatic lesions at T0.
Pancreatic cancer, Metabolic therapy, Competitive inhibition, Structural analogs, Nuliglucaemia lucidae
Pancreatic cancer ranks as one of the most lethal forms of neoplasm with a mortality/incidence rate nearing 98% [1,2]. In both industrialized and developing countries, the Age-Standardized Rate (ASR) fluctuates between 4.9 and 7.6 per 100,000 men and between 3.6 and 4.9 per 100,000 women for all ethnic groups, whilst the mortality rate closely follows those same figures, having improved very little in the last decade [3]. Widely different nations from an ethnic and cultural standpoint such as England [4,5], Cuba [6], China [7], and Mediterranean countries [8], have reported epidemiological data uniformly showing a mean OS around 4 months, an average YS of 18% and as low as 2.21% for developing countries [9]. Presently, all reported data show pancreatic cancer mortality rate as virtually the same as its incidence [10]. The uniformity of the data reported in the literature allows for a consideration of the statistical universe as “control group”. It has previously been determined that cancer mortality increases linearly as a function of time. Furthermore, according to the Hardin Jones principle for the statistical analysis of homogeneous cohorts of cancer patients,-regardless of the therapy employed- the primary determinants of mortality of intractable cancers are the intrinsic dynamics of tumor biology [11]. A statistical measure such as the effect size, therefore, should be regarded as a strong indicator of true therapeutic success. In terms of statistical analysis, given the invariability of mortality in this pathology, the authors have proposed that the magnitude of the effect ([μOSTreatment – μOSControl]/σ), rather than the statistical significance of clinical findings, should be considered in the assessment of the therapeutic impact of a cancer therapy [12]. From a clinical perspective, given the strong effect of the CISA protocol (Competitive Inhibition with Structural Analogs) [13] on the Overall Survival (OS) and the One Year Survival rate (YS) of patients with no metastasis at T0 (diagnosis), and considering this approach does not involve the collateral damage frequently associated to cytotoxic chemotherapy (liver/kidney toxicity, immunosuppression, neuropathy), it is our opinion that pancreatic cancer cases -whatever the standard treatment prescribed- should also be treated with a metabolic approach.
The systemic treatment of Competitive Inhibition with Structural Analogs (CISA), described at length elsewhere [14], introduces synthetic analogs of glutamine, glucose and pyruvate [(C6H13N1O5), (C6H12O5), (C6H7NaO6), (C3H3BrO3)] through the intravenous route, under deep physiological ketosis. Additional interventions, such as intravenous insulin injections (15 to 80 IU, bolus), further depress glucose plasma concentration into single digit levels, thus favouring competitive inhibition by the above-described structural analogs, which bear structural affinity with, but lack the intrinsic activity of natural substrates. The therapeutic aim of the CISA protocol, which has not employed neither intralesional injections nor arterial catheterization, is to induce an energy crisis in pathologically hypermetabolic tissues. This approach exploits the paradoxical increase of fermentative glycolysis and glutaminolysis of neoplastic cells -even at high ptiO2 (tissular partial pressure of oxygen) initially described by Warburg and others [15]. Hypermetabolism of cancer cells has been extensively documented [16], since it sets the pathophysiological foundation for the exploitation of Positron Emission Tomography (PET), using a labelled, non-degradable substrate (18Fluoro deoxy-D-Glucose), the absorption of which reveals hypermetabolic tissues [17].
The facultative anaerobiosis of cancer cells was validated experimentally by manometrical methods as early as the 1920s (showing a depressed respiratory quotient even in the presence of oxygen). At present, by means of positron emission tomography, the intense glucose uptake shown by solid tumors stands as a quantitative proof-of-concept for cancer as a pathological derangement of ATP generation [18]. The depressed respiratory quotient registered in experimental cancer models hints at an underlying mitochondrial dysfunction [19], and partially explains the biological need for the extensive genetic reprogramming of energy metabolism undergone by cancer cells. Indeed, recent evidence has been obtained of extensive ultrastructural deformities (chrestodysmorphia) in all samples of several brain cancers [20]. In PET-positive tumors, with a Standardized Uptake Value above 3 (SUV ≥ 3), glycolysis and glutaminolysis are known to be overexpressed by a factor of 10 or higher, even in the presence a ptiO2 high enough to sustain oxidative phosphorylation [21]. Cancer cells have been independently reported to exhibit an over-expression of GLUT-1 transporters [22], hexoquinase-2 [23,24] and lactate dehydrogenase -specifically isoenzyme “A” [25]. The above described interventions are designed to disrupt this central feature of cancer, the hypermetabolic/fermentative phenotype, a universal hallmark of all malignant tumors [26]. The effectiveness of pharmacological doses of six carbon analogs (2-deoxy-D-glucose, sodium ascorbate, and glucosamine) in the treatment of highly glycolytic tumors seems apparent in this and other pathologies [27]. This intervention has proved to be selectively cytotoxic for cancer cells of multiple histological origins, both in vitro [28] and in vivo [29-31], thus validating a thermodynamic approach to cancer treatment through competitive inhibition of the catalytic activities of HK2, LDH-A and GS enzymes with synthetic, non-metabolizable analogs [32].
27 patients were evaluated -12 women and 15 men, mean age 58,5 years (30-81)- out of which 14 had not undergone any previous treatment (naïve), and 15 had metastasis at the time of diagnosis (Table 1). For the group as a whole, YS was 73 % (19/26), while mean OS was 28.42 months (4-76) (Table 2). For the 13 patients with complete or partial remission, YS was 92% and mean OS was 39 months (8-76), whereas in the 13 patients with no remission it was 54% and 11.3 months, respectively (4-24). Regarding the 15 patients bearing metastasis at the beginning of treatment, YS and mean OS were 53% and 17,27 months (4-70). According to international reports, mean OS in these patients universally stands at 3 to 6 months ( = 4.5), which indicates that survival was higher in the metabolic therapy arm of our study by a factor of nearly 4 (17/4.5 months), with an effect size of 0.9. As for the 11 patients with no metastasis at the time of diagnosis, YS stood at 100%, while the mean OS was 36 months (12-76). In the case of the 13 naïve patients, the values obtained were 69% and 29 months (4-73), respectively. In the case of the 13 patients with any sort of previous standard treatment, YS was 77%, while OS reached an average of 21 months (5-65). For the 13 patients under 60 years, with or without previous treatment, YS was 77% and mean OS was 22 months (4-70), whereas 69% of patients older than 60 were alive by the end of the first year, with a mean OS of 27 months (5-76). Table 2 summarizes raw data on which statistical analysis was conducted. Figure 1 shows the distribution of our mortality data.
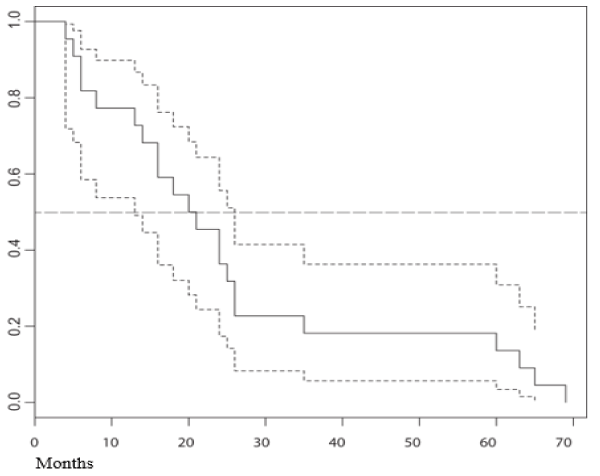
Figure 1. Overall survival in months of the treatment group.
Table 1. Baseline characteristics of patients included in the CISA protocol
Patient # |
Age at Diagnosis |
Gender |
Metastasis at Diagnosis |
Previous Treatment |
1 |
46 |
M |
Yes |
No |
2 |
67 |
M |
No |
No |
3 |
58 |
F |
Yes |
Yes |
4 |
63 |
F |
Yes |
Yes |
5 |
61 |
F |
Yes |
Yes |
6 |
53 |
F |
Yes |
No |
7 |
61 |
M |
No |
Yes |
8 |
30 |
M |
Yes |
No |
9 |
54 |
M |
No |
No |
10 |
55 |
F |
No |
Yes |
11 |
70 |
F |
No |
No |
12 |
75 |
M |
No |
No |
13 |
53 |
M |
Yes |
Yes |
14 |
59 |
M |
No |
No |
15 |
53 |
M |
Yes |
Yes |
16 |
57 |
F |
No |
Yes |
17 |
69 |
M |
Yes |
No |
18 |
68 |
M |
No |
Yes |
19 |
64 |
F |
Yes |
No |
20 |
40 |
M |
Yes |
Yes |
21 |
69 |
F |
Yes |
Yes |
22 |
54 |
M |
Yes |
No |
23 |
81 |
F |
No |
No |
24 |
67 |
F |
No |
Yes |
25 |
59 |
M |
Yes |
No |
26 |
66 |
F |
Yes |
Si |
27 |
75 |
M |
No |
No |
M: Male
F: Female |
Table 2. One year survival, overall survival and tumor remisión in patients under the CISA protocol
Patient # |
YS |
OS (months) |
Tumor remission |
1 |
Yes |
34 |
Partial |
2 |
Yes |
71 |
Partial |
3 |
Yes |
28 |
Partial |
4 |
No |
6 |
No |
5 |
Yes |
24 |
No |
6 |
Yes |
68 |
Partial |
7 |
Yes |
73 |
Partial |
8 |
No |
4 |
No |
9 |
Yes |
43 |
Total |
10 |
Yes |
34 |
Partial |
11 |
Yes |
76 |
Total |
12 |
Yes |
29 |
Partial |
13 |
Yes |
21 |
No |
14 |
Yes |
26 |
No |
15 |
Yes |
32 |
No |
16 |
Yes |
24 |
No |
17 |
Yes |
32 |
Partial |
18 |
Yes |
22 |
Partial |
19 |
No |
8 |
Partial |
20 |
Yes |
33 |
Partial |
21 |
No |
5 |
No |
22 |
No |
6 |
No |
23 |
Yes |
14 |
Partial |
24 |
Yes |
13 |
Partial |
25 |
No |
6 |
No |
26 |
No |
7 |
No |
27 |
Yes |
12 |
Partial |
YS=74%; OS=27.82 months (4-76)
T1: Time from diagnosis to beginnig of treatment.
YS: Year survival
OS: Overall survival |
Table 3. One-year survival (YS) and mean overall survival (OS) by sub-cohorts
Groups |
YS (%) |
Mean OS (interval) (months) |
Total, number of patients (n=27) |
74 |
27.82 (4-76) |
Patients tumor remission (n=16) |
97 |
36.87 (8-76) |
Patients no remission (n=11) |
54 |
14.64 (4-32) |
No metastasis at begining of treatment (n=12) |
100 |
35.33 (14-76) |
Metastasis at begining of treatment (n=15) |
53 |
17.26 (4-70) |
Naive (n=14) |
71 |
30.23 (4-75) |
Previously treated (n=13) |
77 |
21,15 (5-76) |
Patients<60 years (n=12) |
77 |
22.07 (4-70) |
Patients>60 years (n=15) |
72 |
27.71 (5-76) |
The resulting YS and OS was compared with the values reported in the main reference databases which, for the purposes of this study, were considered as the “control group”. Resulting data demonstrated an effect size (d ) = 1.08 (Figure 2). On that regard, effect sizes are classified as small (d = 0.2), medium (d = 0.5), and large (d ≥ 0.8), [33] and increasingly recognized as a better measure of therapeutic relevance than statistical significance.
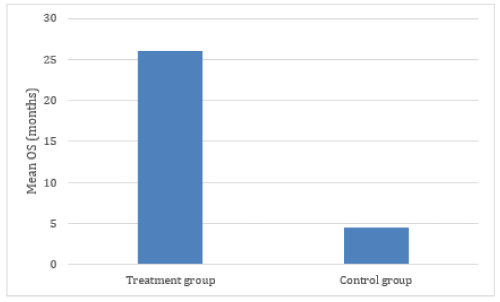
Figure 2. Comparitive mean OS of treatment and control groups. Calculation of effect size: Effect size = Mean OS (Treatment group) – Mean OS (Control Group)/Standard Deviation. Effect size = 25.11- 4.5/19= 1.08
Tumor remission was determined through comparative imaging studies -pre and post metabolic treatment- by ultrasound scan, computed tomography and/or PET-TC. The definition of remission was taken to be any measure of decrease of one or more of the diameters of the previously detected tumors. In all the cases where a measurable decrease of one or more tumor masses was observed, there was a correlation with a decrease of the specific tumor markers (CEA, Ca-19,9, Neuron specific enolase, LDH, PCR).
None of the patients included in this protocol received any concomitant therapy, whether surgical or pharmacological (chemotherapy) throughout the full length of the above-described program or after it. By definition, naïve patients had not undergone any kind of therapy prior to the beginning of the metabolic treatment, whereas the so called non-naïve had previously received some kind of standard therapy, with negative results. Quality of life regularly assessed following the criteria of the Karnofsky Performance [34] Scale (data not shown), proved to be far better than that recorded in the literature as well as the empirical data.
Non metabolizable structural analogs of glutamine, glucose and pyruvate are essentially innocuous, and have been extensively studied by our group from a pharmacokinetics and tolerability perspective [14]. Optimal application requires that patients come to a transient, tightly controlled state we have dubbed Nuliglucaemia lucidae, during which plasma glucose levels actually cross below the 9 mg/dL threshold. For this state to be physiologically achievable, plasma levels of beta hydroxybutyrate in excess of 2 mM/L must previously be present, serving as substitute biological fuel, therefore supporting brain function.
The competitive inhibition of rate-limiting enzymes of energy metabolism, by means of structural analogs, has obvious clinical effectiveness against at least a subset of pancreatic tumors. Although a mechanistic explanation of the complex effect of these interventions is still being elucidated [35,36], the nutri-pharmacological blockade of aerobic glycolysis, and glutaminolysis, involving HK2, LDHA and GS through structural analogs of their physiological substrates in the context of Nuliglucaemia lucidae (total blood glucose deprivation), seems to significantly increase survival. It is likely that this phenomenon is partly due to energetic stress in the neoplastic tissue, coupled with acute interstitial and intracellular oxidative stress, through Fenton chemistry [37,38], as well as injury to the endoplasmic reticulum [32].
Pancreatic cancer appears to be uniformly fatal regardless of therapeutic approach [39]. Across the board, epidemiological data bases and meta-analysis place the one-year survival around 12% in European and Asian studies, while American studies –which arbitrarily include the much benign endocrine modality- report a one-year survival rate nearing 29% [40]. Internationally, average survival time ranges from 4 to 6 months. In 98% of cases showing metastasis at the time of diagnosis, death occurs within six months. Mean OS of the non-metastatic group in our study reached nearly 36 months, 23 times the value of the standard deviation of the mean OS of patients presenting with secondary lesions at T0. The disproportionate OS of the cohort with no metastasis at the time of diagnosis calls for population-wide screening tests for ultra-early diagnosis.
- Ferlay J, Soerjomataram I, Ervik M, Dikshit R, Eser S, et al. (2012) GLOBOCAN 2012: Estimated Cancer Incidence, Mortality and Prevalence Worldwide in 2012. IARC CancerBase 11.
- Jemal A, Siegel R, Xu J, Ward E (2010) Cancer statistics. Cancer J Clin 60: 277-300. [Crossref]
- Ilic M, Ilic I (2016) Epidemiology of pancreatic cancer. World J Gastroenterol 22: 9694-9705. [Crossref]
- Ryan DP, Hong TS, Bardeesy N (2014) Pancreatic adenocarcinoma. N Engl J Med 371: 1039-1049. [Crossref]
- Quaresma M, Coleman MP, Rachet B (2015) 40-year trends in an index of survival for all cancers combined and survival adjusted for age and sex for each cancer in England and Wales, 1971-2011: a population-based study. Lancet 385: 1206-1228. [Crossref]
- Hurtado de Mendoza Amat J, Fábregas Rodríguez C (2008) Cáncer del páncreas: un acercamiento a la mortalidad en Cuba. Revista Cubana de Medicina Militar.
- Luo J, Xiao L, Wu C, Zheng Y, Zhao N, et al. (2013) The incidence and survival rate of population-based pancreatic cancer patients: Shanghai Cancer Registry 2004-2009. PLos One 8: e76052. [Crossref]
- Carrato A, Falcone A, Ducreux M, Valle JW, Parnaby A, et al. (2015) A Systematic Review of the Burden of Pancreatic Cancer in Europe: Real-World Impact on Survival, Quality of Life and Costs. J Gastrointest Cancer 46: 201-211. [Crossref]
- Wong MCS, Jiang JY, Liang M, Yuan F, Ming SY, et al. (2017) Global temporal patterns of pancreatic cancer and association with socioeconomic development. Sci Rep 7: 3165. [Crossref]
- Lau MK, Davila JA, Shaib YH (2010) Incidence and survival of pancreatic head and body and tail cancers: a population-based study in the United States. Pancreas 39: 458-462. [Crossref]
- Zelek S, Herman (1998) On Understanding the Hardin Jones-Pauling Biostatistical Theory of Survival Analysis for Cancer Patients. J Orthomolecular Med 13: 141-160.
- Sullivan GM, Feinn R (2012) Using Effect Size—or Why the P Value Is Not Enough. J Grad Med Educ 4: 279-282. [Crossref]
- Prieto Gratacós E, Alvarez R, Redal MA, Amador V, Sosa I , et al. (2018) Metabolic Therapy of pancreatic cancer. One-year survival rate. Clin Oncol 3: 1-7.
- Prieto Gratacós E (2017) Principia Metabolica: Fundamentos Científicos y Clínicos para una Terapia Metabólica del Cáncer. cuartavíaTRANSMEDIA.
- Warburg O, Wind F, Negelein E (1927) The metabolism of tumors in the body. J Gen Physiol 8: 519–530. [Crossref]
- DeBerardinis RJ, Chandel NS (2016) Fundamentals of cancer metabolism. Sci Adv 2: e1600200. [Crossref]
- Pinilla I, Rodríguez-Vigil B, Gómez-León N (2008) Integrated 18FDG PET/CT: Utility and Applications in Clinical Oncology. Clin Med Oncol 2: 181–198. [Crossref]
- Croteau E, Renaud J, Richard MA, Ruddy T, Bénard F, et al. (2016) PET Metabolic Biomarkers for Cancer. Biomark Cancer 8: 61–69. [Crossref]
- Slavov N, Budnik b, Schwab D, Airoldi E, Oudenaarden A, et al. (2014) Constant Growth Rate Can Be Supported by Decreasing Energy Flux and Increasing Aerobic Glycolysis. Cell Reports 7: 705-714. [Crossref]
- Arismendi Morillo G, Catellano Rodriguez A (2008) Ultraestructural mitochondrial pathology in human astrocytic tumors: potentails implications pro-therapeutics straegies. J Electron Microscopy 57: 33-39. [Crossref]
- Jin L, Alesi GN, Kang S (2016) Glutaminolysis as a target for cancer therapy. Oncogene 35: 3619–3625. [Crossref]
- Lu K, Yang J, Li DC, He SB, Zhu DM, et al. (2016) Expression and clinical significance of glucose transporter-1 in pancreatic cancer. Oncology Letters 12: 243-249. [Crossref]
- Lis P, Dyląg M, Niedźwiecka K, Ko YH, Pedersen PL, et al. (2016) The HK2 Dependent "Warburg Effect" and Mitochondrial Oxidative Phosphorylation in Cancer: Targets for Effective Therapy with 3-Bromopyruvate. Molecules 21: E1730. [Crossref]
- Mathupala SP, Ko YH, Pedersenb PL (2009) Hexokinase-2 bound to mitochondria: Cancer's stygian link to the “Warburg effect” and a pivotal target for effective therapy. Semin Cancer Biol 19: 17–24. [Crossref]
- Miao P, Sheng S, Sun X, Liu J, Huang G, et al. (2013) Lactate Dehydrogenase A in cancer: a promising target for diagnosis and therapy. IUBMB Life 65: 904-910. [Crossref]
- Vander Heiden MG, Cantley LC, Thompson CB (2009) Understanding the Warburg effect: the metabolic requirements of cell proliferation. Science 324: 1029-1033. [Crossref]
- Dang CV (2012) Links between metabolism and cancer. Genes Dev 26: 877-890. [Crossref]
- Park S (2013) The Effects of High Concentrations of Vitamin C on Cancer Cells. Nutrients 5: 3496-3505. [Crossref]
- Wang G, Yin T, Wang Y (2016) In vitro and in vivo assessment of high-dose vitamin C against murine tumors. Exp Ther Med 12: 3058-3062. [Crossref]
- Uetaki M, Tabata S, Nakasuka F, Soga T, Tomita M, et al. (2015) Metabolomic alterations in human cancer cells by vitamin C-induced oxidative stress. Sci Rep 5: 13896.
- Cieslak JA, Cullen JJ (2015) Treatment of Pancreatic Cancer with Pharmacological Ascorbate. Curr Pharm Biotechnol 16: 759-770. [Crossref]
- Xi H, Kurtoglu M, Liu H, Wangpaichitr M, Lampidis TJ, et al. (2011) 2-Deoxy-D-glucose activates autophagy via endoplasmic reticulum stress rather than ATP depletion. Cancer Chemother Pharmacol 67: 899-910. [Crossref]
- Nakagawa S, Cuthill IC (2007) Effect size, confidence interval and statistical significance: a practical guide for biologists. Biol Rev Camb Philos Soc 82: 591-605. [Crossref]
- Evers PD, Logan JE, Sills V, Chin AI (2014) Karnofsky performance status predicts overall survival, cancer-specific survival, and progression-free survival following radical cystectomy for urothelial carcinoma. World J Urol 32: 385-391. [Crossref]
- Kovács K, Decatur CL, Toro MB, Pham DG, Liu H, et al. (2016) 2-deoxy-glucose down regulates endothelial AKT and ERK via interference with n-linked glycosylation, induction of endoplasmic reticulum stress and GSK-3β activation. Mol Cancer Ther 15: 264-275. [Crossref]
- Liu H, Kurtoglu M, León-Annicchiarico CL, Munoz-Pinedo C, Barredo J, et al. (2016) Combining 2-deoxy-D-glucose with fenofibrate leads to tumor cell death mediated by simultaneous induction of energy and ER stress. Oncotarget 7: 36461-36473. [Crossref]
- Buettner G and Jurkiewicz B (1996) Catalytic Metals, Ascorbate and Free Radicals: Combinations to Avoid. Radiat Res 145: 532-541. [Crossref]
- Hwang M, Baek W (2010) Glucosamine induces autophagic cell death through the stimulation of ER stress in human glioma cancer cells. Biochem Biophys Res Commun 399: 111-116. [Crossref]
- Hidalgo M (2010) Pancreatic Cancer. N Engl J Med 362: 1605-1617. [Crossref]
- https://seer.cancer.gov/archive/csr/1975_2013/