Magnetoencephalography (MEG) is a modern physical technique for the study of the brain function that provides the required temporal resolution. On the contrary, its spatial resolution is limited, and a proper analysis of the experimental data is required to obtain a reliable 3D image of brain activity with good resolution. Recently, a modification of the commonly used Linearly Constrained Minimum Variance (LCMV) source location method to improve its spatial resolution was proposed. The improvement consisted in using pre-stimulus signals to estimate the noise, and average location estimators instead of covariance matrix or data at sensors level. Here we check the validity of the method by comparing its results with those obtained by functional magnetic resonance imaging. The results confirm that the improvement of the MEG spatial resolution provides reliable images allowing identifying neural activity.
magnetoencephalography, magnetic resonance imaging, source location
Understanding the brain function and neural activity is probably one of the major challenges of biomedicine in the XXI century [1-3]. In the last decades, an important number of physical techniques to study brain function have been developed, including electroencephalography (EEG) [4] magnetoencephalography (MEG) [5,6], functional Magnetic Resonance Imaging (fMRI) [7,8], Computerized Tomography (CT) [9] or Positron Emission Tomography (PET) [10] among others.
Despite the fact that the human brain function is still not fully understood, there is a wide consensus in the neurosciences community that it involves the synchronization of different areas [11]. Therefore, techniques with both, high spatial and temporal resolution, are needed. Unfortunately, none of the abovementioned techniques to study brain function provides the required resolution in the time and space domains suitable to follow the neural activity of the human brain.
In particular, MEG allows following the neural activity with temporal resolution of milliseconds, but the space resolution is limited by the fact that measurements are done out of the brain, and it is necessary to solve the inverse problem (i.e., determining the sources from the magnetic field measured out of the brain) to achieve the current distribution [12,13]. Therefore, the spatial resolution of MEG is of the order of centimeters. This spatial resolution is fairly larger than that achieved with other techniques.
Image reconstruction from MEG data is challenging because it is an indirect technique based on out of the brain measurements. Thus, the analysis to obtain a spatial distribution of neural currents is complicated, and different approaches and models are used. In particular, as the inverse problem has not a unique solution, additional constrains need to be used. Those constrains determine the resolution and reliability of the obtained images [14].
A reliable method for the analysis of MEG data is the so-called the Linearly Constrained Minimum Variance (LCMV) source location method [15]. It is based on the use of a spatial filtering to localize the sources of brain electrical activity, minimizing the output power and normalizing it by using the noise power. The advantage of this method is that no hypothesis about the number of sources is needed, but it uses the covariance of the source electrical activity to determine the spatial distribution of the sources.
In a recent paper [16], an improvement of the LCMV spatial filtering model was proposed. The proposed upgrading is based in three key modifications: 1) using the pre-stimulus signal to estimate the noise, 2) to average location estimators instead of covariance matrix or data at sensors levels, and 3) the use of a conservative estimation of the noise subspace [16]. These modifications yield a better resolution in the determination of the spatial distribution of neural activity.
In order to evaluate the validity of this model and the reliability of the spatial resolution of the images, we here compare the spatial distribution of neural activity, during a simple and well-established task (sequential finger tapping), obtained from MEG data using the improved LCMV method with the location obtained from fMRI data. We found a good agreement between the spatial distributions obtained with both techniques, pointing out the reliability of the improved LCMV method for the treatment of MEG experimental data.
Four healthy, right handed subjects, all males, 24, 26, 33 and 37 years old, took part in this study. Subjects were asked to perform continuous flexion and extension movements (tapping), in a flat surface with all fingers of both hands. The task consisted in tapping for intervals of 60 s followed by a rest interval of 10 s, alternating right and left hands up to four repetitions.
The nature of the procedures was explained in depth and all individuals signed a consent form. The universities involved, and the Hospital Review Committees gave approval for the study of human subjects.
MEG equipment
It is known that using arrays of SQUIDs [17] known as MEG magnetometers, localization of brain electromagnetic activity became possible [18], using different approaches such as the Capon beamformer [19,20], and its successors (LCMV, DICS, SAM, MUSIC, etc.) [5,15,18,21–25].
In our case, measurements were taken with the Elektra Neuromag Vector View 306 channel MEG equipment at the Laboratorio de Neurociencia Cognitiva y Computacional (Cognitive and Computational Neuroscience Laboratory) of the Centro de Tecnología Biomédica (Center for Biomedical Technology) of the UPM, in Madrid, Spain. This equipment contains a mixture of 204 planar gradiometers and 102 magnetometers. Sampling rate was set to 1 KHz.
fMRI equipment
The BOLD-sensitive (Blood Oxygen Level Dependent) Magnetic Resonance images is a modality of functional Magnetic Resonance Imaging (fMRI) consisting in the indirect measurement of the in vivo brain activity, in a non-invasive way. Via specific sequences, the physiological changes that take place during specific mental processes are detected, and more specifically, the changes of magnetic susceptibility due to the disturbance of the oxygenated and deoxygenated blood ratio induced by local brain activity [26]. fMRI measurements were taken with the 1.5 T Philips Intera (Best, Netherlands), equipment of the Hospital Gregorio Marañón (Madrid, Spain) with software version R11. Gradients of 30 mT/m were used with a slew rate of 150 T/m/s. Acquisition matrix was 64 × 63, and the acquisition sequence was FFE-EPI multi-slice with a repetition time (TR) of 3000 ms, echo time (TE) of 90 msec and an EPI factor of 63. The anatomic images were obtained with a FFE T1 3D sequence, with a flip angle of 30º, a TR of 2 ms and a TE of 9.2 ms. Concerning the resolution of the images, 1.0 × 1.0 × 1.0 mm isotropic voxels were used. Parallel acquisition technique was SENSE x2 with a 6-channel head skull coil.
For the fMRI paradigm, 8 blocks have been used, each containing 10 scans. The voxel size for the normalization of the functional images was 3.59 × 3.59 × 4 mm whereas for the structural images it was 1 × 0.94 × 0.94 mm. For the statistical T-test a Family-Wise Error rate (FWE) p-value adjustment is used [[i]], with a p-value of 0.05, with an extent threshold voxel set to 10.
Data model
The source localization algorithm in use for MEG was a modified version of LCMV [15,16]. In all cases, signals were pre-filtered with a Butterworth bandpass filter of order 4, prior to any subsequent computations. In the analysis, we considered three frequency bands: the alpha band [8-13] Hz, and the sub-bands [8-10] Hz and [10-12] Hz.
According to Gross J et al. [28], activation corresponding to finger tapping task is found in the alpha band, and specifically in the [10-12] Hz range.
The LCMV beamformer is based on the concept of spatial filter [15]. According to this, given a particular data matrix, the time course of a signal originated at a particular point can be estimated. It should be emphasized that the solution to the inverse problem is not unique [29] and therefore, in order to obtain a solution with some desirable properties, some specific constraints must be introduced, that are described below.
Location estimator: LCMV
The LCMV beamformer is constructed by designing a spatial filter that minimizes the filter output corresponding to each location with the constraint of unity gain, thus avoiding the trivial zero solution of the minimization problem, letting the desired signals to pass through the filter and minimizing contributions from other sources at locations different from the scanned one for each filter output. Details can be obtained from the study of Van Veen BD et al. [15].
Modifications of the LCMV method
The modifications to this basic scheme are: averaging the neural activity index (NAI) across trials [16], averaging the covariance matrices across trials, or obtaining a single covariance matrix from the averaged measurements matrix.
Let us denote by ni the NAI arranged as a vector (being the NAI at a particular point a coordinate of this vector) for the i-th trial (being a trial a repetition of the finger tapping experiment). Then, the final estimator shall be given by the average of this vector in Ni repetitions, and thus,

Another possible modification is to obtain a single covariance matrix from the covariance matrices of each repetition so that

Finally, if we denote by Mi the measurement matrix corresponding to the i-th repetition, an average measurement matrix can be obtained:

from which a corresponding covariance matrix can be calculated.
The final result, an averaged NAI in the first case or a single NAI in the other two cases, shall be obtained. The common criterion to identify activated areas should be to consider activation in those regions with activity in the range 0.95·NAImax - NAImax. However, the use of this criterion was not feasible due to the high noise level. Therefore, values in the range 0.8·NAImax - NAImax were used to consider an area activated.
A number of modifications were carried out in order to obtain better estimates, such as using pre-withening transformations, so the noise covariance matrix is the one corresponding to white noise (i.e., N = al). These prewithening transformations can be carried out via Singular Value Decomposition [30], as obtaining the square root of these matrices via Cholesky factorization posed significant numerical stability problems.
Coordinate systems
Since the set of points in the fMRI space and in the MEG space are in different coordinate systems, an appropriate transformation matrix must be applied in order to establish a reasonable comparison between both techniques. If we consider that voxel sizes may differ also, a further transformation is needed. Thus, a Rigid Body Transformation [31] was applied to the data from both techniques to make them comparable. A detailed description of this transformation is presented as Supplementary Material.
As a consequence of these transformations, the axial, coronal and sagittal planes in fMRI and in the anatomic MRI - superimposed MEG images do not coincide exactly, as they present tilts in some angle or the other, and thus these cuts are obviously different. However, using anatomical landmarks as reference this effect can be compensated.
Table 1 details the NAI maxima obtained from the analysis of the MEG data, while table 2 shows the average over for the ensemble of the subjects for each frequency band.
Table 1. NAI maxima for each subject and frequency band
Frequency band (Hz) |
NAImax |
S1 |
S2 |
S3 |
S4 |
α-band (10-13) |
0.411 |
0.650 |
0.649 |
0.621 |
8-10 |
0.354 |
0.347 |
0.322 |
0.360 |
10-12 |
0.333 |
0.389 |
0.378 |
0.382 |
Table 2. Averaged NAI maxima across all subjects and frequency band
Frequency band (Hz) |
NAImax |
α-band (10-13) |
(5.8 ± 0.6) 10-1 |
8-10 |
(3.5 ± 0.1) 10-1 |
10-12 |
(3.7 ± 0.1) 10-1 |
The NAI values are similar for all the subjects. The highest NAI was observed in the [10-12] Hz sub-band except for S1 where NAI at the [10-12] Hz frequency sub-band is somewhat smaller than the one observed at [8-10] Hz.
2021 Copyright OAT. All rights reserv
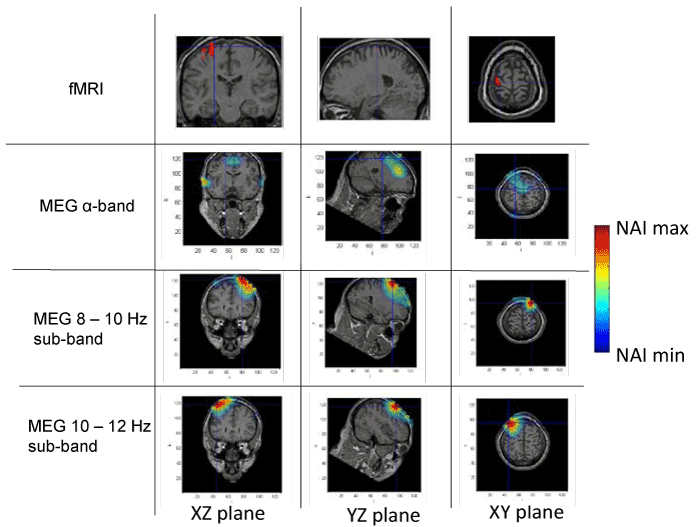
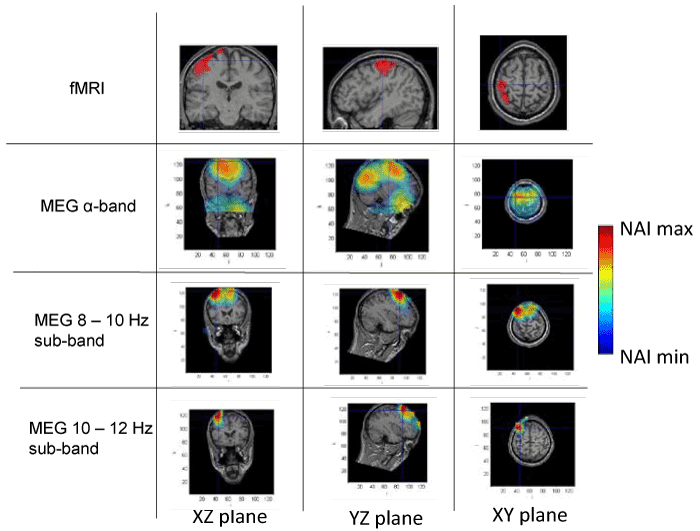
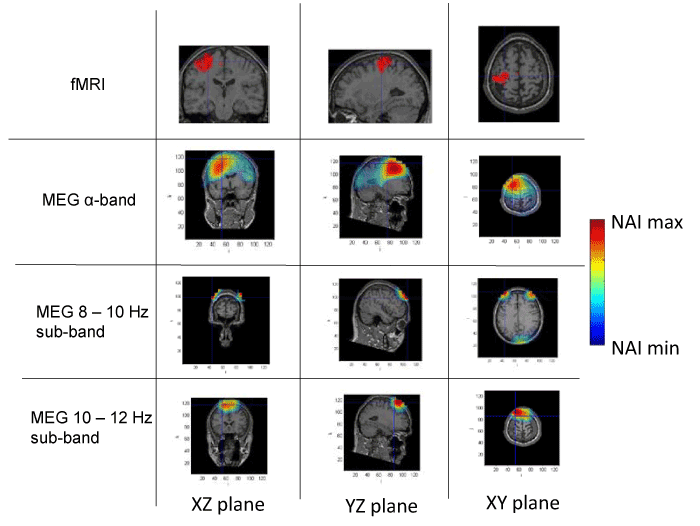
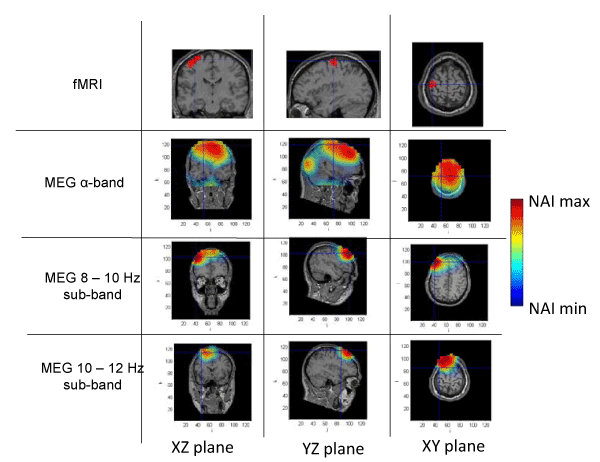
Figures 1 to 4 present the results of the spatial distribution of neural activity obtained from MEG and fMRI. A false color scale has been used to indicate the intensity of the detected neural activity, being the NAI maxima those included in table 1 and NAI minima the 80% on the NAI maxima according to the criterion above described. Each figure corresponds to a different subject, showing the results of the fMRI, followed by the results of the full alpha band, the results filtered in the 8-10 Hz sub-band and, finally, the results in the 10-12 Hz sub-band. The fMRI images should be taken as a reference of the stimuli position, taking into account that fMRI has high spatial but static resolution. Since fMRI and MEG in the same figure may correspond to slightly different planes (as above explained), crossmarks indicate identical spatial points determined using anatomical landmarks.

Figure 1. Spatial distribution of neural activity from fMRI and MEG data in three different planes for subject 1. Crossmarks correspond to the same spatial location determined from anatomical landmarks. Right Color bar indicates the scale for neural activity (NAI min = 80% NAI max).

Figure 2. Spatial distribution of neural activity from fMRI and MEG data in three different planes for subject 2. Crossmarks correspond to the same spatial location determined from anatomical landmarks. Right Color bar indicates the scale for neural activity (NAI min = 80% NAI max).

Figure 3. Spatial distribution of neural activity from fMRI and MEG data in three different planes for subject 3. Crossmarks correspond to the same spatial location determined from anatomical landmarks. Right Color bar indicates the scale for neural activity (NAI min = 80% NAI max).

Figure 4. Spatial distribution of neural activity from fMRI and MEG data in three different planes for subject 4. Crossmarks correspond to the same spatial location determined from anatomical landmarks. Right Color bar indicates the scale for neural activity (NAI min = 80% NAI max).
The results about the stimulus position obtained from MEG and fMRI in the whole alpha band essentially agree. The neural activity determined using MEG appears in some cases slightly out of the brain. This effect is due to the finite size of the voxels used for the analysis, that, upon the rigid body rotation used to compare fMRI and MEG data, results slightly shifted (the transformation is only exact for 0-dimensional points) [31]. Therefore, this comparative study provides additional validation about the results of the modified LCMV method with respect to the results presented in [16].
Noteworthy, for the 10-12 Hz sub-band, the location of the activity detected by MEG is very similar to that detected by fMRI, as it concerns the activated areas location. However, MEG also indicates that the 8-10 Hz sub-band shows activity in regions not detected by fMRI. This activity in the 8-10 Hz sub-band could be explained by the existence of collateral activity that could be assigned to lateral inhibitory mechanisms. Note that this lateral activity is well detected by MEG, whereas it becomes rather transparent for fMRI.
Analyzing each subject individually we find that for subject 1, the MEG analysis of the 8-10 Hz sub-band shows additional activity located at contra-lateral position with respect to that observed by both fMRI and MEG for the 10-12 Hz sub-band. In the case of subjects 2 and 3, new significant components are observed by MEG in the 8-10 Hz sub-band around the components detected in the 10-12 Hz sub-band by both techniques. It is interesting to note that for subject 3, the location of the activity associated with 8-10 Hz sub-band corresponds to both sides of the region activated in the 10-12 Hz sub-band. Finally, for subject 4, we can observe that the activated area corresponding to the 10-12 Hz sub-band, also observed by both techniques, spreads over a wider region for the 8-10 Hz sub-band, as analyzed by MEG.
These results suggest that the data from MEG measurements corresponding to the whole alpha band represent a mixture of different contributions and thus, a proper analysis requires separating the data by sub-bands. Doing so, we find that the activity in the 10-12 Hz sub-band essentially agrees with the results previously reported [28], due to the activation of neural circuits of contralateral primary motor cortex by the finger tapping activity. On the contrary, the analysis in the 8-10 Hz sub-band strongly suggests neural activity in adjacent zones, or in some cases, even separated from the zones activated in the 10-12 Hz sub-band. It should be noted that the activity in the 8-10 Hz sub-band has NAI values comparable to those in the 10-12 Hz sub-band. We argue that the MEG detected activity that extends beyond the fMRI identified domain must correspond to physiological processes that do not rely on sufficiently increased blood flow to be detected by fMRI. We consider that functional inhibition of neighboring neurons is the most plausible interpretation. Precedents of the biological relevance of lateral inhibition in perception coherence have been documented extensively in the visual cortex [32] and the prefrontal cortex [33]. The later report actually used MEG analysis of a goal directed motor task (inhibition of saccadic eye movement). The actual mechanism of this lateral inhibition, however, remains to be elucidated and future studies should include the potential role of the glia in this effect. Certainly, electric inhibition is a standard possibility although it requires pre-established connectivity and this requirement may possibly reduce plasticity. Alternatively, diffusible neurotransmitters could provide a fast, non-restrained, generation of a task-oriented functional network. Neurotransmitters of this type include NO and protons as described in the olfactory and visual sensory systems, respectively [34,35].
Our studies comparing MEG and fMRI data (corresponding to sequential finger tapping task) suggest that the improvement of the LCMV method for the treatment of the MEG data provides a reliable spatial distribution of the neural activity (besides a better resolution). In particular, it has been found the possibility of detecting by MEG the neuronal lateral activity in the vicinity of the group of neurons that are activated by a finger tapping activity that was not detected by fMRI data.
Nevertheless, our work contains a limited number of experiments and a more systematic study involving a larger and more representative adequate statistical sample should be required to fully confirm the statistical significance of the results, and therefore the validity of the model.
This work has been supported by the Ministerio Español de Economía y Competitividad (MINECO) through the project NANOMICROMAG, MAT2012-37109-C02-01, MAT2013-49847-EXP and MAT2015-67557-C2-1-P, Comunidad de Madrid project NANOFONTMAG, S2013/MIT-2850, Consejo Superior de Investigaciones Científicas, project NANOMIND CSIC-201560E068 and the EU H2020 program, project AMPHIBIAN, 720853.
- Yuste R (2015) From the neuron doctrine to neural networks. Nat Rev Neurosci 16: 487-497. [Crossref]
- Seung HS, Yuste R (2013) Principles of neural Science. (5th edn). McGraw-Hill: 1581.
- Poldrack RA, Farah MJ (2015) Progress and challenges in probing the human brain. Nature 526: 371-379. [Crossref]
- Jackson AF, Bolger DJ (2014) The neurophysiological bases of EEG and EEG measurement: a review for the rest of us. Psychophysiology 51: 1061-1071. [Crossref]
- Hämäläinen M, Hari R, Ilmoniemi RJ, Knuutila J, Lounasmaa OV (1993) Magnetoencephalography—theory, instrumentation, and applications to noninvasive studies of the working human brain. Rev Mod Phys 65: 413.
- Ko S, Jun SC (2010) Beamformer for simultaneous magnetoencephalography and electroencephalography analysis. J Appl Phys 107: 09B315.
- Uludag K, Dubowitz DJ, Buxton RB (2006) Clinical magnetic resonance imaging. (3rd edn). Saunders Elsevier: 249.
- Glover GH (2011) Overview of functional magnetic resonance imaging. Neurosurg Clin N Am 22: 133-139. [Crossref]
- Garvey CJ, Hanlon R (2002) Computed tomography in clinical practice. BMJ 324: 1077-1080. [Crossref]
- Shukla AK, Kumar U (2006) Positron emission tomography: An overview. J Med Phys 31: 13-21. [Crossref]
- Varela F, Lachaux JP, Rodriguez E, Martinerie J (2001) The brainweb: phase synchronization and large-scale integration. Nat Rev Neurosci 2: 229-239. [Crossref]
- Kobayashi K, Uchikawa Y (1998) Estimation of multiple sources using a three-dimensional vector measurement of a magnetoencephalogram. J Appl Phys 83: 6462.
- Iwaki S, Sutani K (2010) Visualization of the sensitivity of the magnetoencephalographic sensor array based on the three-dimensional modeling of cortical surface and volume conductor. J Appl Phys 107: 09B317.
- Iwaki S, Ueno S (1998) Weighted minimum-norm source estimation of magnetoencephalography utilizing the temporal information of the measured data. J Appl Phys 83: 6441.
- Van Veen BD, van Drongelen W, Yuchtman M, Suzuki A (1997) Localization of brain electrical activity via linearly constrained minimum variance spatial filtering. IEEE Trans Biomed Eng 44: 867-880. [Crossref]
- de Hoyos A, Portillo J, Portillo I, Marín P, Maestú F, et al. (2012) Comparison and improvements of LCMV and MUSIC source localization techniques for use in real clinical environments. J Neurosc Meth 205: 312. [Crossref]
- Zimmerman JE (1977) SQUID instruments and shielding for low-level magnetic measurements. J Appl Phys 48: 702.
- Vrba J, Robinson SE (2001) Signal processing in magnetoencephalography. Methods 25: 249-271. [Crossref]
- Haykin S (1985) editor Array signal processing, Prentice-Hall.
- Van Trees H (2002) Optimum Array Processing, Wiley-Interscience.
- Gross J, Timmermann L, Kujala J, Dirks M, Schmitz F, et al. (2002) The neural basis of intermittent motor control in humans. Proc Natl Acad Sci U S A 99: 2299-2302. [Crossref]
- Zibulevsky M, Pearlmutter BA, Bofill P, Kisilev P (2001) Blind source separation by sparse decomposition. In: Independent component analysis: principles and practice, Cambridge University Press.
- Sekihara K, Poeppel D, Marantz A, Koizumi H, Miyashita Y (1997) Noise covariance incorporated MEG-MUSIC algorithm: a method for multiple-dipole estimation tolerant of the influence of background brain activity. IEEE Trans Biomed Eng 44: 839.
- Mosher JC, Leahy RM (1998) Recursive MUSIC: a framework for EEG and MEG source localization. IEEE Trans Biomed Eng 45: 1342-1354. [Crossref]
- Mosher JC, Leahy RM (1999) Source localization using recursively applied and projected (RAP) MUSIC. IEEE Trans Signal Proc 47: 332.
- Vartiainen J, Leljeström M, Koskinen M, Renvall H, Salmelin R (2011) Functional magnetic resonance imaging blood oxygenation level-dependent signal and magnetoencephalography evoked responses yield different neural functionality in reading. J Neurosci 31: 1048. [Crossref]
- Nichols T, Hayasaka S (2003) Controlling the familywise error rate in functional neuroimaging: a comparative review. Stat Methods Med Res 12: 419-446. [Crossref]
- Gross J, Kujala J, Hämäläinen M, Timmermann L, Schnitzler A (2001) Dynamic imaging of coherent sources: Studying neural interactions in the human brain. Proc Nat Acad Sci USA 98: 694.
- Helmholtz H (1853) Ueber einige Gesetze der Vertheilung elektrischer Ströme in körperlichen Leitern mit Anwendung auf die thierisch-elektrischen Versuche. Ann Phys Chem 89: 211.
- Golub GH, Van Loan CF (1996) Matrix computations 3rd ed. Johns Hopkins University Press.
- Ashburner J (2000) Computational Neuroanatomy. PhD thesis, University College London.
- Vidyasagar TR, Eysel UT (2015) Origins of feature selectivities and maps in the mammalian primary visual cortex. Trends Neurosci 38: 475. [Crossref]
- Hwang K, Ghuman AS, Manoach DS, Jones SR, Luna B (2014) Cortical neurodynamics of inhibitory control. J Neurosci 34: 9551. [Crossref]
- Watanabe S, Takanashi F, Ishida K, Kobayashi S, Kitamura Y, et al. (2015) Nitric Oxide-Mediated Modulation of Central Network Dynamics during Olfactory Perception. PLoS One 10. [Crossref]
- Wang TM, Holzhausen LC, Kramer RH (2014) Imaging an optogenetic pH sensor reveals that protons mediate lateral inhibition in the retina. Nature Neurosci 17: 262.


