Introduction: In a developing country like India, it is imperative to study the effects of age and gender on the incidence of stroke as it has important implications in making health policy decisions.
Methods: We evaluated the incidence of stroke in patients over 15 years of age at Navi Mumbai, India during the period 2013-19 in Navi Mumbai, India. Outcomes studied were incidence of stroke stratified by age, sex, and stroke subtype.
Results: Out of a total of 1377 patients, 1246 were ischemic and 131 haemorrhagic. The mean age was 49.06 years and 53% were males. Nearly half of the strokes occurred in 46-65 years group, and one-thirds in over 65 years of age. 21% bleeds and 16% of infarcts occurred under 45years of age. Younger females had lesser risk stroke as compared to males but females above 65years had a significantly greater risk of infarct (P value <0.005). The risk of intracerebral bleed in males under 45 years was significantly more than that of females (p value <0.001).
Conclusion: Incidence of stroke increases with age, peaking in the highly productive age group of 46-65 years. The risk of any stroke was lower in younger women as compared to men, but elderly women (>65 years of age) were more prone to ischemic stroke than elderly males. Intracerebral haemorrhage occurred significantly more often in men than women under the age of 45years. These findings have important implications for public health policy and sociocultural changes.
incidence, stroke, infarct, haemorrhage, age, gender
Stroke is the second leading cause of death and the third leading cause of disability [1]. Stroke can be of two types: infarct or bleed i.e. ischemic/haemorrhagic, and is also a leading cause of dementia and depression [2]. Globally, 70% of strokes and 87% of both stroke-related deaths and disability-adjusted life years occur in low- and middle-income countries [3-5]. Over the last four decades, the stroke incidence in low- and middle-income countries has more than doubled. During these decades stroke incidence has declined by 42% in high-income countries [3]. On average, stroke occurs 15 years earlier in – and causes more deaths of – people living in low- and middle-income countries, when compared to those in high-income countries [2]. Despite its enormous impact on countries’ socio-economic development, this growing crisis has received very little attention to date. Little is known about the effect of age and gender on the incidence of stroke in our country. Much needs to be done in the same direction and this knowledge will help in making policy changes and socio-cultural changes. We studied the incidence and patterns of stroke in patients attending our stroke clinic over a span of 6 years at Navi Mumbai, India.
To investigate incidence of stroke and its subtypes in adults, according to age and sex in an urban Indian population.
We established a retrospective cohort through the data of registered patients attending a single centre stroke clinic with patients aged 15 years or more with ischemic stroke or intracerebral haemorrhage, ICD-9/10 codes between 2013 and 2019 in Navi Mumbai, India. Age groups were defined as 15-30 years, 31-45 years, 46-65 years and more than 65 years. Outcomes were incidence of stroke stratified by age, sex, and stroke subtype. Statistical analysis was done using SPSS 20. Z test for equality of percentages was used.
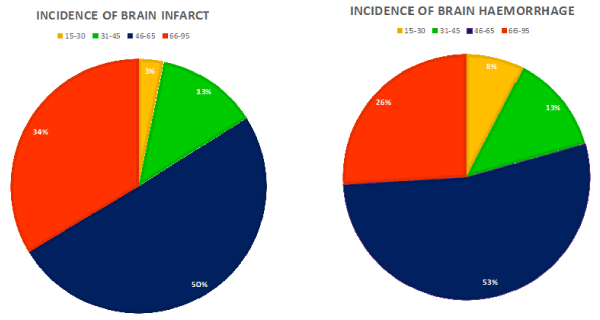
A total of 1377 patients of acute stroke were identified of which 1246 were ischemic strokes and 131 were haemorrhagic strokes. The mean age is 49.06 years and 53% males were affected. Age wise distribution of stroke was analysed. 50% of infarcts occurred between the ages of 46 to 65 years, 34% above the age of 65 years. A significant 16% of infarcts occurred before the age of 45years. 53% of bleeds occurred between the age of 46 to 65years and 26% above the age of 65 years. A significant 21% of bleeds occurred before the age of 45years.
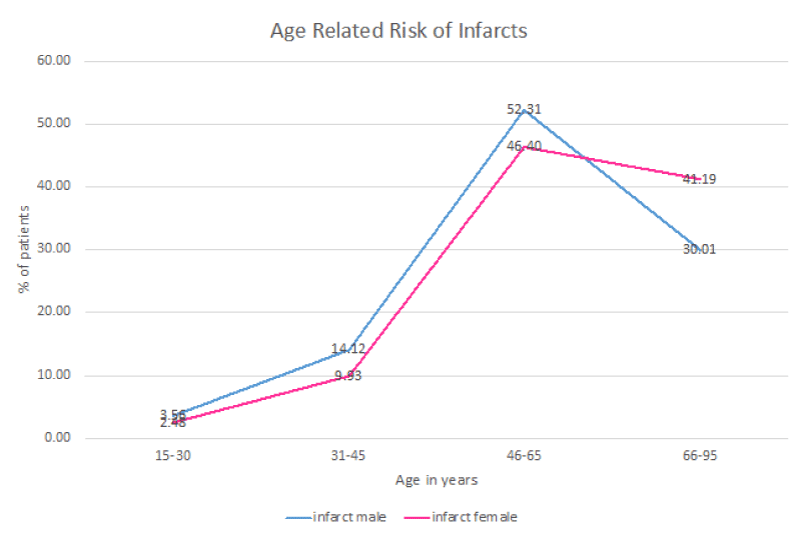
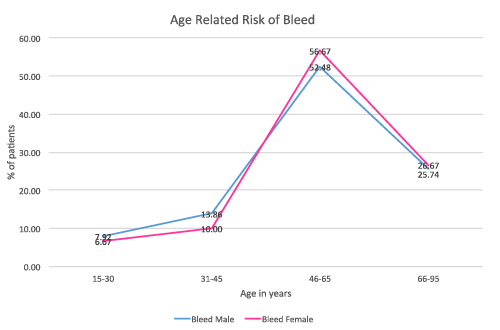
Gender wise differences were analysed also for different age groups for both infarcts and bleeds. Below the age of 65 years, females had lesser risk of infarct as compared to males. Above the age of 65years they had a significantly greater risk as compared to males (P value <0.005). The risk of intracerebral bleed in males below the age of 45 years is significantly higher than that of females (p value <0.001) (Figures 1-3 and Tables 1-3).

Figure 1. Age wise incidence of Infarct and Bleed

Figure 2. Age and gender wise risk of infarcts

Figure 3. Age and gender wise risk of Bleed
Table 1. Age wise incidence of Infarct and Bleed
Age |
Infarct |
Bleed |
Infarct in male (MI) |
Infarct in female (FI) |
Bleed in male (MB) |
Bleed in female (FB) |
|
15-30 |
40 |
10 |
30 |
10 |
8 |
2 |
|
31-45 |
159 |
17 |
119 |
40 |
14 |
3 |
|
46-65 |
628 |
70 |
441 |
187 |
53 |
17 |
|
>65 |
419 |
34 |
253 |
166 |
26 |
8 |
|
Total |
1246 |
131 |
843 |
403 |
101 |
30 |
Table 2. Age and gender wise risk of infarcts
Age |
Total Infarct |
Infarct in male (MI) |
Infarct in female (FI) |
infarct in male: age wise (MI%) |
Infarct in female: age wise (FI%) |
MI%:FI% Z-value |
P-value |
|
15-30 |
40 |
30 |
10 |
3.56% |
2.48% |
0.7429 |
P>0.05 NS |
|
31-45 |
159 |
119 |
40 |
14.12% |
9.93% |
1.5165 |
P>0.05 NS |
|
46-65 |
628 |
441 |
187 |
52.31% |
46.40% |
0.2461 |
P>0.05 NS |
|
>65 |
419 |
253 |
166 |
30.01% |
41.19% |
-5.0888 |
P<0.001 Sig |
|
Total |
1246 |
843 |
403 |
100% |
100% |
|
|
Table 3. Age and gender wise risk of Bleed
Age |
Total Bleed |
Bleed in male (MB) |
Bleed in female (FB) |
Bleed in male: age wise (MB%) |
Bleed in female: age wise (FM %) |
MB%:FB% Z-value |
P-value |
|
15-30 |
10 |
8 |
2 |
7.92% |
6.67% |
4.4716 |
P<0.001 Sig |
|
31-45 |
17 |
14 |
3 |
13.86% |
10% |
1.9878 |
P<0.05 Sig |
|
46-65 |
70 |
53 |
17 |
52.48% |
56.67% |
-1.3658 |
P>0.05 NS |
|
>65 |
34 |
26 |
8 |
25.74% |
26.67% |
-0.3416 |
P>0.05 NS |
|
Total |
131 |
101 |
30 |
100% |
100% |
|
|
The majority of the global stroke burden is from low- and middle-income countries. Despite this, there is a paucity of epidemiologic studies of stroke in India regarding the incidence and the effect of age and gender on the same. In our study, we found some interesting and important differences when compared to western epidemiologic data.
The mean age of stroke was 49.06 years, which is significantly lower than that found in high income countries like the USA (69.2 years) [6] and Europe (73 years) [7]
Overall, the proportion of patients with ischemic stroke was higher than those with hemorrhagic stroke (9.5%). This is different from previous stroke studies from India where the distribution of ischemic stroke ranged from 68-83.6% and hemorrhagic stroke from 15.1 to 32 %. [8-11]
The highest incidence of both ischemic and hemorrhagic stroke was in the age group 46-65 years (50% and 53% respectively). This is in contrast to rates from high income countries where the highest incidence is beyond the age of 65 years [6,7]
A trend of increasing incidence of stroke in women beyond 45 years of age have been reported in studies from high income countries [12] as well as few previous studies from India.10 The morbidity and mortality from stroke might be higher in women [12,13]. In our study, we found the incidence of stroke to be higher in men than in women (53% vs 47%). Though the incidence of stroke in women was lower than in men in age less than 65 years, the risk of ischemic stroke increased significantly beyond that age. Our study highlights the important effect of the non-modifiable risk factor of female gender on stroke incidence. Further studies are needed to identify and characterize the incidence rates of stroke from urban and rural populations from different parts of India, and to assess the effect of age and gender on stroke.
Incidence of stroke increases with increasing age, but in our urban population it peaked in the highly productive age group of 46-65 years. The risk of stroke was lower in women as compared to men under the age of 45, it becoming equal in the age group of 46-65. However, with advancing age, women were more prone to ischemic stroke(infarct) above the age of 65 as compared to men. Incidence of intracerebral haemorrhage was found to be significantly higher in men than women under the age of 45years. These findings have important implications for public health policy and sociocultural changes.
- http://www.who.int/healthinfo/global_burden_disease/en/
- Owolabi MO, Akarolo-Anthony S, Akinyemi R, Arnett D, Gebregziabher M, et al. (2015) Members of the H3Africa Consortium. The burden of stroke in Africa: a glance at the present and a glimpse into the future. Cardiovasc J Afr 26: S27-S38.
- Feigin VL, Forouzanfar MH, Krishnamurthi R, Mensah GA, Connor M, et al. (2014) Global Burden of Diseases, Injuries, and Risk Factors Study 2010 (GBD 2010) and the GBD Stroke Experts Group. Global and regional burden of stroke during 1990-2010: findings from the Global Burden of Disease Study 2010. Lancet 383: 245-254.
- Feigin VL, Lawes CMM, Bennett DA, Barker-Collo SL, Parag V (2009) Worldwide stroke incidence and early case fatality reported in 56 population-based studies: a systematic review. Lancet Neurol 8: 355-369.
- Strong K, Mathers C, Bonita R (2007) Preventing stroke: saving lives around the world. Lancet Neurol 6: 182-187.
- Brett M Kissela (2012) Age at stroke. Neurology 79: 1781-1787.
- Charles DA Wolfe (2009) Incidence of stroke in Europe at the beginning of the 21st century. Stroke 40: 1557-1563.
- Dalal PM, Malik S, Bhattacharjee M, Trivedi ND, Vairale J, et al. (2008) Population-based stroke survey in Mumbai, India: incidence and 28-day case fatality. Neuroepidemiology 31: 254-261.
- Sridharan SE, Unnikrishnan JP, Sukumaran S, Sylaja PN, Nayak SD, et al. (2009) Incidence, types, risk factors, and outcome of stroke in a developing country: the Trivandrum Stroke Registry. Stroke 40: 1212-1218.
- Das SK, Banerjee TK, Biswas A, Roy T, Raut DK, et al. (2007) A prospective community-based study of stroke in Kolkata, India. Stroke 38: 906-910.
- Nagaraja D, Gururaj G, Girish N, Panda S, Roy AK, et al. (2009) Feasibility study of stroke surveillance: data from Bangalore, India. Indian J Med Res 130: 396.
- Towfighi A, Saver JL, Engelhardt R, Ovbiagele B (2007) A midlife stroke surge among women in the United States. Neurology 69: 1898-1904.
- Girijala RL, Sohrabji F, Bush RL (2017) Sex differences in stroke: review of current knowledge and evidence. Vascular Medicine 22: 135-145.


