Objective: To evaluate whether neck circumference (NC) is an appropriate somatometric parameter for determining tube voltage of thorax CT under automatic exposure control (AEC) system in comparison with BMI.
Methods: 76 patients undergoing non-enhanced thorax CT were enrolled in this study. NC, body weight and height were measured and body mass index (BMI) was calculated before the examination. The subjective image quality was assessed using on a 5-point scale.
Results: There were high correlations between BMI, NC, and weight. There were also high correlations between these three somatometric parameters and dose. The correlation between NC and dose (r = 0.839) is higher than the correlation between BMI and dose (r = 0.635).
Conclusion: It might be more accurate to determine the tube voltage of thorax CT under AEC system according to NC value as NC is correlated in dose changes more accurately and with a higher proportion instead of BMI.
ındividual dose control, computed tomography, ALARA, tube voltage, neck circumference, body mass index
The capability of multidetector computed tomography (MDCT) technology allows images less than 1 mm thickness with a high quality reformatted multiplanar and 3D images. The utility of CT has been greatly expanded, and the total radiation dose delivered across the entire population has increased as utilization of diagnostic radiation exposure with MDCT [1,2]. Consequently, the technologists and radiologists has worked to establish the lowest radiation exposure to the patient, in accordance with the ALARA principle. Today, the popular and reliable application among all dose reduction strategies is automatic exposure control (AEC) systems [3-6]. The AEC systems available in modern CT scanners adjust the x-ray tube current in realtime in response to variations depended patient’s shape, size, and attenuation in x-ray intensity at the detector. The system automatically adjusts the mAs value according to each slice, but according to what should we determined tube voltage (kV) ? The accurate body size measurement is first step for low dose CT [1,7]. The kV value of CT under AEC system is still determined manually by radiology technician and generally according to the patient's body mass index (BMI) or weight.
In determining tube voltage for indivisual dose control, somatometric parameters of displayed area could help us against the risk of potential unnecessary overdose. BMI is the most widely used clinical anthropometric tool for defining overweight and obesity [8], it is also commonly reported body index for adjusting low dose CT protocols [9,10]. It has been reported that several anthropometric parameters might serve as a surrogate instead of BMI for thorax CT protocol [11, 12]. Despite its popularity, BMI is not a good surrogate for regional adiposity [8]. In most clinical research, a new parameter has come into use for defining regional fat in the upper body with regard to related pathologies such as hypertension and coronary artery disease [13-17]: neck circumference (NC). Now in clinical use, NC is an easily measurable parameter requiring just a few seconds and no calculation is required.
The purpose of this study is to evaluate whether NC is an appropriate somatometric parameter for adjusting kV value of thorax CT protocol under AEC system.
Study population
The prospective study was approved by the local ethics committee (2015/3- April 21,2015). Before the CT examination, we explained the adverse effects of radiation exposure to all patients and written informed consent was obtained before the procedure. 84 consecutive patients undergoing non-enhanced thorax CT were enrolled in this study. The patients (75 men, 9 women; age range 16-76 years; mean age 24) underwent MDCT for the evaluation of dyspnea, hemoptysis and pulmonary infections between June and October 2015. At the time of CT examination, NC was measured horizontally at the level of the cricoid cartilage by a non-elastic flexible tape, body weight and height were measured with stadiometer by nursing staff in the radiology department. BMI is calculated by dividing the weight (kilogram) by the square of height (meter). Patients with incomplete data (such as missing weight or height data), pediatric patients were excluded from this study. Eventually, 76 of patients were enrolled in the study and statistics.
CT protocol
All examinations were performed on 64-slice CT scanner providing 4 cm of coverage (Brilliance 64; Philips Healthcare, Cleveland, Ohio, USA). All patients underwent scans, using the following protocol: tube voltage 100 kV, variable mAs settings determined by the automatic exposure control system [(automatic current selection: ACS and Z-axis dose modulation: Z-DOM)], collimation 64 × 0.625 mm; rotation time 600 ms; pitch 1.18; FOV 300-350 mm. The CT scanning range covered the whole thorax from 1 cm below the cricoid cartilage to the left adrenal gland in the upper abdomen.
Estimation of the radiation dose
The effective dose (ED) of patient in mSv was calculated as the product of the dose length product(DLP) - the summation of the regional dose length product - multiplied by a conversion coefficient for the chest (k = 0.017 mSv / mGy.cm).
Image reconstruction and analysis
All images were then transferred to an external workstation for interpretation(Extended Brilliance Workspace (Version 4.0); Philips Healthcare, Cleveland, Ohio, USA). Image data were reconstructed with conventional FBP at a slice thickness of 1mm using a lung reconstruction kernel (filter L). All data sets were reviewed with lung window settings (window width =WW, 1200 to 1500 HU; window level = WL, -550 to -700 HU) and mediastinal window settings (WW = 350 HU; WL = 40 HU).
Images were evaluated in consensus by two trained radiologists both with more than 5 years experience in thorax radiology.
For the assessment of objective image quality, the image noise was defined as the standard deviation (SD) of the attenuation value in an regions of interest (ROI) placed in the ascending aorta. Circular 100 mm2 ROI were drawn in the ascendan aorta at the level of the left main coronary artery origin.
The subjective image quality was assessed using on a 5-point scale [based on the distinction of anatomic details of mediastinal structures and axial interstitial anatomy]: (4: excellent image quality, i.e. no visible artifacts and excellent contour; 3: good image quality, i.e. minimal artifacts and good contour; 2: moderate image quality, i.e. mild artifacts and moderate contour 1: poor image quality, i.e. moderate artifact and poor contour; 0: non-diagnostic image quality, i.e. high artifacts and severe contour) (Figure1) .
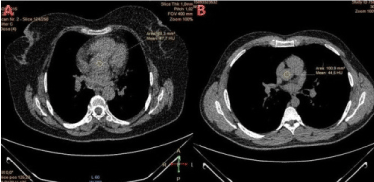
Figure 1. Two examples of subjective image quality assesment: Image quality score 1 (A) and score 3 (B). Note the ROI in both images placed in the ascending aorta to assess the objective image quality.
Statistical analysis
Descriptive statistics are presented as frequency (percentage) for categorical variables whereas continuous data are presented as median, Inter Quartile Range (IQR) and minimum- maximum for non-normally distributed data and mean, Sd for normally distributed data. Kruskal-Wallis test was used to compare the groups and we used Mann Withney-U test for binary comparisons. Benforoni correction used for post hoc analysis. Spearman correlation test used for correlation analysis. Statistical Package for the Social Sciences (SPSS) 15.0(SPSS Inc., Chicago, IL) was used for statistical analysis and p<0.05 considered as statistically significant.
Seventy-six (76) patients (6 women, 70 men; mean age, 24 ± 7.75 years; range, 16-76 years) were prospectively enrolled in the study. The anthropometric measurements and calculations were mean weight 72.5 ± 14.75 (range 45-112) kilograms, mean BMI 25 ± 5.75 (range 19-39) kg/m², mean NC 38 ± 2 (range 31-45.5) centimeters. The mean applied radiation dose was 1.2 mSv (IQR; 0.75, min-max 0.50-4.1).
Correlations between somatometric parameters and both the dose and the image quality are shown in Table 1. There were high correlations between BMI, NC, and weight. There were also high correlations between these three somatometric parameters and dose. The correlation between NC and dose (r = 0.839) is higher than the correlation between BMI and dose (r = 0.635). In evaluation of the aorta noise values; the correlations between the noise and both NC and weight were moderate (respectively, r = 0.415 and r = 0.383). At the same time, the correlation between BMI and noise was moderate (r = 0.488). Considering the changes in the noise and the radiation dose corresponding to each unit of BMI and NC, while the changes of the noise value of aorta were 1.15 ± 0.37 (range 0.56-1.75) and dose 0.046 ± 0.02 (range 0.02-0.12) for each unit of BMI, the noise value of aorta were 0.78 ± 0.23 (range 0.44-1.12) and dose 0.031 ± 0.02 (range 0.02-0.10) for each unit of NC.
Table 1. Correlations between somatometric parameters and both the dose and the image quality.
|
BMI |
NC |
Weight |
Height |
AP |
Lateral |
AP-Lat |
Noise |
Dose |
Score |
BMI (kg/m²) |
1.00 |
.753* <0.001 |
.784* <0.001 |
-.148** 0.106 |
.560* <0.001 |
.761* <0.001 |
.715* <0.001 |
.488* <0.001 |
.635* <0.001 |
.243* 0.004 |
NC (cm) |
.753* <0.001 |
1.00 |
.845* <0.001 |
.228* 0.016 |
.478* <0.001 |
.651* <0.001 |
.604* <0.001 |
.415* 0.002 |
.839* <0.001 |
.371* <0.001 |
Weight (kg) |
.784* <0.001 |
.845* <0.001 |
1 |
.381* <0.001 |
.619* <0.001 |
.703* <0.001 |
.700* <0.001 |
.383* 0.009 |
.770* <0.001 |
.345* <0.001 |
Height (cm) |
-148** 0.106 |
.228* 0.016 |
.381* <0.001 |
1 |
.068** 0.580 |
-.03** 0.460 |
.014** 0.641 |
-.175** 0.167 |
.256** 0.270 |
.120** 0.233 |
Noise |
.488* <0.001 |
.415* 0.002 |
.383* 0.009 |
-.175** 0.167 |
.278* 0.022 |
.444* <0.001 |
.377* <0.001 |
1 |
.242** 0.153 |
-.181** 0.156 |
Dose (mSv) |
.635* <0.001 |
.839* <0.001 |
.770* <0.001 |
.256** 0.279 |
.488* <0.001 |
.574* <0.001 |
.556* <0.001 |
.242* 0.153 |
1 |
.474* <0.001 |
Score |
.243* 0.004 |
.371* <0.001 |
.345* <0.001 |
.120** 0.233 |
.417* <0.001 |
.190** 0.145 |
.257* 0.021 |
-.181** 0.156 |
.474* <0.001 |
1 |
Spearman correlation analysis * p<0.05, **p>0.05
BMI: Body mass index; NC: Neck circumference; AP: (Thorax) anteroposterior diameter; Lateral: (Thorax) lateral diameter; AP-Lat: arithmetic average of thorax AP and lateral diameter; Noise: Noise value of aorta; Score: The subjective image quality
Patients were grouped into three categories according to the NC (15). (NC < 37 cm: group 1, NC 37-39 cm: group 2; and NC > 39 cm: group 3). The distribution of somatometric parameters, dose, and noise values, grouped according to NC, are shown in Table 2. There was a significant intergroup difference in all parameters except age and height parameters of the patients. We determined significant difference both in aortic noise value and dose between groups 1 and 2, higher in group 2 than group 1 (p < 0.001). In contrast, the score had no difference between these groups (p = 0784). A statistical difference was found between dose and score in groups 1 and 3, higher in group 3 (p < 0.001). No difference was revealed in aortic noise between these two groups (p = 0.164). In comparison between groups 2 and 3, significant differences were found in doses and the scores between the groups (p < 0.05), higher in group 3 than group 2 (p < 0.001). However, the aortic noise value had no difference between these groups (p = 0.068).
Table 2: The distribution of somatometric parameters, dose, and noise values, grouped according to NC.
Mean, (Sd, min-max) |
Group 1 |
Group 2 |
Group 3 |
p |
Age (year) |
33.2 (19.0, 16-76) |
27.4 (11.2, 20-60) |
33.0 (13.1, 20-59) |
.153 |
Weight (kg) |
63.2 (6.8, 45-79) |
74.9 (7.8, 68-95) |
94.6 (11.8, 78,5-112) |
< 0.001 |
Height (cm) |
170 (8, 150 – 186) |
1175 (8, 155 – 195) |
175 (7.7, 160 – 190) |
.245 |
BMI (kg/m²) |
23.1 (2.4, 19 – 28) |
25.8 (3.4, 21 – 36) |
33 (3.9, 28 – 39) |
< 0.001 |
Noise |
24.5 (5.9, 16 – 37) |
32.3 (5.3, 19 – 41) |
29.9 (9.5, 18 – 38) |
< 0.001 |
Dose (mSv) |
0.7 (0.07, 0.5 – 1.7) |
1.2 (0.24, 1 – 1.9) |
3.1 (0.6, 2.2 – 4.1) |
< 0.001 |
Score |
1.7 (0.7, 1-3) |
1.8 (0.67, 1-3) |
2.8 (0.4, 2-3) |
< 0.001 |
Kruskal-Wallis analysis; p<0.05, p>0.05
BMI: Body mass index; NC: Neck circumference; AP(Thorax) anteroposterior diameter; Lateral: (Thorax) lateral diameter; AP-Lat: arithmetic average of thorax AP and lateral diameter; Noise: Noise value of aorta; Score: The subjective image quality.
Patients were then grouped into three categories according to BMI (BMI < 25 kg/m²: group 1; BMI 25- 29 kg/m²: group 2; and BMI > 29 kg/m²: group 3). The distribution of somatometric parameters, dose, and noise values grouped according to BMI are shown in Table 3. There was a significant intergroup difference in all parameters except the height parameter of the patients. Although a significant difference was found both in aortic noise value and dose between groups 1 and 2 (p < 0.05), the score had no difference between these groups (p = 0.615). We found a significant difference in all parameters between groups 1 and 3 (p < 0.001). In comparison between groups 2 and 3, significant differences were found in doses and the scores between the groups (p < 0.05). However, the aortic noise value had no difference between these groups (p = 0.74).
Table 3. The distribution of somatometric parameters, dose, and noise values, grouped according to BMI.
Mean, (Sd, min-max) |
Group 1 |
Group 2 |
Group 3 |
p |
Age (year) |
26.8 (11.9, 16 -61) |
28.2 (13.7, 20 – 76) |
38.3 (14.6, 21-60) |
.006 |
Weight (kg) |
65.4 (7.2, 45-80) |
76.4 (9.3, 61-105) |
91 (12.1, 75 – 112) |
< 0.001 |
Height (cm) |
174.8 (7.6, 150 – 190) |
175.5 (8.2, 159 – 195) |
169.8 (8.4, 155-185) |
.083 |
NC (cm) |
36.1 (1.8, 31 – 39) |
37.9 (1.8, 33-44) |
40.5 (2.1, 38 – 45) |
< 0.001 |
Noise |
26.3 (6.1, 16-37) |
31 (5.5, 18-39) |
34.2 (5.6, 21-41) |
< 0.001 |
Dose (mSv) |
0.9 (0.25, 0.7-1.4) |
1.4 (0.64, 0.5-3.5) |
2.5 (1.1, 1.1 - 4.1) |
< 0.001 |
Score |
1.9 (0.65, 1-3) |
1.8 (0.63, 1-3) |
2.5 (0.8, 1-3) |
.004 |
Kruskal-Wallis analysis; p<0.05, p>0.05
BMI: Body mass index; NC: Neck circumference; AP:(Thorax) anteroposterior diameter; Lateral: (Thorax) lateral diameter; AP-Lat: arithmetic average of thorax AP and lateral diameter; Noise: Noise value of aorta; Score: The subjective image quality.
When groups 1 and 2 in Tables 2 and 3 were compared, the average dose received by each group and image scores of NC and BMI were the same. However, it was seen that the average dose for BMI group 3 was lower than for NC group 3. The distribution of the patients in groups was evaluated in order to present patients in both BMI and NC group 3 to whom a higher dose can be applied (Tables 4-6). There was a statistically significant difference between doses given to NC group 2 and 3 patients in BMI group 3 (p = 0.012) but no statistically significant difference was detected between doses given to BMI group 2 and 3 patients in NC group 3 (p > 0.05).
Table 4. Groups according to neck circumferences.
|
NC Group 1 (n:18) |
NC Group 2 (n:45) |
NC Group 3 (n:13) |
BMI Group 1 |
12 |
14 |
0 |
BMI Group 2 |
6 |
25 |
4 |
BMI Group 3 |
0 |
6 |
9 |
Groups according to BMI
|
BMI Group 1 (n:26) |
BMI Group 2 (n:35) |
BMI Group 3 (n:15) |
NC Group 1 |
12 |
6 |
0 |
NC Group 2 |
14 |
25 |
6 |
NC Group 3 |
0 |
4 |
9 |
BMI: Body mass index; NC: Neck circumference
Table 5. NC group 2 and 3 patients within the BMI group 3.
|
NC grup 2 (n:6) |
NC grup 3 (n: 9) |
p |
Weight(kg) |
79.5, IQR 5.4 (75.5-85) |
95, IQR 19.3 (89-112) |
< 0.001 |
Height (cm) |
166, IQR 14.8 (155 – 178) |
175, IQR 8,5 (160 – 185) |
.145 |
Noise |
39.15, IQR 8.7 (28.9-41.8) |
32.9, IQR 7.9 (21.1-38.3) |
.088 |
Dose (mSv) |
1.25, IQR 0.35 (1.1-1.9) |
3.5, IQR 1.15 (2,6-4.1) |
.012 |
Score |
1.5, IQR 2, (1-3) |
3 |
.036 |
Mann Withney-U test p<0.05, p>0.05
BMI: Body mass index; NC: Neck circumference; AP: (Thorax) anteroposterior diameter; Lateral: (Thorax) lateral diameter; AP-Lat: arithmetic average of thorax AP and lateral diameter; Noise: Noise value of aorta; IQR: interquartile range
Table 6. BMI group 2 and 3 patients within the NC group 3.
|
BMI group 2 (n:4) |
BMI group 3 (n: 9) |
p |
Weight(kg) |
79.5, IQR 20.1 (78,5-105) |
95, IQR 19.3 (89-112) |
.076 |
Height (cm) |
178, IQR 9 (178 – 190) |
175, IQR 8,5 (160 – 185) |
.020 |
Noise |
25.95, IQR 8.5 (18.1-29.1) |
32.9, IQR 7.9 (21.1-38.3) |
.050 |
Dose (mSv) |
2.85, IQR 1.05 (2.2-3.5) |
3.5, IQR 1.15 (2.6-4.1) |
.330 |
Score |
2 |
3 |
.034 |
Mann Withney-U test p<0.05, p>0.05
BMI: Body mass index; NC: Neck circumference; AP(Thorax) anteroposterior diameter; Lateral: (Thorax) lateral diameter; AP-Lat: arithmetic average of thorax AP and lateral diameter; Noise: Noise value of aorta; IQR: interquartile range
In order to reduce the amount of received CT radiation on AEC system, determining kV value according to the displayed area should have been very important. It would be more accurate to adjust the kV value of CT on thorax region according to a somatometric parameter which reflects the mass or fat content of this region rather than general body. In our study, we examined BMI as a classic parameter, a new somatometric parameter NC and several parameters as weight and height. We made comparisons in terms of compatibility between dose and these somatometric parameters.
In our study, there was a high correlation between NC and BMI and weight. In accordance with our aim, we found that NC shows higher correlation with dose (r = 0.839) when compared with BMI (r = 0.635). We think that this result is due to the general mass index character of BMI rather than a local index feature such as the thorax. NC measurement shows the amount of subcutaneous fat tissue at the neck and is especially related to the amount of visceral fat tissue in thorax [17]. In clinical trials, visceral fat tissue has been found to be more related to physiological or pathological processes in the body when compared with the amount of total fat tissue (BMI) [18]. Therefore, NC has begun to come into use in some clinical practices for determining the amount of visceral fat [19]. This also applies in radiology. In the region-specific investigations such as cardiac CT, central/regional adiposity is more important for determining dose. Jing-Lei Li et al. [12] found that the correlation between BMI and image noise is weak when compared with chest circumference and remarked that BMI does not reflect the body shape but defines general fat and muscle mass. Similarly, Chenying Lu et al. [20] reported in their study that body shapes that are formed by dissolution of different fats such as breast tissue and central obesity in women is important for cardiac CT and BMI is insufficient for this field. In cardiac and thoracic CT imaging, mediastinal fat and soft tissue are the factors that can effect applied dose in CT. There are as yet no studies in the literature with NC as an alternative for BMI in thorax and cardiac CT individual dose control. Most of the studies are about coronary CT angiography and the most advised somatometric parameter in individual dose control for thorax was chest circumference or length [11, 12, 21]. Ghoshhajra et al. [11] reported that patients had received excessive doses with a ratio of 27.4% if the tube potential (kV) of cardiac CT was planned according to BMI. The superiority of chest circumference to BMI was explained as being to due chest circumference reflecting central obesity and body shape more accurately.
It was noteworthy that the average dose given to BMI group 3 patients was lower than the dose given to NC group 3 patients (Table 2 and 3). At first glance, this result seems to be contrary to the high correlation of dose with NC in our study. But when we looked for the average doses of NC group 2 and NC group 3 patients in BMI group 3, the NC group 2 patients seemed to receive less dose, and there was a statistically significant difference between these two groups. Although the image quality of NC group 2 is slightly lower than NC group 3, it is seen that AEC system is more appropriately determined mAS value according to NC than BMI. This result also showed the risk receiving high doses (potential overdose) for NC group 2 patients in BMI group 3 who can receive a smaller dose if they are grouped according to NC. On the other hand, when doses between BMI group 2 and BMI group 3 patients in NC group 3 were compared, we did not find any statistically significant difference and there is no potentially overdosed or underdosed patient. CT dose parameters should be properly adjusted according to displayed area [22]. A patient has a high BMI with a large waist may require a relatively small radiation dose due to small chest size on cardiac CT. Or a woman with a big breast size might require relatively more dose than a small-chested man with the same BMI [11]. Therefore, CT protocol should be adapted according to the studied area otherwise excessive or low dose might be applied. Our study suggested that CT dose could have been reduced if measurement of neck circumference were used instead of BMI on thoracic imaging.
In our study, aortic noise value indicates moderate to high correlation with BMI and moderate correlation with NC. A similar condition was seen in the study of Li et al. [12], and correlation between chest circumference length (measurement was made based on image) and aorta noise was highest; on the other hand, the correlation between the manually measured chest circumference value and aorta noise was defined as weak. Similirlay, in our study, the NC measurement is more practical but it is measured manually by the technician. The measurements made over image like scout image could be more accurate and practical than manual [12].
Our study has some limitations. Our study is a feasibility research related to different somatometric parameter for determining tube voltage value of thorax CT under AEC system. We have not presented CT protocols with different kV values according to the patient's NC measurement. The preliminary studies have to be evaluated the results of CT protocols according to the NC measurement on phantoms are required. Secondly, as a very large and predominant part of the patient population applying to our hospital are young male patients and patients were accepted sequentially in our prospective study, we could not reach a sufficient number of female patients for correlation analysis. Another limitation was we could not include other somatometric parameters of the thorax region as like chest circumference in this study.
NC might be an appropriate somatometric parameter for adjusting tube voltage of thorax CT under AEC system instead of BMI. This information would be essential for cardiac imaging which is the major usage areas of MDCT with a largest source of diagnostic medical radiation.
None of the authors have conflict of interest in any devices mentioned in this article.
- Brenner DJ, Hall EJ (2007) Computed tomography--an increasing source of radiation exposure. N Engl J Med 2007 357: 2277-2284. [Crossref]
- United Nations Scientific Committee on the Effects of Atomic Radiation. UNSCEAR 2000 report to the general assembly, Annex D: medical radiation exposure. New York: United Nations; 2000.
- Aweda MA, Arogundade RA (2007) Patient dose reduction methods in computerized tomography procedures: a review. Int J Phys Sci 2: 1-9.
- Kalender WA, Buchenau S, Deak P, Kellermeier M, Langner O, et al. (2008) Technical approaches to the optimization of CT. Phys Med 24: 71-79. [Crossref]
- Kalra MK, Maher MM, Toth TL, Hamberg LM, Blake MA, et al. (2004) Strategies for CT radiation dose optimization. Radiology 230: 619-628. [Crossref]
- McCollough CH (2005) Automatic exposure control in CT: are we done yet? Radiology 237: 755-756. [Crossref]
- Fazel R, Krumholz HM,Wang Y, Ross JS, Chen J, et al. (2009) Exposure to low-dose ionizing radiation from medical imaging procedures. N Engl J Med 361: 849-857. [Crossref]
- Walton C, Lees B, Crook D, Worthington M, Godsland IF, et al. (1995) Body fat distribution, rather than overall adiposity, influences serum lipids and lipoproteins in healthy men independently of age. Am J Med 99: 459-464. [Crossref]
- Hosch W, Stiller W, Mueller D, Gitsioudis G, Welzel J, et al. (2012) Reduction of radiation exposure and improvement of image quality with BMI-adapted prospective cardiac computed tomography and iterative reconstruction. Eur J Radiol 81: 3568-3576. [Crossref]
- Shah A, Das P, Subkovas E, Buch AN, Rees M, et al. (2015) Radiation dose during coronary angiogram: relation to body mass index. Heart Lung Circ 24:21-25. [Crossref]
- Ghoshhajra BB, Engel LC, Major GP, Verdini D, Sidhu M, et al. (2011) Direct chest area measurement: a potential anthropometric replacement for BMI to inform cardiac CT dose parameters? J Cardiovasc Comput Tomogr 5: 240-246. [Crossref]
- Li JL, Liu H, Huang MP, Zhang ZL, Liu HJ, et al. (2014) Potentially Optimal Body Size to Adjust Tube Current for Individualized Radiation Dose Control in Retrospective ECG-Triggered 256-Slice CT Coronary Angiography. Hellenic J Cardiol 55: 393-401. [Crossref]
- Kissebah AH, Krakower GR (1994) Regional adiposity and morbidity. Physiol Rev 74: 761-811. [Crossref]
- Saka M, Türker P, Ercan A, Kiziltan G, Baş M (2014) Is neck circumference measurement an indicator for abdominal obesity? A pilot study on Turkish Adults. Afr Health Sci 14:570-575. [Crossref]
- Nafiu OO, Burke C, Lee J, Voepel-Lewis T, Malviya S, et al. (2010) Neck Circumference as a Screening Measure for Identifying Children with High Body Mass Index. Pediatrics 126: e306. [Crossref]
- Zen V, Fuchs FD, Wainstein MV, Gonçalves SC, Biavatti K, et al. (2012) Neck circumference and central obesity are independent predictors of coronary artery disease in patients undergoing coronary angiography. Am J Cardiovasc Dis 2:323-330. [Crossref]
- Li HX, Zhang F, Zhao D, Xin Z, Guo SQ, et al. (2014) Neck circumference as a measure of neck fat and abdominal visceral fat in Chinese adults. BMC Public Health 14: 311. [Crossref]
- Preis SR, Massaro JM, Hoffmann U, D'Agostino RB Sr, Levy D, et al. (2010) Neck circumference as a novel measure of cardiometabolic risk: the Framingham Heart study. J Clin Endocrinol Metab 95: 3701-3710. [Crossref]
- Fox CS, Massaro JM, Hoffmann U, Pou KM, Maurovich-Horvat P, et al. (2007) Abdominal visceral and subcutaneous adipose tissue compartments: association with metabolic risk factors in the Framingham Heart Study. Circulation 116: 39-48. [Crossref]
- Lu C, Wang Z, Ji J, Wang H, Hu X, Chen C (2015) Evaluation of a chest circumference-adapted protocol for low-dose 128-slice coronary CT angiography with prospective electrocardiogram triggering. Korean J Radiol 16:13-20. [Crossref]
- Li JL, Huang MP, Liang CH, Zhao ZJ, Liu H, et al. (2012) Individualized radiation dose control in 256-slice CT coronary angiography (CTCA) in retrospective ECG-triggered helical scans: Using a measure of body size to adjust tube current selection. Eur J Radiol 81: 3146-3153. [Crossref]
- Boone JM, Geraghty EM, Seibert JA, Wootton-Gorges SL (2003) Dose reduction in pediatric CT: a rational approach. Radiology 228: 352-360. [Crossref]