Background: Acute Respiratory Infections (ARI) are the leading cause of morbidity and mortality all over the world, mainly in young children, elderly and immune-compromised patients. In this paper we aimed to determine the influence of climatic variability on the burden of medically attended acute respiratory infections (MAARI) in Cuba and the contribution of RSV and Influenza to that burden.
Methods: An ecological study using retrospective analyses of time series was carried out. Statistical data of MAARI were obtained through universal surveillance during the period 2011-2017. The clinical samples taken through the sentinel surveillance were sent to the National Reference Laboratory for detection of respiratory viruses using a Real-Time Polymerase Chain Reaction assay (RT-RCP). The data of climatic variables were obtained from the climate station network of the Meteorology Institute in the period 1981-2010 for the baseline and 2011-2017 for the current conditions. The complex Bultó climatic indexes were used to analyze the time series of climatic variables, applying techniques of multivariate analysis to describe inter-monthly and inter-seasonal variation.
Results: A bimodal curve on MAARI is observed with a main peak in October and another small in March. The biggest increase during September-November matches with the higher circulation of Respiratory Syncytial Virus (RSV). Influenza viruses circulate more during June-August, with a higher peak in July. The largest climatic variability is observed during the months April-November, corresponding to the rainy season and the period of higher circulation of Influenza and RSV. The increasing of MAARI reports during January-March could be attributed to other respiratory viruses (ORV) circulating.
Conclusion: RSV adds a great burden to health care in Cuban population, mostly in pediatric ages during September-November, months belonging to the rainy season, with increasing of climatic variability. It seems that the ORV also contributes an important burden to the MAARI.
acute respiratory infections, influenza, syncytial respiratory virus, surveillance, climate variations
Acute Respiratory Infections (ARI) are the leading cause of morbidity and mortality all over the world, mainly in young children, elderly and immune-compromised patients. They also contribute with a great burden to the health systems regarding medical attendance and hospital admissions. According to the Global Burden of Disease Study 2010, ARI is the fourth cause of mortality worldwide, with more than two million deaths annually [1]. Among children under five years-old, ARI was the leading cause of death in 2016 [2]. Respiratory viruses are the main etiology of respiratory illness throughout the world [3,4], 90% of ARI are estimated to be related with viruses [5]. Among these viruses, influenza and respiratory syncytial virus (RSV) play predominant role, causing high morbidity and mortality, mostly affecting individuals aged < 5 and ≥ 65 years and persons with underlying medical conditions, including HIV infection [6-9]. Since ancient times influenza viruses have caused large epidemics and pandemics in the world; the last one in 2009 caused more than 500,000 deaths. It is one of the most contagious diseases by its high mutation capacity [10].
Respiratory Syncytial Virus (RSV) is the most common etiologic agent causing severe lower respiratory tract infections in children under 5 years old [6,11,12]. This virus causes a wide range of diseases ranging from a common cold to severe disease such as bronchiolitis and pneumonia [13]. The role of the environment in the spread of respiratory infections is not well understood yet. Nevertheless, the seasonal patterns of almost all respiratory viruses are one of the most evident manifestations of the effect of the environment on its transmission [1]. The effects of the climatic variability on health vary according to the region, the vulnerability of individuals and the populations' resilience [14]. In areas with temperate climates, the seasonal pattern of respiratory viruses in connection with the climate is very well known; however, few studies convincingly demonstrate the temporal-spatial behavior and the seasonality of respiratory viruses in the tropical regions [15-18]. In Cuba, as a tropical country, ARI also contributes with a great burden of medical care to the National Health System (NHS). Some recent studies describing the seasonal behavior of Influenza and RSV have been performed, as well as their relationship with climate variability [18-20]. In this paper we aimed to determine the influence of climatic variability on the burden of medically attended acute respiratory infections (MAARI) in Cuba and the contribution of RSV and Influenza to that burden.
Study design
An ecological study using retrospective analyses of time series was carried out.
Setting
Cuba is a mostly tropical country settled in the Caribbean Sea. The average annual temperature ranges from 24°C to 26°C. Despite its tropical condition, some seasonal characteristics are present in its thermal regime, with two well-known seasons: summer (rainy season) from May to October, being July and August the warmest months; and winter (less rainy season) from November to April, being January and February the coldest months. The national average rain record is 1335 mm; however, drought events recurrently occur, persisting during several years [21].
Participants
A total of 44 484 804 MAARI reported through the universal ARI surveillance during the period 2011-2017, according to province, month and age groups were analyzed. Age groups are: 0-4, 5-19, 20-59 and ≥ 60 years old.
For RSV diagnostic a total of 11 462 clinical samples of children under five years of age with clinical diagnosis of influenza-like illness (ILI), severe acute respiratory infection (SARI), bronchiolitis and pertussis syndrome were included in the study. For Influenza virus detection, a total of 25 219 clinical samples from people of any age with clinical diagnosis of ARI, ILI and SARI were included.
Variables
Clinical: Total of MAARI, samples processed in the National Reference Laboratory (NRL) and positive samples of RSV and influenza virus by provinces, month and age groups.
Climate: Monthly series of dissolved oxygen density in air (g/m2), maximum and minimum mean air temperatures (ºC), average thermal air oscillation, average relative humidity of air (%), (Mm), mean atmospheric pressure at sea level (hpa), total precipitation (mm) and the number of days with precipitation 0.1 mm.
Data source and measurements
Universal surveillance from Primary Health Care allowed obtaining statistical data of the MAARI in the country during the period 2011-2017 on a monthly basis. The clinical samples were obtained through the virological surveillance in patients with clinical diagnosis of ILI, SARI, bronchiolitis and pertussis syndrome, collected in the sentinel hospitals and ambulatory services of all provinces and sent to the National Reference Laboratory (NRL) at the Institute of Tropical Medicine “Pedro Kouri” (IPK), for diagnosis and surveillance of MAARI with possible viral etiology, between January / 2011 and December / 2017. For the detection of RSV and influenza viruses a Reverse Transcriptase Polymerase Chain Reaction assay (RT-RCP) was used [22]. The data of climatic variables were obtained from the climate station network of the Meteorology Institute in the period 1981-2010 for the baseline and 2011-2017 for the current conditions.
Statistical methods
Complex climatic indexes (BIr,t,) developed by Ortiz [20-23] were used. The expression is generated from the analysis of time series of the climatic variables, applying techniques of multivariate analysis of principal components to generate the weights or contributions of the variables to each index, obtaining the orthogonal functions. Interpretation of Bultó complex climate indexes BI1,t,c describes inter-monthly and inter-seasonal variation; includes maximum and minimum mean temperature, precipitation, atmospheric pressure, vapor pressure, and relative humidity. BI2,t,c describes seasonal and inter-annual variation; includes solar radiation and sunshine duration as factors that affect temperature and humidity. Positive values are associated with a high solar energy level.
Interpolation method for the spatial structure: to this analysis, a mesh with continuous information of 600 nodes (Raster format) was generated. It means, transforming the information of a finite number of samples in a continuous space that allowed to know the variation pattern in the area and compare with those observed in the studied sample [23] as well as to characterize areas where information was not available. For that, the Kriging method combined with the method of the inverse distance (IDM) was implemented with the objective of interpolating, to have information in the whole study domain, with a resolution of 20 km2 [23]. For create multiannual graphics, the software SigmaPlot 10.0 style Filled Contour Plot (plots data values in 2D space filing in the area between contour levels) was used. The box plot and line plot of multiple variables graphics were performed using Statistical and Excel 2007. For statistical analysis the software S-Plus 2000, GS-plus 10.0 and SIG ArcGIS 10.1 were used. For processing of the series trends WinStat.V1.0 software was used.
During the period 2011-2017, an annual average of 6 354 971 MAARI was reported in Cuba. Near half million MAARI are reported monthly every year. In (Figure 1) the serial shows an annual bimodal curve, with a main peak in October and another small in March. But a variation of this patter is observed among the different years of the series analyzed (Figure 2). The biggest concentration of MAARI during September-November was detected during 2014-2015, while in January to March the higher was in 2015. When analyzing the contribution of respiratory viruses to this MAARI behavior (Figure 3), the biggest increase during September-November matches with the higher circulation of RSV. Influenza viruses circulate more during June-August, with a higher peak in July, months in which there is not a big increasing in the report of MAARI. On the contrary, during the curve corresponding with January-April no important increment of Influenza or RSV are detected. By age groups a different pattern is observed. The MAARI increasing during January-April in 2015-2016 afected more to 20-59 and ≥ 60 y-o age groups. Meanwhile, 2012-2015 increasing of MAARI during September-November affected more to 0-4 and 5-19 y-o age groups, but all age groups showed an increment. In the other hand, only 5-19 y-o group showed an important MAARI intensification during May-July in the 2012 season, while ≥ 60 y-o were more affected in 2017 (Figure 4). In a monthly variation in MAAIR is observed, with a changing distribution in time and space throughout the country. Provinces belonging to the central region show the higher figures of MAARI. Those are the areas with the higher climatic variability (Figure 5). Regarding the BI (Figure 6), the biggest climatic variability is observed during the months October to April, corresponding to the no-rainy season, including April and October as transitional months. It matches with the increasing of MAARI in both main and secondary peaks of the curve.
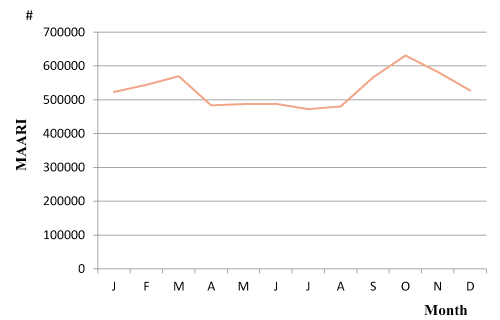
Figure 1. Medical attended acute respiratory infections. Cuba, 2011-2017
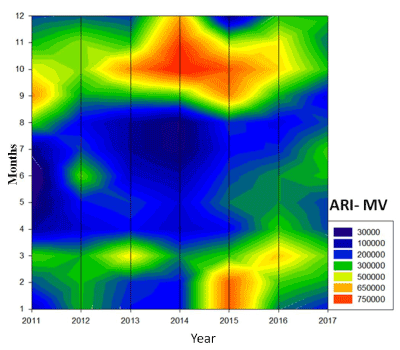
Figure 2. Multiannual variation of ARI. Cuba, 2011-2017
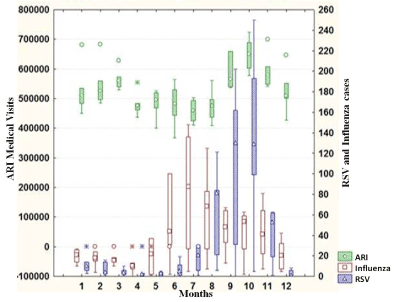
Figure 3. Relationship of ARI-MV reports with the diagnoses of Influenza viruses and RSV
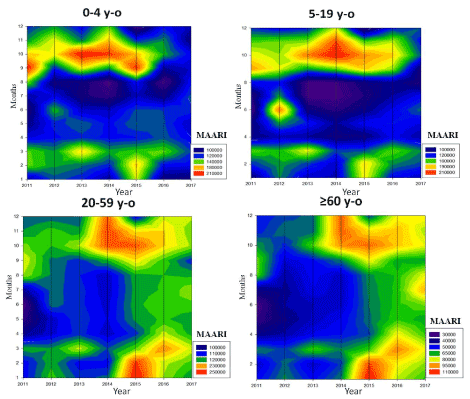
Figure 4. Multiannual variation of MAARI by age groups. Cuba, 2011-2017
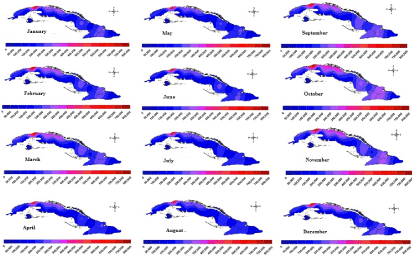
Figure 5. Spatial and temporal distribution of medically attended acute respiratory infections
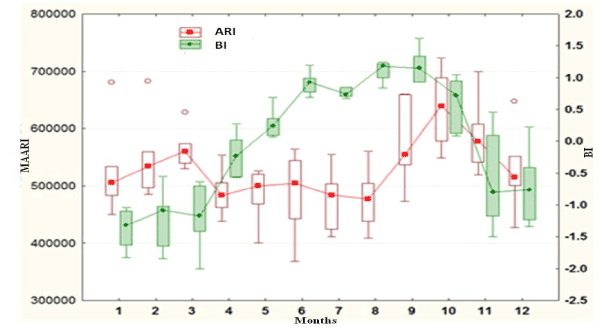
Figure 6. Climatic bultó index and medically attended acute respiratory infections
As a tropical country, in Cuba respiratory viruses circulate during the whole year. However, a higher circulation of RSV has been evidenced between August and November, whereas Influenza levels increase more during June to August. The bimodal curve observed in MAARI during the study period was also reported by other authors in the last 40 years [24-26]. It is remarkable that MAARI reports also increased through January-March, months that does not correspond with the highest circulation levels of Influenza or RSV in the country. This gives us the idea of the important contribution of the other respiratory viruses (ORV) to the burden of ARI in the country. During the study period, laboratory surveillance has reported a high circulation level of Human Rhinovirus (HRV) (23% average up to the virus positive samples) and Human Parainfluenza Viruses (HPIV) (11%). Both circulate during the whole year with frequent increasing throughout the first semester; but in the years 2012, 2015 and 2017 an increased level of HRV was detected in the second half of the year [27-32].
Usually, ORV yield lighter symptoms and are diagnosed as common cold; so, samples for virological diagnosis are not regularly taken from those patients as part of laboratory surveillance. That justifies why the curve of viruses’ circulation doesn't usually belong together with the MAARI reported during the first peak of the year. On the contrary, most of the samples sent to the laboratory for virological diagnostic correspond to hospitalized patients due to SARI (generally pneumonia and bronquiolitis) or coming from ILI outbreaks. In those, Influenza viruses and RSV (in children under 5 years old) are more frequently detected.
When we analyze BI in the study period, the largest climate variations appear during the transition months (March and October-November), and coincides with the highest reports of MAARI: the main curve mainly due to RSV in October-December and the secondary curve in January-March, when no important increasing of influenza viruses or RSV are detected. In Cuba, ORV circulate usually in a similar way during the whole year, while influenza and RSV have a more evident seasonality, even in a tropical climate, as reported in other paper [15,17,19,20,33].
In a report from Canada on hospitalization burden attributable to respiratory viruses, RSV was identified in 66% of respiratory admissions attributed to the virus in pediatric patients, though in only 9% for adults. For ORV, viral identification rates were lower at 15% for pediatric patients and 7% for adults [6]. However, in a study of young children attending day care centers in Sao Paulo, Brazil, 37.6% of the samples were positive for at least one of the respiratory viruses analyzed and the most frequent viruses detected were Human Rhinoviruses (HRV) (37,7%), RSV (20,7%) and FluB (17,3%) [34]. Another study in the same city in hospital-based children reported respiratory viruses’ detection in 54.4% of the samples, being RSV the most detected (29%) from the positive samples. HRV was identified in 23.1% and the rest of viruses in minor proportions [35]. In Africa, according to a systematic review with meta-analysis [36], the pooled prevalence of RSV was 14.6% in people with ARI. It was higher in children (18.5%) compared to adults (4.0%).
Although less studied that in temperate climates, there are some reports associating the rainy seasons in tropical and subtropical climates with ARI increasing [16,35,37-39]. However, in Cuba, besides the higher peak during September –November, there is a secondary peak during January-March corresponding with dry season. This period is the coolest and driest in the country, and this increasing could be influenced by the winter in north hemisphere, when a great number of tourists are visiting our nation and could spread respiratory viruses. As showed, ORVs are the predominant in that period and are mostly detected in adult people. Another factor that could be influencing in the MAARI increasing during the two described periods is the crawl of air contaminants from North America by north winds. During November to March, a high concentration of Carbon Monoxide and Sulfurate Dioxide has been detected in the country as a result of that crawl [40], which combined with the lower temperatures during that period, could influence in the increasing of respiratory infections.
During September-October, besides of weather conditions of the rainy season, the scholar course just begins in the country and children are overcrowded when RSV season is more active; so, the virus spread increases in pediatric population. But adults are also returning to job places after summer vacations, and they could be them infected by any virus, mostly influenza and ORV. That justify that great epidemic period during those months which include all age groups. The distribution of MAARI suggests a heterogeneous pattern with an infection effect with different densities and dispersion grades for different months and seasonal periods, as well as different areas. The bigger variations of the BI and the high circulation of the virus and increment of MAARI are present in the months of the rainy period. In those months, there are favorable conditions for the supersaturation and condensation in the airways, with a pH reduction acidifying the respiratory tract, as well as the epithelial lining fluid in local areas of the airways [41]. That could propitiate a weakness of the defense mechanisms in the airways, provoking cough, bronchial spasm, neurogenic inflammation and dysfunction [42,43]. Population becomes then more susceptible to respiratory viral infections. On the other hand, the spatial structure shows the central region with the highest figures of MAARI, which could be associated with the biggest climatic variability. The central region has the more plain areas and due to its physique-geographical position, there is high humidity, with serial many days with precipitation associated to centers of low pressures, high cloudiness with low heatstroke, diminishing this way the brightness [44]. Those are conditions favorable to the circulation of respiratory virus causing ARI [19,23].
We conclude that RSV adds a great burden to the health care in Cuban population, mostly in pediatric ages, during September to November. Those months belong to the transition period, with increasing of climatic variability. It seems that ORV also contributes an important burden to the MAARI, and are affected by the climatic variability, aspect that should be studied in deep. A high influenza virus circulation was evidenced during July, when less climatic variations are present, and contributing in minor degree to the ARI burden of the country.
- Lozano R, Naghavi M, Foreman K, Lim S, Shibuya K, et al. (2012) Global and regional mortality from 235 causes of death for 20 age groups in 1990 and 2010: A systematic analysis for the Global Burden of Disease Study 2010. Lancet 380: 2095-2128.[Crossref]
- WHO (2018) World health statistics 2018: Monitoring health for the SDGs, sustainable development goals. Geneva: World Health Organization. Available from: https://www.who.int/gho/publications/world_health_statistics/2018/en/
- Lafond KE, Nair H, Rassoly MH, Valente F, Booy R, et al. (2016) Global role and burden of influenza in pediatric respiratory hospitalizations, 1982-2012: A systematic analysis. PLoS Med 13: e1001977. [Crossref]
- Rahman M, Wong K, Hanafiah A, Isahak I (2014) Influenza and respiratory syncytial viral infections in Malaysia: Demographic and clinical perspective. Pak J Med Sci 30: 161-165. [Crossref]
- Benguigui Y (2002) As infecções respiratórias agudas na infância como problema de saúde pública. Boletim de Pneumologia Sanitária 10: 13-22.
- Schanzer DL, Saboui M, Lee L, Nwosu A, Bancej C (2018) Burden of influenza, respiratory syncytial virus, and other respiratory viruses and the completeness of respiratory viral identification among respiratory inpatients, Canada, 2003- 2014. Influenza Other Respi Viruses 12: 113-121. [Crossref]
- Moreira LP, Watanabe ASA, Camargo CN, Melchior TB, Granato C, et al. (2018) Respiratory syncytial virus evaluation among asymptomatic and symptomatic subjects in a university hospital in Sao Paulo, Brazil, in the period of 2009-2013. Influenza Other Respi Viruses 12: 326-330. [Crossref]
- Ng S, Gordon A (2015) Influenza Burden and Transmission in the Tropics. Curr Epidemiol Rep 2: 89-100. [Crossref]
- Nair H, Brooks WA, Katz M, Roca A, Berkley JA, et al. (2011) Global burden of respiratory infections due to seasonal influenza in young children: a systematic review and meta-analysis. Lancet 378: 1917-1930. [Crossref]
- Hernández M, Barahona G, González N, Palacio P (2014) Influenza: Why the need for a tetravalent influenza vaccine?Alergia, Asma e Inmunología Pediátricas 23: 39-46.
- Gil-Prieto R, Gonzalez-Escalada A, Marin-Garcia P, Gallardo-Pino C, Gil-de-Miguel A (2015) Respiratory syncytial virus bronchiolitis in children up to 5 years of age in Spain: Epidemiology and Comorbidities. An Observational Study. Medicine (Baltimore)94: e83. [Crossref]
- ChittaganpitchM, Waicharoen S, Yingyong T, Praphasiri P, Sangkitporn S, et al. (2018) Viral etiologies of influenza-like illness and severe acute respiratory infections in Thailand. Influenza Other Respi Viruses 12: 482-489. [Crossref]
- Moreira LP, Watanabe ASA, Camargo CN, Melchior TB, Granato C, et al. (2018) Respiratory syncytial virus evaluation among asymptomatic and symptomatic subjects in a university hospital in Sao Paulo, Brazil, in the period of 2009-2013. Influenza Other Respir Viruses 12: 326-330. [Crossref]
- Lam H, Ayres JG (2011) Climate change and lung disease – With special focus on developing countries. SK J, editor. New Delhi (India): Jaypee Brothers Medical Publishers.
- Yang W, Cummings MJ, Bakamutumabo B, Kayiwa J, Owor N, et al. (2018) Dynamics of Influenza in Tropical Africa: Temperature, Humidity, and Co-circulating (sub)types. Influenza Other Respi Viruses 12: 446-456. [Crossref]
- Alonso WJ, Guillebaud J, Viboud C, Razanajatovo NH, Orelle A, et al. (2015) Influenza seasonality in Madagascar: the mysterious African free-runner. Influenza Other Respir Viruses 9: 101-109. [Crossref]
- Caini S, Andrade W, Badur S, Balmaseda A, Barakat A, et al. (2016) Temporal patterns of influenza A and B in tropical and temperate countries: what are the lessons for influenza vaccination? PLoS One 11: e0155089. [Crossref]
- Durand LO, Cheng PY, Palekar R, Clara W, Jara J, et al. (2016) Timing of influenza epidemics and vaccines in the American tropics, 2002-2008, 2011-2014. Influenza Other Respir Viruses 10: 170-175. [Crossref]
- Vega YL, Ramírez OV, Herrera BA, Ortiz-Bulto PL (2017) Impact of climatic variability in the respiratory syncytial virus pattern in children under 5 years-old using the bulto climatic index in Cuba. Int J Virol Infect Dis 2: 14-19.
- Ortiz-Bulto PL, Vega YL, Ramírez OV, Herrera BA, Gutiérrez SB (2017) Temporal-spatial model to predict the activity of respiratory syncytial irus in children under 5 years old from climatic variability in Cuba. Int J Virol Infect Dis 2: 30-37.
- INSMET (2013) Impacto del Cambio Climático y Medidas de Adaptación en Cuba. Planos E, Vega R, Guevara A, editors. La Habana, Cuba.: Instituto de Meteorología, Agencia de Medio Ambiente, Ministerio de Ciencia, Tecnología y Medio Ambiente.
- Arens MQ, Buller RS, Rankin A, Mason S, Whetsell A, et al. (2010) Comparison of the Eragen Multi-Code Respiratory Virus Panel with conventional viral testing and real-time multiplex PCR assays for detection of respiratory viruses. J Clin Microbiol 48: 2387-2395. [Crossref]
- Vega YL, Paulo LB, Acosta BH, Valdés OR, Borroto SG, et al. (2018) Influenza's response to climatic variability in the tropical climate: Case Study Cuba. Virol Mycol 7: 2.
- González E, Martínez S, Goyenechea A, Texidor J, Silot A (1987) Some aspects about the epidemiological observance of the acute respiratory diseases in Havana. La Santé Publique 4: 317-327.
- Pirez M (2012) Caracterización de la morbilidad y mortalidad por Infecciones Respiratorias Agudas en Cuba. 2002-2015. [Máster en Epidemiología]. La Habana: Pedro Kourí Institute of Tropical Medicine.
- Coutin G, Sacerio Z, Hernández PL, Abreu Y (2006) Pronósticos de Infecciones Respiratorias Agudas. Cuba, 1996-2006. Reporte Técnico de Vigilancia 11: 1-13.
- Borroto S, Acosta B, Savón C, Piñon A, Pérez K (2013) Vigilancia de las Infecciones Respiratorias Agudas en Cuba, 2012. BolIPK: 23.
- Borroto S, Armas L, Acosta B, Savón C (2014) Vigilancia de las Infecciones Respiratorias Agudas. Cuba, 2013. BolIPK: 24.
- Borroto S, Armas L, Acosta B, C S (2015) Vigilancia de las Infecciones Respiratorias Agudas. Cuba, 2014. BolIPK: 25.
- Borroto S, Armas L, Acosta B, Valdés O (2016) Vigilancia de las Infecciones Respiratorias Agudas. Cuba, 2015. BolIPK: 26.
- Borroto S, Armas L, Acosta B, Valdés O (2017) Vigilancia de Infecciones Respiratorias Agudas en Cuba. 2016. BolIPK: 27.
- Borroto S, Valdés O (2018) Vigilancia de infecciones respiratorias agudas. Cuba, 2017. BolIPK: 28.
- Yu H, Alonso WJ, Feng L, Tan Y, Shu Y, et al. (2013) Characterization of regional influenza seasonality patterns in China and implications for vaccination strategies: spatio-temporal modeling of surveillance data. PLoS Med 10: e98615. [Crossref]
- Bonfim CM, Nogueira ML, Simas PVM, Gardinassi LGA, Durigon EL, et al. (2011) Frequent respiratory pathogens of respiratory tract infections in children attending daycare centers. J Pediatr 87: 439-444. [Crossref]
- Gardinassi LG, Simhas PVM, SalomãoJB, Durigon EL, Zanetta DN, et al. (2012) Seasonality of viral respiratory infections in southeast of Brazil: the influence of temperature and air humidity. Braz J Microbiol 43: 98-108. [Crossref]
- Kenmoe S, Bigna JJ, Well EA, Simo FB, Penlap VB, et al. (2018) Prevalence of Human Respiratory Syncytial Virus infection in people with acute respiratory tract infections in Africa: A systematic review and meta-analysis. Influenza Other Respir Viruses 12: 793-803. [Crossref]
- Saha S, Chadha M, Shu Y (2016) Divergent seasonal patterns of influenza types A and B across latitude gradient in Tropical Asia Influenza Other Respir Viruses 10: 176-184. [Crossref]
- de Longueville F, Hountondji YC, Djivo VP, S H (2013) Relations potentielles entre infections respiratoires aiguës basses et conditions meteorologiques au Benin. Environ Risque Sante 12: 139-150.
- Correal ME, Marthá JE, Sarmiento R (2015) Influencia de la variabilidad climática en las enfermedades respiratorias agudas en Bogotá. Biomédica 35: 130-138.
- Google. Windy.com - Weather radar and forecast - On line. Available from: www.windy.com.
- Ishmatov A (2017) On the connection between supersaturation in the upper airways and «humid-rainy» and «cold-dry» seasonal patterns of infl uenza. PeerJ PrePrints. Available from: https://peerj.com/preprints/2859.pdf.
- Hoffmeyer F, Berresheim H, Beine A, Sucker K, Bruning T, et al. (2015) Methodological implications in pH standardization of exhaled breath condensate. J Breath Res 9: 036003. [Crossref]
- Ricciardolo FL, Gaston B, Hunt J (2004) Acid stress in the pathology of asthma. J Allergy Clin Immunol 113: 610-619. [Crossref]
- Lecha EL, Paz RL, Lapinel PB (1994) El Clima de Cuba. La Habana, Cuba: Editorial Academia.


