Background: Item analysis helps to ascertain the quality of multiple choice questions (MCQs), which are frequently used to assess the performance of students due to its objectivity and wide coverage of the subject in a short time. This study investigated test analysis of MCQs from a formative assessment of first year microbiology major students.
Methods: The cross-sectional study was conducted at Bayelsa Medical University, Yenagoa, Nigeria in November 2020, with 42 first year microbiology students. The paper analysis consists of 60 single best choice MCQs with 5 options each (made up of 1 key and 4 distractors). Items having values of ≥20 and 30 – 70% were considered to have good discriminator and difficulty index respectively and distractors were considered ineffective when <5% of the students chose it.
Results: The mean score was 27.21 ±SD (maximum 60 marks), 70% had acceptable and above discrimination index, 61.67% had good difficulty index and 75.83% of the distractors were functional. Overall, 40.0%, 35.0%, 16.7%, 5.0% and 3.3% had 0, 1, 2, 3 and 4 non-functional distractors, respectively. The difficulty index showed positive significant relationship with the discrimination index at p<0.05. The key distribution was equal, while the distribution of the total score showed few good students with the distribution curve being fairly symmetrical. Cronbach’s alpha (internal consistency) was 0.866 indicating that the items had good internal consistency and were very good for a class-room assessment.
Conclusion: The items with good difficulty index, acceptable and above discrimination power and zero non-functional distractors should be selected to assess knowledge, while the other items should be subjected to item flaws and technical pitfall analysis in order to be modified or changed accordingly. The need for preview of MCQs before the examination and review of the students’ responses are critical for reliable MCQ examination.
Assessment, Discrimination index, Distractor efficiency, Difficulty index, Reliability index, MCQs
One of the challenges of departments in the sciences especially microbiology is to teach adequate knowledge and practical skills and help students develop analytical and professional skills, and this is achieved through teaching, learning and assessment [1]. Assessment when done correctly is a powerful tool that facilitates learning outcomes, achievement of educational goals and ensures the students observe the effectiveness of the educational programme [2]. Teaching methods are also modified based on the results of assessment in order to achieve the desired learning outcomes [3]. Knowledge can be tested using different tools viz, short answer essay questions, long answer essay questions, key feature questions among others but multiple choice questions (MCQs) is one of the widely used tools for the assessment of students performance in an examination due to its simplicity, objectivity, reliability and coverage of a wider spectrum of the curriculum [4].
MCQs when prepared correctly, can adequately evaluate a wide curriculum in a short period of time and is preferred by examiners because it is easier to administer [4,5]. It has been found to be more objective and less discriminating as compared to free response tasks particularly in the way they are graded because all students are expected to score equal marks to a particular correct response [6].
MCQs also provide information about understanding, knowledge, and the analysing power of students and can thus identify the weaknesses and strengths of the students’ understanding of a topic [5]. This single best response by students does not only identify the students’ ability (i.e very good, good, average or weak/poor) but also provides useful feedback to teachers which are vital for improving teaching methods [3]. MCQs when prepared correctly can be used to test all levels of the cognitive domain but there were criticisms that it was known to only test the recall level of sheer facts. However, it has been proven to be able to also test higher order cognitive domains like application and synthesis as well as discriminate between students if constructed properly [7]. Therefore, it is important to have excellent distractors, defensibly correct keys and a good stem that will incorporate the different levels of learning and their corresponding directive verbs in each learning domain [8].
It seems relatively easy to design MCQs, however it is extremely challenging and time consuming to design them correctly. No single assessment tool is perfect and can cover all aspects of students’ competence and performance accurately as every tool has its strengths and weaknesses [9]. The challenges with MCQs are designing items with ambiguous stem, multiple correct answers, controversial answers, give away keys, poor distractors, high probability of guessing the correct answers among others. However, the use of item analysis (statistics to examine students’ answers and test items to assess quality of items and the test as a whole) can provide the relevant information needed for improving the quality and effectiveness of MCQs [10].
Item analysis is used to assess the quality of the MCQs with respect to the difficulty index (how difficult the items are), discrimination index (how the responses of students with high ability differs with students with low ability) and distractor efficiency (the quality of distractors used). Also, the internal consistency (Cronbach’s Alpha) of responses among items is a good measuring concept [11], as it provides useful information about the reliability level of the items. Test analysis can also be carried out on the students’ responses to items to determine the distribution curve. The outcome of the item analysis provides information about the performance of the students and the reliability of the test. This is because items with non-functional distractors tend to make the questions very cheap.
Item analysis is often carried out in the medical and health-related disciplines but information about it in other disciplines like Faculties of Science, Agriculture, Engineering, Education, Social Sciences, Humanities/Art, Management sciences, etc is scanty. Microbiology is one of the disciplines domiciled in the Faculty of Science in many Nigerian Universities. Over the years the study of Microbiology has evolved due to its multifaceted nature and the ubiquitous nature of microorganisms. The study of microbiology involves different approaches including didactic lectures and practical exercises, seminars, viva voce, among others. Of these, students are often assessed by teachers using different approaches including written examination (MCQ, practical and essay examinations) and oral examination (viva voce). Oral examination is mostly carried out as part of clinical examinations in medical disciplines and at the terminal level during project defence, while MCQs and essays are the most commonly used forms of assessment in semester examinations. Owing to the widespread use of MCQs for assessing students’ performance, there is the need for item and test analysis of questions so as to identify vague and defective items and improve on them. Item analysis of MCQs is important in the process of improving the quality of MCQs in both formative and summative examinations.
The aims of this study were to analyse the quality of MCQs items of first year microbiology major students and evaluate the relationship between the major item determinants (difficulty and discrimination indices and distractors efficiency), and reliability (Cronbach’s Alpha) of each item, and the outcome of the test. The outcome will help the teachers in the field to improve the quality of questions designed.
After the first semester lectures based on didactic teaching of Introductory Microbiology in the Department of Microbiology, Bayelsa Medical University, all 42 first year Microbiology major students took part in a summative examination in November 2020. The examination consisted of single best response MCQs with 60 questions. Each correct response was awarded 1 mark and no marks were awarded for blank or incorrect answers thus the minimum and maximum possible score of the MCQs examination were 0 and 60, respectively. Marks were not deducted for wrong answers and the pass mark for the examination was 40%. The total score of each student were arranged in ascending order of performance.
Item analysis was carried out using discrimination and difficulty indices and distractor efficiency calculations. The discrimination index, difficulty index and distractor efficiency were carried out according to the method previously described by Hingorjo and Jaleel [12], Gajjar, et al. [5] and Rao, et al. [4]. For the discrimination index and difficulty index the students’ scores are arranged in the order of merit and divided into 3 groups of 27% (upper one-third students, H), 46% (middle group) and 27% (lower one-third students, L). The upper and lower one-third students with 11 students each were used to calculate the discrimination and difficulty indices.
Difficulty index (P) =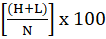 ------------------------------ (i)
Discrimination index (DI) = ------------------------- (ii)
Where N is the total number of students in both high and low groups, and H and L are the numbers of correct responses in high and low groups, respectively. The criteria for grouping difficulty index ranged from 0 – 100%. Classification of the difficulty index was p <30 (difficult), p=30–70 (ideal) and p>70 (easy) [4]. Discrimination index criteria ranged from 0 – 1. Classification of the discrimination index was D =0.00 – 19.00, D=0.20–0.29, D=0.30–0.39 and D> 0.40 indicating poor, acceptable, good and excellent discrimination, respectively while a negative D discrimination index indicated a defective item or wrong key.
Each of the items contained a stem and 5 options (including 1 key and 4 distractors), and a distractor is considered non-functional when <5% of the students select it. The distractor efficiency ranges from 0.00 – 100.00%. If an item contains four, three, two, one and zero non- functional distractors, then the distractor would be 0.00%, 25.00%, 50.00%, 75.00% and 100.00% respectively [12].
Statistical analysis of the data was carried out using SPSS version 20 and Microsoft excel. The Data was subjected to descriptive statistics (skewness, kurtosis, percentages, frequency, mean, standard deviation, minimum and maximum), Pearson’s correlation and reliability index (Cronbach’s alpha). The outputs were presented in tables and charts (histograms with super imposed binomial distribution curve and bar chart).
Table 1 shows the summary of the discrimination index, difficulty index and distractor efficiency of the first year Microbiology major students’ MCQs examination. The discrimination index ranges from -0.09 – 0.91 (mean ± SD 0.37 ± 0.25). Of the 60 items, 24 (40.0%), 10 (16.7%), 8 (13.3%), 17 (28.3%) and 1 (1.70%) had excellent, good, acceptable, poor discrimination index and defective item (Figure 1). On the overall, 70.0% of the items had acceptable or higher discrimination index. This is an indication that these items can be used effectively to distinguish between good and weak students. One of the items had a negative discrimination power which usually reduces the reliability and validity of the items, and should be removed from the question bank to prevent negative washback effect [4]. This is because low performing students got the item correctly more than the good students contrary to the expectations [12, 13]. This may be due to wrong key, vague framing of items or generalized poor preparation of the students. Two other items had zero discrimination index, an indication that the two groups of students got the items right or wrong hence, the need to remove the two items from the question bank [13].
Figure 1. Percentage distribution of discrimination index of MCQs among first year students of Microbiology programme
Table 1. Summary of descriptive statistics of discrimination index, difficulty index and distractor efficiency of MCQs among first year student of Microbiology programme
Parameters |
N |
Minimum |
Maximum |
Mean |
Standard Deviation |
Difficulty index |
60 |
9.09 |
90.91 |
46.89 |
21.90 |
Distractor efficiency |
60 |
0.00 |
100.00 |
75.83 |
26.02 |
Discrimination index |
60 |
-0.09 |
0.91 |
0.37 |
0.25 |
The discrimination index recorded in this study showed some similarity with some of the discrimination index criteria presented by other authors. Rao, et al. [4] reported that 60.0%, 10.0%, 15.0% and 15.0% had excellent, good, acceptable and poor discrimination index among second year MBBS students that took an MCQ test in pathology. Also, the acceptable and above discrimination index criteria recorded is similar to previous works that recorded a value of 62.5% [13,14], 88.0% [12] , 83.0% [15] and higher than the values of 48.0% [5]. Also, the overall mean values had some similarity with previous works that recorded values of 0.34 [4], 0.29 [14], 0.35 [15], and higher than the values of 0.14 [5] and 0.19 [11]. This suggests that the quality of the MCQs is similar to the ones served to students of other disciplines by their teachers in different parts of the world.
The difficulty index ranges from 9.09 – 90.91% (mean ± SD 48.89 ± 21.90%). Of the 60 items, 37 (61.7%), 9 (15.0%) and 14 (23.3%) had good, easy and difficult difficulty indices respectively (Figure 2). The higher the difficulty index the lower the difficulty of the items [4]. The mean values of the difficulty index recorded had some similarity with previous works with values of 50.16% [4], 58.74% [15], 55.90% [14], 57.62 [13], 49.00% [11], and higher than the values of 39.40% [5]. Based on the criteria for classification, the values recorded also had some similarity with previous works. For instance, percentage of 5.00%, 10.00% and 85.00% were easy, difficult and acceptable, respectively [4], 20.00%, 32.00%, 24.00% and 24.00% were easy, difficult, good and excellent, respectively [5], 4.00%, 28.00%, 60.00% and 8.00% were good to excellent, acceptable, to easy, too difficult, respectively [5], 81.00%, 17.00% and 2.00% were acceptable, easy and difficult, respectively [15], 33.20%, 34.10% and 32.70% were easy, desirable and difficult, respectively [11] and 32.50%, 52.50% and 15.00% were too easy, averagely difficult and too hard, respectively [13]. In this study more than half of the items (61.67%) fall under the recommended and acceptable range which indicates that the questions were moderately easy. This implies that the teachers covered the course content and/or the students studied really well. However, 9 items were found to be easy which may imply distractor inefficiency and those items need to be redesigned or as Brown [17] suggests, these easy items can function as warm-up items and motivate the low achieving students giving them a feel of success and thus a positive washback effect as described by Alderson and Wall, [18]. Also 14 items were found to be difficult which can pose a challenge even for the intelligent students and therefore needs to be revised.
Figure 2. Percentage distribution of the difficulty index of MCQs among first year student of Microbiology programme
The distractor efficiency ranges from 0.00-100.00% (mean ± SD 75.83 ± 26.02%). Based on the distribution of the distractors, 24 items (40.0%,) 21 items (35.0%), 10 items (16.7%), 3 items (5.0%) and 2 items (3.3%) had 0, 1, 2, 3, 4 non-functioning distractors, respectively (Figure 3). On the overall, 58 (24.17%) and 182 (75.83%) were non-functional and functional distractors, respectively. The distractor effectiveness of the items in this study is close to previous reports with values of 63.85% [19], 63.55% [13], and lower than the values of 89.99% reported by Rao, et al. [4], 84.94% reported by Patel [14] and 89.60% reported by Gajjar, et al. [5].
Figure 3. Percentage distribution of the distractor efficiency according to criteria
In addition, authors have reported 1, 2, 3 and 4 non-functional distractors with a frequency of 7.69%, 30.77%, 60.00% and 1.54%, respectively [19]. Also, other reports that had only 3 distractors reported percentages of 0, 1, 2 and 3 non-functional distractor as 65.00%, 25.00%, 10.00% and 0.00% respectively [14], 25.00%, 46.00%, 25.00% and 5.00%, respectively [15]. According to Charania, et al. [20], Gajjar, et al. [5], analysis of incorrect options are usually carried out to ascertain the relative usefulness of items. As such items that a significant number of students (<5.00%) failed to select needs to be modified or removed. Furthermore, an increase in the number of non-functional distractors in an item elevates the difficulty index and reduces the distractors’ efficiency, while a decrease in the number of non-functional distractors of an item increases distractors’ efficiency [5]. Since the higher the distractors efficiency the more difficult the item could be, hence the number of non-functioning distractors influences the difficulty index of an item.
The correlation between the discrimination index, difficulty index and distractor efficiency of MCQs among first year students of Microbiology programme is shown in Table 2. Pearson’s correlation showed that the difficulty index positively correlates with the discrimination index (r=0.261; p<0.05) and negatively correlates with the distractor efficiency (r=-0.654; p<0.01). This indicates that similar factors are influencing both discrimination and difficulty indices. This trend has been earlier reported by Rao, et al. [4]. According to Gajjar, et al. [5], Rao et al. [4], difficulty and discrimination indices are reciprocally related. Also, the number of non-functional distractors affects the discrimination power of an item. Gajjar, et al. [5] also reported that easy items discriminate poorly and difficult items are good discriminators except both group of students (high and low scorers) answered it correctly.
Table 2. Pearsons’s correlation between the difficulty index, discrimination index and distractor efficiency of MCQs among first year students of Microbiology programme
Parameters |
Difficulty index |
Distractor efficiency |
Discrimination index |
Difficulty index |
1 |
|
|
Distractor efficiency |
-0.654** |
1 |
|
Discrimination index |
0.261* |
-0.041 |
1 |
**. Correlation is significant at the 0.01 level (2-tailed).
*. Correlation is significant at the 0.05 level (2-tailed).
N=60
The internal consistency (Cronbach’s Alpha) of MCQs among the first year students of Microbiology programme is 0.866 (Table 3), while the Cronbach’s alpha if an item is deleted is above 0.800 for each of the 60 items (Table 4). The values are within the range of 0.80 – 0.90 which is classified as very good for a class room assessment by Patel [14]. Thus, the coefficient of alpha value is high suggesting that students who answered an item correctly were more likely to answer other items correctly [14]. When an item is deleted, the reliability of the 12 items representing 20% increases, an indication that the item is problematic and decreases test reliability. Hence, the 12 items of which 10 and 2 of it has poor and acceptable discrimination power, respectively should be removed or modified. The values of Cronbach’s alpha recorded in this study is higher than the values of 0.702 and 0.740 reported by Patel [14] and Sharif, et al. [11], respectively in different areas in the world. Also analysis of variance showed that there is significant variation (p=0.000) between the items (Table 5).
Table 3. Reliability index of MCQs among first year student of Microbiology programme
Reliability Statistics |
Cronbach's Alpha |
No. of Items |
0.866 |
60 |
Table 4. Reliability index of MCQs among first year students of Microbiology programme
Items |
Scale Mean if Item Deleted |
Scale Variance if Item Deleted |
Corrected Item-Total Correlation |
Cronbach's Alpha if Item Deleted |
1 |
26.452 |
77.278 |
0.544 |
0.860 |
2 |
26.405 |
80.198 |
0.173 |
0.866 |
3 |
26.738 |
79.174 |
0.240 |
0.865 |
4 |
26.810 |
78.695 |
0.300 |
0.864 |
5 |
26.595 |
80.296 |
0.119 |
0.867 |
6 |
26.571 |
80.251 |
0.127 |
0.867 |
7 |
26.691 |
77.341 |
0.449 |
0.862 |
8 |
26.548 |
77.278 |
0.487 |
0.861 |
9 |
26.833 |
78.093 |
0.374 |
0.863 |
10 |
26.952 |
78.827 |
0.324 |
0.864 |
11 |
26.571 |
79.519 |
0.212 |
0.866 |
12 |
27.000 |
78.683 |
0.371 |
0.863 |
13 |
27.000 |
78.146 |
0.445 |
0.862 |
14 |
26.262 |
80.735 |
0.208 |
0.865 |
15 |
26.786 |
78.075 |
0.368 |
0.863 |
16 |
27.119 |
80.254 |
0.234 |
0.865 |
17 |
26.333 |
79.691 |
0.306 |
0.864 |
18 |
26.571 |
78.202 |
0.367 |
0.863 |
19 |
27.119 |
81.473 |
0.005 |
0.867 |
20 |
27.095 |
80.820 |
0.112 |
0.866 |
21 |
26.571 |
77.470 |
0.455 |
0.862 |
22 |
26.976 |
79.682 |
0.223 |
0.865 |
23 |
26.952 |
79.803 |
0.200 |
0.866 |
24 |
26.595 |
80.588 |
0.086 |
0.868 |
25 |
27.143 |
80.516 |
0.215 |
0.865 |
26 |
26.833 |
80.581 |
0.087 |
0.868 |
27 |
26.667 |
80.130 |
0.133 |
0.867 |
28 |
26.810 |
77.573 |
0.431 |
0.862 |
29 |
26.643 |
75.650 |
0.653 |
0.858 |
30 |
26.786 |
78.026 |
0.374 |
0.863 |
31 |
26.476 |
79.816 |
0.198 |
0.866 |
32 |
26.810 |
79.280 |
0.233 |
0.865 |
33 |
26.810 |
75.621 |
0.662 |
0.858 |
34 |
27.024 |
78.804 |
0.372 |
0.863 |
35 |
26.524 |
78.597 |
0.334 |
0.864 |
36 |
26.881 |
80.351 |
0.118 |
0.867 |
37 |
26.667 |
76.618 |
0.535 |
0.860 |
38 |
26.691 |
83.243 |
-0.207 |
0.873 |
39 |
26.881 |
76.985 |
0.522 |
0.860 |
40 |
26.643 |
77.357 |
0.452 |
0.861 |
41 |
26.643 |
77.308 |
0.457 |
0.861 |
42 |
26.452 |
78.839 |
0.335 |
0.864 |
43 |
27.095 |
81.796 |
-0.053 |
0.868 |
44 |
26.476 |
79.573 |
0.229 |
0.865 |
45 |
26.333 |
80.130 |
0.230 |
0.865 |
46 |
27.119 |
82.303 |
-0.149 |
0.869 |
47 |
26.786 |
79.294 |
0.229 |
0.865 |
48 |
26.905 |
75.942 |
0.665 |
0.858 |
49 |
26.881 |
76.303 |
0.607 |
0.859 |
50 |
27.024 |
79.975 |
0.205 |
0.865 |
51 |
27.071 |
80.702 |
0.119 |
0.866 |
52 |
27.048 |
77.900 |
0.532 |
0.861 |
53 |
26.548 |
78.156 |
0.380 |
0.863 |
54 |
26.738 |
80.881 |
0.050 |
0.868 |
55 |
26.929 |
79.775 |
0.196 |
0.866 |
56 |
26.738 |
78.296 |
0.339 |
0.863 |
57 |
26.667 |
77.740 |
0.405 |
0.862 |
58 |
26.643 |
78.772 |
0.288 |
0.864 |
59 |
27.071 |
81.970 |
-0.079 |
0.869 |
60 |
26.643 |
78.772 |
0.288 |
0.864 |
Table 5. Analysis of variance between Items of MCQs among first year student of Microbiology programme alpha if an item is deleted
|
Sum of Squares |
df |
Mean Square |
F |
Sig |
Between People |
55.751 |
41 |
1.360 |
|
|
Within People |
Between Items |
128.639 |
59 |
2.180 |
11.982 |
.000 |
Residual |
440.177 |
2419 |
.182 |
|
|
Total |
568.817 |
2478 |
.230 |
|
|
Total |
624.568 |
2519 |
.248 |
|
|
Grand Mean = .4536 |
The distribution of the keys is equal (Figure 4) an indication that if a student’s guesses or chooses a particular option throughout, the highest score achievable is 20.0%. The distribution curve (a normal binomial distribution which highlights whether the data under examination has a binomial distribution or not) of the total score of the students MCQs items among first year student of Microbiology programme is shown in Figure 5. The distribution showed that the mean is 27.21 an indication that less students scored below the average. However, based on the pass mark of 40% (24 marks out of 60 maximum marks) more students passed the MCQs examination. Kurtosis and skewness is an important descriptive statistics of data distribution. Skewness provides information about the symmetry of the distribution, while kurtosis determines the heaviness of the distribution tails. The skewness was 0.46, an indication that the distribution curve is approximately or fairly symmetrical while the kurtosis value was -0.46, an indication of platykurtic distribution (with a negative excess kurtosis). The kurtosis reveals a distribution with flat tails, an indication of a small outliers in the distribution. A flat tail to the left shows that few students failed while a flat tail to the right shows that few students scored extremely well. This suggests that there are few students that scored exceedingly well in the examination.
Figure 4. Key distribution of MCQ items among first year students of Microbiology programme
Figure 5. Distribution curve of the total score of the students MCQ items among first year students of Microbiology programme
Multiple choice questions (MCQs) are a very effective assessment tool used to assess the learning outcomes of a teaching programme. Item analysis makes this tool even more effective by evaluating the difficulty of the questions, the ability of the items to discriminate between strong and weak students and indicating areas of the course content that needs revision or modification. Previews of MCQs are able to detect technical flaws in the items and provide relevant information for improvement (clarifying words, strengthening distractors and eliminating ambiguities) as well as increase the item designing skills of the examiners. On the strength of the findings made from this study, it is recommended that examiners carry out preview of items to ensure the quality of the items. Frequent item analysis should also be implemented into future examination to improve the test scores and discriminate effectively among students and also to ensure dependable and reliable item bank for future use. We hope this study will initiate the change towards the development of quality MCQs designed to guarantee reliable and valid test data and significantly enhance the quality of graduates and certification in universities especially in Nigeria.
The authors wish to thank Prof Olu Osinowo of Bayelsa Medical University for the technical assistance.
Ethical approved was obtained from the Research and Ethics Committee of Bayelsa Medical University, Yenagoa, Bayelsa State, Nigeria.
- Habib MA, Talukder HK, Rahman MM and Ferdousi S (2016) Post-application Quality Analysis of MCQs of Preclinical Examination Using Item Analysis. Bangladesh J Medical Education 7: 2-7.
- Odukoya JA, Adekeye O, Igbinoba AO and Afolabi A (2018) Item analysis of university-wide multiple choice objective examinations: the experience of a Nigerian private university. Quality & quantity 52: 983-997.
- Velou MS, Ahila E (2020) Refine the multiple-choice questions tool with item analysis. International Archives of Integrated Med 7.
- Rao C, Prasad HK, Sajitha K, Permi H and Shetty J (2017) Item Analysis of Multiple-Choice Questions: 7Assessing An Assessment Tool In Medical Students. Int J Educational Psychol Res 2: 201-204.
- Gajjar S, Sharma R, Kumar P and Rana M (2014) Item and test analysis to identify quality multiple choice questions (MCQs) from an assessment of medical students of Ahmedabad, Gujarat. Indian J Community Med 39: 17-20.
- Toksöz S, Ertunç A (2017) Item analysis of a multiple-choice Exam. Advances in Language and Literary Studies 8: 141-146.
- McCoubrie P (2004) Improving the fairness of multiple-choice questions: a literature review. Med Teach 6: 709712. [Crossref]
- Case SM, Swanson DB (2001) Constructing Written Test Questions For the Basic and Clinical Sciences, (3rd edn), Philadelphia : National Board of Medical Examiners (NBME).
- Swanwick T (2010) Understanding Medical Education: Evidence, Theory and Practice. London Deanery: Wiley Blackwell Publication, pp: 195-270.
- Ary D, Jacobs LC, Razavieh A (2002) Introduction to in Education, (6th edn), Wadsworth, California.
- Sharif MR, Rahimi SM, Rajabi M, Sayyah M (2014) Computer software application in item analysis of exams in a college of Medicine. ARPN J Sci Technol 4: 565-569.
- Hingorjo MR and Jaleel F (2012) Analysis of one-best MCQs: the difficulty index, discrimination index and distractor efficiency. JP Medical Teacher 2MA-Journal of the Pakistan Medical Association 62: 142 -147.
- Chhaya J, Bhabhor H, Devalia J, Machhar U, Kavishvar A (2018) A study of quality check on multiple choice questions (MCQs) using item analysis for differenciating good and poor performing students. Healthline J 9: 24-29.
- Patel RM (2017) Use of item analysis to improve quality of multiple-choice questions in II MBBS. J Education Technology in Health Sci 4: 22-29.
- Mahjabeen W, Alam S, Hassan U, Zafar T, Butt R, et al. (2017) Difficulty index, discrimination index and distractor efficiency in multiple choice questions. Ann Pak Inst Med Sci 310-315.
- Namdeo SK, Rout SD (2016) Assessment of functional and nonfunctional distracter in an item analysis. Int J Contemporary Medical Res 3: 1891-1893.
- Brown HD (2004) Language Assessment: Principles and Classroom Practices. White Plains, NY: Pearson Education.
- Alderson JC, Wall D (1993) Does washback exist. Applied Linguistics 14, 115-129.
- Chauhan P, Chauhan GR, Chauhan BR, Vaza JV, Rathod SP (2015) Relationship between difficulty index and distracter effectiveness in single best-answer stem type multiple choice questions. Int J Anatomy Res 3: 1607-1610.
- Charania JS (2015) Item analysis of multiple choice questions given to first year medical students-concept building and MCQs. Int J Res Humanities Social Sci 3: 18-29.
Editorial Information
Editor-in-Chief
Article Type
Research Article
Publication history
Received date: June 04, 2021
Accepted date: July 06, 2021
Published date: July 09, 2021
Copyright
©2021 Izah SC. This is an open-access article distributed under the terms of the Creative Commons Attribution License, which permits unrestricted use, distribution, and reproduction in any medium, provided the original author and source are credited.
Citation
Glory Richard, Felix Okponanabofa Youkparigha, Ayobami Omozemoje Aigberua, Sylvester Chibueze Izah and Edah Oghenetega Morayo (2021) Item analysis of Multiple Choice Questions (MCQs) from a formative assessment of first year microbiology major students. Res Rev Insights 5: doi: 10.15761/RRI.1000166.