Erythrocyte deformability is a biorheological influent factor on blood viscosity, cellular oxygenation and a biomarker of acute and chronic inflammation. An inverse relationship between erythrocyte ability to reversibly change its shape with nitric oxide (NO) efflux from erythrocytes was reported in patients with hypercholesterolemia, hypertension and renal transplant. Erythrocyte NO efflux is negatively associated with carotid intima-media thickness and an independent predictor of this structural anomaly. High concentrations of oxidized LDL when in presence of healthy human erythrocytes increase its ability to scavenge NO.
The aim of this work was to evaluate in vitro, the effects on erythrocyte nitric oxide (NO) metabolism and its deformability under presence of lipoproteins LDL /HDL.
Aliquots of healthy human blood samples were enriched, or not (control), with synthetic LDL/HDL solutions ([LDL/HDL]1=18.44/0.776 mg/dL and [LDL/HDL]2=36.88/1.552 mg/dL). NO efflux from erythrocyte and its content on nitrite, nitrate, S-nitrosoglutathione (GSNO), peroxynitrite and its deformability (EEI) were determined. So, from each blood sample three aliquots were made: the control and two different LDL/HDL concentrations.
In the present study, were not observed variations on peroxynitrite levels inside erythrocytes, on the ability to scavenge NO and on EEI at all shear stress when compared to the values obtained in untreated samples. NO mobilization inside erythrocytes of the treated aliquots were showed by the significantly increased of nitrite, nitrate and S-nitrosoglutathione levels in relation to the control aliquots without significant differences between both treated aliquots.
In this in vitro study with erythrocytes obtained from blood samples of healthy human we show that under LDL/HDL addition, maintenance of its membrane deformability, nitric oxide and the nitrogen redox level content. All these results evidence the ability of erythrocytes to answer LDL/HDL binding by increasing NO mobilization with higher nitrite, nitrate and GSNO concentrations. Better understanding of the signal transduction mechanism associated to the erythrocytes binding LDL/HDL receptors may bring potential targets in cases of diminished erythrocyte deformability or impeachment delivery of nitric oxide to alleviate the compromised microcirculation.
The endothelial nitric oxide (NO) liberated to the lumen of the vessel passes through the erythrocyte membrane band 3 protein and is fixed by hemoglobin molecules with generation of S-nitrosohemoglobin (SNO-Hb) [1,2]. Inside erythrocytes the glutathione reacts with NO originating S-nitrosoglutathione (GSNO) [3]. Also NO can react with superoxide anion forming peroxynitrite that decomposes in nitrites and nitrates [4-6]. The efflux of NO from erythrocyte occurs through a trans-nitrosylation process involving the thiol group of the band 3 protein that receives NO from SNO-Hb [7,8].
Erythrocytes scavenger and liberate oxygen and NO at high and low local tissue oxygen partial pressure respectively [9]. Erythrocyte NO efflux is negatively associated with carotid intima-media thickness and an independent predictor of this structural anomaly [10]. Erythrocyte deformability is a biorheological influent factor on blood viscosity, cellular oxygenation and a biomarker of acute and chronic inflammation [11].
An inverse relationship between erythrocyte ability to reversibly change its shape with nitric oxide (NO) efflux, from erythrocytes, was reported in patients with hypercholesterolemia, hypertension and renal transplant [12]. High concentrations of oxidized LDL when in presence of healthy human erythrocytes increase its ability to scavenge NO [13].
The aim of this work was to evaluate in vitro, the effects on erythrocyte nitric oxide (NO) metabolism and its deformability under presence of lipoproteins LDL /HDL.
General reagents were purchased by Sigma- Aldrich Co., nitrate reductase from Aspergillus Niger, NADPH (tetra sodium salt), sodium nitrate, sodium nitrite and atropine were all from Sigma Chemical Co., St Louis, MO, USA. The Griess Reagent kit was purchased from Molecular Probes, Eugene, USA. Sodium chloride was purchased from AnalaR (UK) and chloroform and ethanol 95% from MERCK, Darmstadt, Germany. Blood samples were collected into tubes BD VacuntainerTM with Lithium heparin (17 UI/mL) as an anticoagulant. Cholesterol Low-density lipoprotein (LDL)/Cholesterol High-density lipoprotein (HDL) suspension was purchased from Spinreact (Spain) and the initial concentrations were 184.4 mg/dL and 77.6 mg/dL, respectively.
Experimental model in vitro
Blood sampling and incubation procedure - Human venous blood samples were collected from the forearm vein of healthy Caucasian men, after informed consent, at the Portuguese Institute of Blood of Lisbon into tubes with lithium heparin (17 IU/ml) as anticoagulant. This “in vitro” study was performed under the protocol established with the Portuguese Institute of Blood in Lisbon Total blood was divided into three aliquots of 1 mL each and centrifuged at 11000 rpm (Biofuge 15 centrifuge, Heraeus) during 3 min at room temperature.
Then 10 μL of plasma were removed and replaced by the same volume of either physiological serum (Control) or an LDL/HDL suspension ([LDL/HDL]1=18.44/0.776 mg/dL and [LDL/HDL]2=36.88/1.552 mg/dL). With this procedure, no hematocrit variations were obtained. Then the blood samples were homogenized by gently inversion and after an incubation period of 30 min the erythrocyte deformability index was determined.
Then the blood was centrifuged again at 11000 rpm for 5 min (Biofuge 15 centrifuge, Heraeus) at room temperature. The plasma and buffy-coat (leucocytes and platelets) were discarded and the erythrocytes were used to determine the levels of its NO efflux and the content on nitrite/nitrate, peroxynitrite and S-nitrosoglutathione.
Erythrocyte deformability
The erythrocyte deformability for different shear stress (0.30, 0.60, 1.20, 3.00, 12.00, 30.00 and 60.00 Pa) was determined by using the Rheodyn SSD shear stress diffractometer from Myrenne GMBH (Roentgen, Germany) and erythrocyte deformability is expressed as the elongation index (EI) in percentage.
The Rheodyn SSD diffractometer determines RBC deformability by simulating the shear forces exerted by the blood flow and vascular walls on the erythrocytes [14]. Erythrocytes are suspended in a viscous medium and placed between a rotating optical disk and a stationary disk. A well-defined shear force is exerted upon the suspension which forces the erythrocytes to deform to ellipsoids and align with the fluid shear stresses. If a laser beam is allowed to pass through the erythrocyte suspension a diffraction pattern appears on the opposite end. That diffraction pattern will be circular with resting erythrocytes, but becomes elliptical when the erythrocytes are deformed by shear. The light intensity of the diffraction pattern are measured at two different points (A and B), equidistant from the center of the image. The erythrocyte elongation index (EEI), in percentage, is obtained according the following formula: EEI (%) = (A – B)/( A + B) × 100.
Measurement of NO by an amperometric method
Following incubation, the aliquots of blood samples were centrifuged and sodium chloride 0.9% at pH 7.0 was added in order to reach a hematocrit (Ht) of 0.05%. The erythrocyte suspension was mixed by gently inversion of tubes.
For amperometric NO quantification, we used the amino-IV sensor (Innovative Instruments Inc. FL, USA), as previously described [15]. Briefly, after stabilization of the NO sensor immersed in erythrocyte suspensions, the erythrocytes were stimulated with ACh 10 mM and changes in the electric current registered, the change being proportional to the amount of NO efflux from erythrocytes by ACh-stimulated erythrocytes.
Measurement of erythrocyte nitrite and nitrate concentrations
After incubation, the aliquots of blood samples were centrifuged and the supernatant was separated from the pellet to give packed erythrocytes. Nitrite and nitrate levels in the intra-erythrocyte compartment were determined after submitting the pellet of each suspension to hemolysis and hemoglobin precipitation. Hemolysis was induced with distilled water and hemoglobin precipitation with ethanol and chloroform. Nitrite concentration was measured with the spectrophotometric Griess reaction at 548 nm. For nitrate measurement, this compound was first reduced to nitrites in presence of nitrate reductase [16].
Measurement of erythrocyte S-nitrosoglutathione (GSNO)
Colorimetric solutions containing a mixture of sulfanilic acid (B component of Griess reagent) and NEDD (A component of Griess reagent), consisting of 57.7 mM of sulfanilic acid and 1 mg/ml of NEDD, were dissolved in phosphate-buffered solution, pH 7.4 (PBS). To constitute the 10 mM HgCl2 (Sigma-Aldrich) mercury ion, stock solutions were prepared at 0.136 g/50 mL of dimethyl sulfoxide (DMSO) (Aldrich). GSNO was diluted to the desired concentrations, from 7.5 µM to 300 µM, in the colorimetric analysis solutions. Various concentrations of mercury were added to a final concentration of 100 mM. Following gentile shaking, the solution was left to stand for 20 min. A control spectrum was measured at 496 nm against a solution without mercury ion. 300 mL of erythrocyte suspensions preparing as described for nitrite /nitrate were added to the reaction mixture and GSNO concentrations were measured as described by Cook et al. 1996) [17].
Measurement of erythrocyte peroxynitrite
For determinations of peroxynitrite levels the erythrocyte suspensions (10 mL) were incubated with 15 mL of 2,7-dichlorofluorescein diacetate (DCFC-DA) 10-3M, in 3 mL Phosphate buffer (155 mM, pH 7.4) during 30 min, at room temperature according to Possel et al. 1997, [18]. Suspensions of 200 mL of erythrocytes are diluted in the working solution with 1.8mL of the same buffer. The pellets were rinsed and used for fluorescence measurement in a Microplate Reader Fluorospectrophotometer (TECAN Infinity F500) with excitation and emission wavelengths at, 485 and 535 nm, respectively. The concentration of peroxynitrite was finally calculated through a calibration curve previously done in the same conditions.
Statistical analysis
Data are presented as mean ± SD. Differences between the mean values were evaluated by using software GraphPad Prism 5 and analysis test used ANOVA followed the test of multiple comparison of Bonferroni’s. Values were considered statistically significant for p<0.05.
Effects of lipoproteins on erythrocyte S-nitrosoglutathione concentration
Statistically significant values of GSNO concentrations were obtained in the aliquots of blood samples treated with LDL/HDL1 (10.21 ± 1.393 µM) or LDL/HDL2 (10.31 ± 0.889 µM) when compared with the control aliquot 8.589 ± 0.9084 µM (Figure 1).
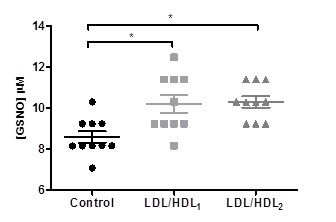
Figure 1. Effects of LDL/HDL suspensions on erythrocyte S-nitrosoglutathione levels in aliquots of blood samples. Values are mean ± SD (N=10) and significant differences were obtained in relation to the control with * p<0.05..
Effects of lipoproteins on the values of nitric oxide efflux from erythrocytes
The values of the efflux of nitric oxide from erythrocytes obtained in the blood aliquots treated with LDL/HDL1 (1.480 ± 0.3190 nM) or LDL/HDL2 (1.820 ± 0.6443 nM) didn´t present any significant differences when compared to the control (1.490 ± 0.3315 nM) (Figure 2).
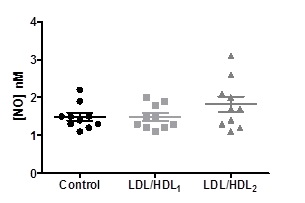
Figure 2. Effects of LDL/HDL suspensions on the values of NO efflux from erythrocytes in aliquots of blood samples. Values are mean ± SD (N=10) and significant differences were obtained.
Effects of lipoproteins on erythrocyte nitrite and nitrate concentrations
Statistically significant higher values (p<0.008) of nitrite concentrations were obtained in the aliquots of blood samples treated with LDL/HDL1 (9.850 ± 1.087 µM) or LDL/HDL2 (10.20 ± 1.101 µM) when compared with the control aliquots 8.500 ± 0.7379 µM. Concerning the values obtained for the nitrate concentrations in the aliquots of blood samples treated with LDL/HDL1 (10.45 ± 1.132 µM) or LDL/HDL2 (10.65 ± 0.8960 µM) they were statistically significant (p<0,002) when compared with the control aliquots 8.900 ± 0.4216 µM (Figure 3).
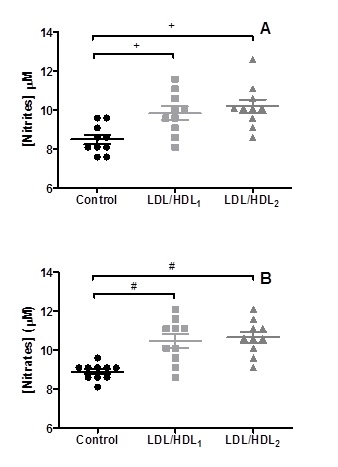
Figure 3. Changes on nitrite (A) and nitrate (B) levels obtained in erythrocyte suspensions incubated with LDL/HDL suspensions. Values are mean ±SD (n=10) and significant differences are relative to the Control with + p<0.008 and # p<0.002.
Effects of lipoproteins on erythrocyte peroxynitrite
The values of peroxynitrite obtained in the blood aliquots treated with LDL/HDL1 (215.3 ± 68.14 mM) or LDL/HDL2 (208.3 ± 46.23 mM) didn´t present any significant differences when compared to the control (241.7 ± 23.44 mM) (Figure 4).
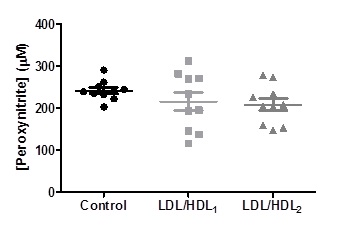
Figure 4. Changes on peroxinitrite levels obtained in erythrocyte suspensions incubated with LDL/HDL suspensions. Values are mean ± SD (n=10) and no significant differences were obtained in comparison to the Control.
Effects of lipoproteins on erythrocyte deformability
The results of erythrocyte elongation index (EEI) values in percentages obtained for the different shear stress (0.30, 0.60, 1.20, 3.00, 6.00, 12.00, 30.00 and 60.00 Pa) applied to control and LDL/HDL1 or LDL/HDL2 blood samples aliquots are presented in Table 1 and Figure 5.
Table 1. Mean ± standard deviation of erythrocyte elongation index (EEI) in percentage for the Control, LDL/HDL1 and LDL/HDL2 groups.
Shear stress (Pa) |
Control |
LDL/HDL1 |
LDL/HDL2 |
0.30 |
2.44 ± 2.19 |
3.66 ± 0.74 |
3.15 ± 1.60 |
0.6 |
6.17 ± 2.24 |
6.83 ± 0.74 |
6.67 ± 2.05 |
1.2 |
13.14 ± 1.88 |
13.56 ± 1.75 |
13.70 ± 2.17 |
3.0 |
25.71 ± 3.20 |
25.84 ± 3.23 |
25.46 ± 4.00 |
6.0 |
33.02 ± 4.32 |
33.09 ± 3.95 |
32.70 ± 4.67 |
12 |
38.27 ± 6.80 |
39.01 ± 6.24 |
37.93 ± 6.42 |
30 |
39.65 ± 2.07 |
41.46 ± 4.53 |
40.05 ± 0.80 |
60 |
39.31 ± 8.13 |
41.91 ± 8.21 |
40.32 ± 7.82 |
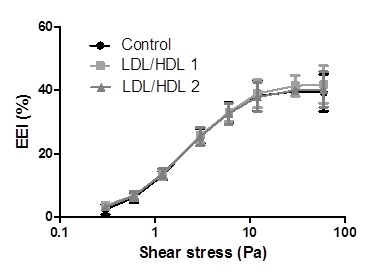
Figure 5. Mean ± SD values of erythrocyte elongation index (EEI) expressed in percentage obtained at shear stress values from 0.3 to 60.0 Pa. No significant differences were obtained in comparison with the Control group.
No statistically significant values were obtained in all the shear stress conditions for the erythrocyte deformability obtained in presence of LDL/HDL1 or LDL/HDL2 or in its absence.
2021 Copyright OAT. All rights reserv
In this in vitro study conducted with blood samples of heathy humans exposed or not (control aliquot) to two different concentrations of LDL/HDL no changes in NO efflux values from erythrocyte, no alterations on intra-erythrocyte peroxynitrite concentrations and an unaltered deformability profile, at all shear stress, were observed (Figures 2, 4 and 5). At variance the levels of NO derivatives molecules nitrite, nitrate and GSNO showed significantly increased values when compared with control aliquots (Figures 1 and 2).
The unchanged deformability values obtained at lower and high shear stress for all treated blood samples aliquots with LDL/HDL is an indicative for membrane stability, internal viscosity maintenance and normal interactions of membrane peripheral and cytoskeleton proteins biomolecules [19-21]. For example the degree of band 3 protein phosphorylation did not affect the EEI values while activation or inhibition of protein kinase C (PKC) increased or decreased it respectively [20,21]. However, if the band 3 phosphorylation degree was increased by PKC activation simultaneously with the blockage of protein tyrosine phosphatase by a specific inhibitor, an increased EEI and higher NO efflux from erythrocytes were evidenced by the presence of acetylcholine [22,23].
LDL particles bind in a non-absolute specific way with erythrocyte membrane while 60% of membrane area can be occupied by HDL as described by Hui [24]. The occupancy of some areas of erythrocyte membrane by the presence of LDL/HDL do not affect erythrocyte deformability profile values in relation to those values verified in the control aliquots (Figure 5). Previously, in other study, the presence of LDL or HDL enrichment interferes in the promotion of erythrocyte aggregation tendency [25]. Significant higher values of erythrocyte aggregation were obtained in HDL enriched aliquots than for LDL enriched ones [25].
The absence of erythrocyte membrane instability obtained in blood samples aliquots under LDL/HDL addition is confirmed by the unchanged nitrogen reactive specie concentration of peroxynitrite, as evidenced by the normal levels obtained (Figure 4). Peroxynitrite is an index of auto-oxidation of oxyhemoglobin [26]. In the present study the addition of different concentrations of the lipoproteins sub fractions’ LDL/HDL seems to do not favor hemoglobin auto oxidation. Consequently, without superoxide anion generation and unchanged values of nitrogen reactive species peroxynitrite concentrations in relation the control aliquots (Figure 4), it was evidenced that when the thiol status of erythrocyte was maintained in normal range, by dithiothreitol, no alterations were verified in erythrocyte deformability [27].
Besides of the unmodified NO efflux and peroxynitrite levels (Figures 1 and 2) it was verified that NO mobilization inside erythrocytes by the increase of the derivatives biomolecule nitrite, nitrate and GSNO concentrations (Figures 1 and 3). Glutathione, an abundant molecule inside erythrocytes, has a thiol group that can react with nitric oxide forming nitrosothiols such as GSNO [28]. The NO reservoir attributed to glutathione could be influenced by the inactivation of glutathione reductase induced by the oxidative stress [29]. The increase GSNO levels is an indicator of reduced of oxidative stress and in this study the levels of peroxynitrite were unchanged under the presence of LDL/HDL. Nitrite and nitrate can be generated from peroxynitrite [30].
This may be one explanation for the maintenance of peroxynitrite levels obtained in treated aliquots. Otherwise, NO could reduce oxyhemoglobin to methahemoglobin along with nitrate formation. These results are intimately related with the unchanged NO efflux from erythrocytes in those blood samples aliquots treated with LDL/HDL (Figure 2).
As anion superoxide or methehemoglobin were not evaluated in the present study, the above reactions are possible explanations of unchanged concentration values obtained for the NO efflux and peroxynitrite. The signal transduction mechanisms needs further detailed studies.
In conclusion, the two additions of LDL/HDL concentrations to blood taken from healthy mans with normal profile of those lipoproteins cholesterol offer a higher range of values without affect erythrocyte ability to deform and rescue and deliver nitric oxide between the normal values. If these results could be extrapolated to in vivo situations the blood flow behavior at microcirculation will not be compromised when in conditions of a small increase of LDL/HDL lipoproteins.
- Stamler JS, Jia L, Eu JP, McMahon TJ, Demchenko IT, et al. (1997) Blood flow regulation by S-nitrosohemoglobin in the physiological oxygen gradient. Science 276: 2034-2037. [Crossref]
- Huang KT, Han TH, Hyduke DR, Vaughn MW, Van Herle H, et al. (2001) Modulation of nitric oxide bioavailability by erythrocytes. Proc Natl Acad Sci U S A 98: 11771-11776. [Crossref]
- Galli FR, Rossi PD, Simplicio A, Floridi, Canestrari F (2002) Protein thiols and glutathione influence the nitric oxide-dependent regulation of the red blood cell metabolism. Nitric Oxide 6: 186-199. [Crossref]
- Murphy ME, Sies H (1991) Reversible conversion of nitroxyl anion to nitric oxide by superoxide dismutase. Proc Natl Acad Sci U S A 88: 10860-10864. [Crossref]
- Huie RE, Padmaja S (1993) The reaction of no with superoxide. Free Radic Res Commun 18: 195-199. [Crossref]
- May JM, Qu ZC, Xia L, Cobb CE (2000) Nitrite uptake and metabolism and oxidant stress in human erythrocytes. Am J Physiol Cell Physiol 279: C1946-1954. [Crossref]
- Gross SS (2001) Vascular biology. Targeted delivery of nitric oxide. Nature 409: 577-578. [Crossref]
- Pawloski JR, Hess DT, Stamler JS (2005) Impaired vasodilation by red blood cells in sickle cell disease. Proc Natl Acad Sci U S A 102: 2531-2536. [Crossref]
- Sonveaux P, Lobysheva II, Feron O, McMahon TJ (2007) Transport and peripheral bioactivities of nitrogen oxides carried by red blood cell hemoglobin: role in oxygen delivery. Physiology (Bethesda) 22: 97-112. [Crossref]
- Santos MJ, Pedro LM, Canhão H, Fernandes e Fernandes J, Canas da Silva J, et al. (2011) Hemorheological parameters are related to subclinical atherosclerosis in systemic lupus erythematosus and rheumatoid arthritis patients. Atherosclerosis 219: 821-826. [Crossref]
- Saldanha C, Lopes de Almeida JP, Freitas T, de Oliveira S, Silva-Herdade A (2010) Erythrocyte deformability responses to shear stress under external and internal influences Series on Biomechanics 25: 54-60
- Carvalho F, Maria AV, Guerra J, Moreira C, Braz-Nogueira J, et al. (2006) The relation between the erythrocyte nitric oxide and hemorheological parameters. Clin Hemorheol Microcirc 35: 341-347. [Crossref]
- Napoleão P, Freitas T, Saldanha C (2016) Effect of oxidized LDL on erythrocyte nitric oxide metabolism. Clin Hemorheol Microcirc 64: 971-975. [Crossref]
- Schmid-Schönbein H, Ruef P, Linderkamp O (1996) The shear stress diffractometer Rheodyn SSD for determination of erythrocyte deformability, I. Principle of operation and reproducibility. Clin Hemorheol Microcirc 16: 48.
- Carvalho FA, Martins-Silva J, Saldanha C. (2004) Amperometric measurements of nitric oxide in erythrocytes. Biosens Bioelectron 20:505e8. [Crossref]
- Guevara I, Iwanejko J, Dembin´ska-Kiec´ A, Pankiewicz J, Wanat A, et al. (1998) Determination of nitrite/nitrate in human biological material by the simple Griess reaction. Clin Chim Acta 274:177e88. [Crossref]
- Cook JA, Kim SY, Teague D, Krishna MC, Pacelli R, et al. (1996) Convenient colorimetric and fluorometric assays for S-nitrosothiols. Anal Biochem 238: 150-158. [Crossref]
- Possel H, Noack H, Augustin W, Keilhoff G, Wolf G, (1997) 2, 7-dichlorofluorescein diacetate as a fluorescent marker for peroxinitrite formation. FEBS Letters 416: 175-178. [Crossref]
- Low PS, Willardson BM, Mohandas N, Rossi M, Shohet S (1991) Contribution of the Band 3-Ankyrin interaction to erythrocyte membrane mechanical stability. Blood 77: 1581-1586. [Crossref]
- Saldanha C, Silva AS, Gonçalves S, Martins-Silva J (2007) Modulation of erythrocyte hemorheological properties by band3 phosphorylation and dephosphorylation. Clin Hemorheol Microc 36: 183-194. [Crossref]
- de Oliveira S, Silva-Herdade AS, Saldanha C (2008) Modulation of erythrocyte deformability by PKC activity. Clin Hemorheol Microcirc 39: 363-373. [Crossref]
- Carvalho, FA, Mesquita R, Martins-Silva J, Saldanha C (2004) Acetylcholine and choline effects on erythrocyte nitrite and nitrate levels. J Appl Toxicol 24: 419-427. [Crossref]
- Mesquita R, Pires I, Saldanha C, Martins-Silva J (2001) Effects of acetylcholine and spermineNONOate on erythrocyte hemorheologic and oxygen carrying properties. Clin Hemorheol Microcirc 25: 153-163. [Crossref]
- Hui DY, Noel JG, Harmony JA (1981) Binding of plasma low density lipoproteins to erythrocytes. Biochim Biophys Acta 664: 513-526. [Crossref]
- Saldanha C, Loureiro J, Moreira C, Silva JM (2012) Behaviour of human erythrocyte aggregation in presence of autologous lipoproteins Biochem Res Int 2: 2-10
- Balagopalakrishna C, Manoharan PT, Abugo OO, Rifkind JM. (1996) Production of superoxide from hemoglobin-bound oxygen under hypoxic conditions. Biochem 35: 6393-6398. [Crossref]
- Almeida JP, Carvalho FA, Freitas T, Saldanha C (2008) Modulation of hemorheological parameters by the erythrocyte redox thiol status. Clin Hemorheol Microcirc 40: 99-111. [Crossref]
- Galli F, Rossi R, Di Simplicio P, Floridi A, Canestrari A (2002) Protein thiols and glutathione influence the nitric oxide-dependent regulation of the red blood cell F metabolism. Nitric Oxide 6: 186-199. [Crossref]
- Fujii T, Hamaoka R, Fujii J, Taniguchi N (2000) Redox capacity of cells affects inactivation of glutathione reductase by nitrosative stress. Archives Biochemical Biophysica 378: 123-130. [Crossref]
- Pfeiffer S, Mayer B (1998) Lack of tyrosine nitration by peroxynitrite generated at physiological pH. J Biol Chem 273: 27280-27285. [Crossref]