Introduction: Studies show that food and housing insecurity correlates with poorer health. The relationships are complex and multidirectional. New policies from the Trump Administration encourage states to promote healthcare innovations that could address food and housing. However, measuring the relationships between food, housing and health status to evaluate the effect of these innovations is difficult. Our goal is to use data from a common, national survey to estimate the prevalence of poor or fair health among persons with high rates of food or housing anxiety in 12 states and to compare these measures between states.
Methods: A cross-sectional study using data from 12 states that completed the social context module of the 2015 Behavioral Risk Factor Surveillance System (BRFSS) survey. In total and for each state, we estimated the probability that people with different levels of food/housing anxiety would report poor or fair health.
Results: We calculated a 48.12% probability that people who are always or usually worried about having enough money for food and housing have poor or fair health, compared to 27.69% probability among people who only sometimes worry about having enough money for food or housing.
Conclusion: The relationships between food and housing insecurity and health status can be measured using the BRFSS. Also, people who always or usually worry about having enough money for food or housing are measurably and significantly more likely to report poor or fair health compared to people who only sometimes or rarely/never worry about having enough money for food or housing.
food, housing, health status, Behavioral Risk Factor Surveillance System, social determinants of health
About 12.3% of U.S. households, representing about 15% of the population, were classified food insecure in 2016. Most studies of food insecurity have focused on children with some focused on seniors but with relatively little research focused on non-senior adults. The research repeatedly found food insecurity is associated with poorer health outcomes [1].
While definitions of housing insecurity vary, about 19 million people pay more than one half of their income on housing and about 600,000 are homeless [1]. One study using the 2011 Behavioral Risk Factor Surveillance System (BRFSS) survey data of 8,415 respondents in Washington State found that housing insecure respondents were about twice as likely as those who were not housing insecure to report poor or fair health status [2].
Another study, using the 2015 BRFSS survey, looked at 11 states plus the District of Columbia to assess the independent effects of housing and food insecurity, chronic conditions, and demographics on health care access and health status. The study concluded that chronic illness independently affects housing and food insecurity and that food and housing anxiety leads to reduced access to care, likely due to cost concerns, and correlates with poorer health [3].
Nonetheless, a recent environmental scan and literature review revealed a wealth of measurement activities related to food insecurity and housing instability but fewer measurement activities that attempt to quantify the association between food and housing insecurity and health [4].
The objective of this study is to consider whether estimated probabilities based observational data from the BRFSS survey may be used to measure the associations between food and housing insecurity and health status and the effects of interventions.
Data Source
We conducted a cross-sectional study using data collected from the 2015 BRFSS survey. The BRFSS is a state-based surveillance system operated by state health departments in collaboration with the United States (US) Centers for Disease Control and Prevention (CDC). The objective of the BRFSS is to collect uniform, state-specific data on preventive health practices and risk behaviors linked to chronic diseases, injuries, and preventable infectious diseases in the adult population.
Data were included for eleven states plus the District of Columbia: Alabama, Arkansas, Delaware, Georgia, Louisiana, Minnesota, Mississippi, Missouri, Rhode Island, Tennessee and Utah. (To simplify, the 11 states plus the District of Columbia are referred to as “the 12 states.”) These were chosen because these were the only states that used the same version of the optional supplemental social context module which included questions about food and housing anxiety as part of their 2015 BRFSS survey. All BRFSS questionnaires, data, and reports are available online [5]. The social context module was available from 2009 to 2015 but was not included in the 2016 BRFSS. New questions about food security have been incorporated into a social determinants of health module for the 2017 BRFSS. Because the results of the 2017 BRFSS will not be available until the third quarter, 2018, the 2015 BRFSS represents the most recently available data that includes the food and housing questions.
BRFSS uses a weighting system to extrapolate from the survey sample to the state population. Such weighting serves as a blanket adjustment for noncoverage and nonresponse and forces the total number of cases to equal population estimates for each geographic region, which for the BRFSS sums to the state population [6]. All estimates of frequency or percentages are weighted values using the BRFSS “final weight.”
The 2015 social context module included two questions about food and housing insecurity: “How often in the past 12 months would you say you were worried or stressed about having enough money to buy nutritious meals?” and “How often in the past 12 months would you say you were worried or stressed about having enough money to pay your rent/mortgage?”. The answer choices for both questions were: Always, Usually, Sometimes, Rarely, Never, don’t know/Not Sure, Not Applicable and Refused.
The core survey includes several questions about health status including general health, physical health and mental health as well as questions about specific health conditions. For this study, the analysis is limited to one question focused on general health: “Would you say that your general health is:”. The answer choices were: Excellent, Very Good, Good, Fair, Poor, Don’t Know/Not Sure and Refused.
Statistical Analysis
All statistical analyses were conducted using SAS 9.4 software. We first looked at descriptive statistics by state and in total for food and housing anxiety and general health. Ordinal data were summarized using weighted percentages (+/– 95% confidence intervals [CI]). For each state, we calculated the mean, median, standard deviation and range for each of the combinations of independent and dependent variables. To address the complex and multi-directional relationships of the three variables, in various analyses, each of the three variables was treated as an independent or dependent variable. We used chi-square tests to evaluate the null hypothesis, that there is no relationship between food insecurity, housing insecurity and general health status.
To simplify and extract more meaningful information, we combined survey responses for each question reducing them from five answer categories to three answer categories. The consolidated answer categories for food and housing insecurity are: always or usually worried, sometimes worried, and rarely or never worried. For general health status the consolidated answer categories are: poor or fair health, good health and very good and excellent health.
For all 12 states collectively and for each state individually, we calculated the percentage of people who reported their general health as poor or fair and who also reported that they were always or usually worried about having enough money for food or housing. We compared those percentages to the percentage of people who reported their health as fair or poor but who reported that they sometimes or rarely/never worry about having enough money for food or housing. We also calculated the percentages of people who reported sometimes or rarely/never worry about food or housing by health status.
Using ordinal logistic regression models, we calculated the odds ratios (OR) using food and housing insecurity as the independent variable and general health status as the dependent variable. We also calculated the OR using general health status as the independent variable and food and housing as dependent variables. From these OR values, we calculated probabilities for each combination of independent and dependent variables.
The 12 states included in this study represent approximately 15 percent of the total U.S. population. Response rates for the 12 states ranged from 38.1% to 61.1% (median = 43.8%). The number of people who responded to the three questions (N) were: general health status—73,394, food insecurity—73,360 and housing insecurity—69,502.
The null hypothesis, that there is no relationship between food or housing insecurity and general health status, was evaluated using chi-square tests. At a 95 percent confidence level, the p-values for all values were < 0.001, thus rejecting the null hypothesis.
Of the total weighted frequencies for general health status of 30,725,459 (N), 19.27% (95% CI: 16.71—20.08) reported poor or fair health, 31.34% (95% CI: 30.56—32.11) reported good health and 49.01% (95% CI: 47.77—50.25) reported very good or excellent health. Among those who reported poor or fair health, 44.92% reported that they always or usually worried about having enough money for food while 29.20% reported that they sometimes worry and 13.61% reported that they rarely or never worry. With respect to housing insecurity, 40.21% reported that they always or usually worried about having enough money for housing while 22.15% reported that they sometimes worry and 13.13% reported that they rarely or never worry. These results for all 12 states as well as for each individual state are shown in Table 1.
Table 1. The percentage of people reporting levels of general health by food and housing insecurity, by state and overall. This table shows the percentage of people reporting levels of general health by food and housing insecurity, by state and overall. It provides the summary detail from which the other tables and figures were derived.
|
How often worry about money for food* |
How often worry about money for housing* |
State |
General Health Status |
Always/ Usually
worried about food %,
(95% CI) |
Sometimes
%, (95% CI) |
Rarely/ Never
%, (95% CI) |
Always/ Usually
worried about housing %,
(95% CI) |
Sometimes
%, (95% CI) |
Rarely/ Never
%, (95% CI) |
AL |
Very good/Excellent |
23.27 |
34.82 |
50.97 |
22.46 |
37.00 |
53.21 |
|
Good |
27.03 |
31.45 |
33.82 |
33.12 |
39.11 |
32.08 |
|
Poor/Fair Health |
49.71 |
33.73 |
15.21 |
44.42 |
23.88 |
14.71 |
AR |
Very good/Excellent |
15.18 |
35.60 |
48.22 |
22.24 |
33.63 |
50.91 |
|
Good |
33.15 |
29.25 |
35.53 |
30.90 |
41.74 |
32.03 |
|
Poor/Fair Health |
51.67 |
35.16 |
16.25 |
46.86 |
24.64 |
17.06 |
DE |
Very good/Excellent |
26.70 |
37.66 |
57.17 |
27.48 |
42.40 |
59.30 |
|
Good |
31.20 |
30.76 |
30.72 |
34.48 |
34.13 |
28.75 |
|
Poor/Fair Health |
42.09 |
31.58 |
12.11 |
38.04 |
23.47 |
11.96 |
DC |
Very good/Excellent |
35.68 |
39.32 |
67.42 |
40.64 |
46.21 |
68.67 |
|
Good |
29.92 |
33.13 |
23.92 |
26.71 |
35.20 |
23.92 |
|
Poor/Fair Health |
34.40 |
27.55 |
8.65 |
32.65 |
18.59 |
7.41 |
GA |
Very good/Excellent |
24.74 |
38.58 |
53.48 |
29.13 |
39.68 |
55.71 |
|
Good |
30.39 |
33.05 |
33.23 |
33.86 |
36.15 |
31.58 |
|
Poor/Fair Health |
44.87 |
28.37 |
13.29 |
37.01 |
24.17 |
12.72 |
LA |
Very good/Excellent |
24.48 |
36.31 |
52.88 |
24.53 |
40.50 |
55.07 |
|
Good |
27.92 |
33.78 |
31.67 |
29.68 |
39.28 |
29.46 |
|
Poor/Fair Health |
47.61 |
29.91 |
15.45 |
45.79 |
20.22 |
15.47 |
MN |
Very good/Excellent |
34.72 |
45.44 |
62.18 |
36.41 |
48.67 |
63.69 |
|
Good |
30.54 |
34.27 |
28.37 |
31.69 |
37.29 |
27.08 |
|
Poor/Fair Health |
34.73 |
20.29 |
9.45 |
31.89 |
14.04 |
9.23 |
MS |
Very good/Excellent |
25.32 |
34.07 |
50.86 |
29.54 |
38.68 |
52.44 |
|
Good |
28.29 |
32.66 |
31.94 |
30.45 |
34.65 |
31.18 |
|
Poor/Fair Health |
46.40 |
33.26 |
17.20 |
40.01 |
26.67 |
16.38 |
MO |
Very good/Excellent |
27.77 |
38.80 |
55.19 |
27.43 |
45.76 |
55.71 |
|
Good |
31.54 |
34.75 |
30.78 |
32.57 |
31.67 |
31.36 |
|
Poor/Fair Health |
40.69 |
26.46 |
14.04 |
40.00 |
22.57 |
12.92 |
RI |
Very good/Excellent |
28.04 |
36.82 |
61.54 |
31.09 |
43.00 |
63.46 |
|
Good |
34.21 |
39.05 |
26.73 |
33.76 |
37.11 |
25.63 |
|
Poor/Fair Health |
37.75 |
24.13 |
11.73 |
35.15 |
19.89 |
10.91 |
TN |
Very good/Excellent |
21.21 |
31.57 |
51.87 |
18.16 |
42.66 |
52.68 |
|
Good |
27.02 |
34.17 |
32.13 |
36.14 |
30.86 |
31.63 |
|
Poor/Fair Health |
51.77 |
34.26 |
16.00 |
45.7 |
26.48 |
15.70 |
UT |
Very good/Excellent |
38.23 |
48.96 |
64.21 |
38.14 |
52.65 |
65.15 |
|
Good |
34.98 |
32.40 |
26.89 |
38.58 |
33.12 |
25.96 |
|
Poor/Fair Health |
26.80 |
18.65 |
8.89 |
23.28 |
14.22 |
8.89 |
Totalǂ |
Very good/Excellent |
25.31 |
37.63 |
55.01 |
26.90 |
42.09 |
56.73 |
|
Good |
29.77 |
33.17 |
31.39 |
32.90 |
35.77 |
30.14 |
|
Poor/Fair Health |
44.92 |
29.20 |
13.61 |
40.21 |
22.15 |
13.13 |
Figure 1 shows a summary of the percentage of people reporting poor or fair health according to their level of food or housing anxiety. When compared to people who only sometimes worry about food or housing, people who are always or usually worried about food are about 15% more likely, and people who are always or usually worried about housing are about 18% more likely, to report poor or fair health as opposed to good or very good/excellent health. Similarly, people who sometimes worry about having enough money for food or housing are about 15% and 9% respectively more likely to report poor or fair health than are those who report they sometimes worry about having enough money.
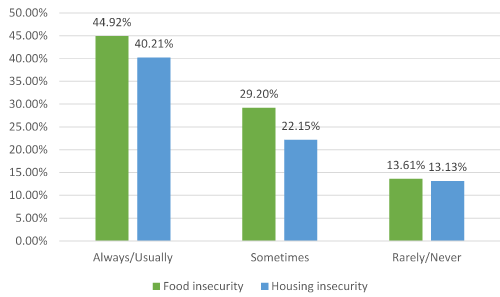
Figure 1. Percentage reporting poor or fair health, by frequency of food or housing anxiety. This figure shows for all 12 states (11 states plus the District of Columbia), including only those people who report they have poor or fair health, the percentage of people who report variously that they always/usually worry, sometimes worry, or never/rarely worry about having enough money for food or housing. Note the disparity between the three groups, which is consistent between food and housing.
|
Always/Usually |
Sometimes |
Rarely/Never |
Food insecurity |
44.92% |
29.20% |
13.61% |
Housing insecurity |
40.21% |
22.15% |
13.13% |
In Figure 2, at the state level, the data show a consistent association between food and housing insecurity and general health.
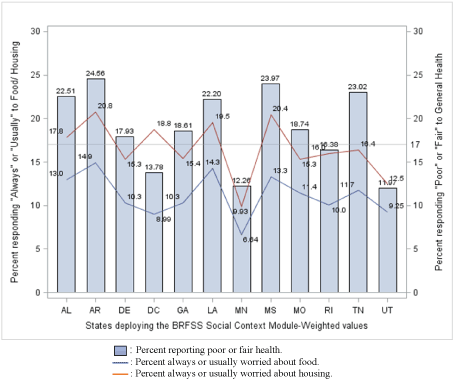
Figure 2. Association between food and housing insecurity and general health status by state. This table shows the percentage of people who report they have poor or fair health by state compared to the percentage that are always or usually worried about having enough money for food or housing. Note that the patterns are generally consistent, although the range varies between those states with better health and those having poorer health.
Table 2 shows estimated probabilities derived from odds ratios calculated using multiple ordinal logistic regression.
Table 2. Estimated probabilities for a person to have good health or poor/fair health based on levels of food and housing insecurity. aExcludes answers like Not Sure, NA and Refused. This table shows the estimated probability that a person who has various levels of food and housing insecurity reports either poor/fair health or good health. For people who are always or usually worried about having enough money for food or housing there is a 48.12% probability that they will also have poor or fair health compared to a 27.69% probability for people who are only sometimes worried about having enough money for both food and housing. Similarly, for people who are always or usually worry about having enough money for food or housing there is a 30.25% probability they will report good health, compared to 34.47% who report they only sometimes worry about having enough money.
Good Healtha |
Food Insecurity |
Housing Insecurity |
|
| |
Always/Usually |
Sometimes |
Rarely/Never |
Always/Usually |
30.25% |
32.78% |
29.32% |
Sometimes |
33.53% |
34.47% |
29.48% |
Rarely/Never |
38.19% |
36.93% |
30.18% |
Poor/Fair Healtha |
Food Insecurity |
Housing Insecurity |
|
| |
Always/Usually |
Sometimes |
Rarely/Never |
Always/Usually |
48.12% |
37.32% |
30.02% |
Sometimes |
37.63% |
27.69% |
21.30% |
Rarely/Never |
24.35% |
16.85% |
12.39% |
In table 2, food and housing insecurity are the independent variables and general health status is the dependent variable. The table shows the probability that a person with various levels of food and housing insecurity would have poor or fair health versus good health. As shown, the probability of a person who always or usually worries about food and housing will have poor or fair health is 48.12% while the probability of a person who only sometimes worries about both food and housing has a 27.69% probability of having poor or fair health.
Table 3 shows the reverse of the independent and dependent variables with general health status being the independent variable and food and housing insecurities being the dependent variables.
Table 3. Estimated probabilities for a person to worry about food or housing based on levels of general health status. aExcludes answers like Not Sure, NA and Refused. This table shows the estimated probability that a person who has various levels of health status will also report various levels of food or housing anxiety. For people who report poor or fair health there is a 45.00% probability that they will be always or usually worried about having enough money for food, compared to only 33.01% for people who report good health. Similarly, for people who report they have poor or fair health, there is a 40.18% probability that they will always or usually worry about having enough money for housing, compared to 35.76%. who report they have good health.
Food Insecuritya |
| |
Poor/Fair Health |
Good Health |
Very Good/ Excellent Health |
Always/Usually |
45.00% |
30.44% |
24.56% |
Sometimes |
29.28% |
33.01% |
37.71% |
Rarely/Never |
13.55% |
31.46% |
55.00% |
Housing insecuritya |
| |
Poor/Fair Health |
Good Health |
Very Good/ Excellent Health |
Always/Usually |
40.18% |
32.84% |
26.98% |
Sometimes |
22.14% |
35.76% |
42.10% |
Rarely/Never |
13.12% |
30.13% |
56.75% |
The probability that a person with poor or fair health will report they are always or usually worried about having enough money for food or housing is 45.00% and 40.18% respectively, compared to 30.44% and 32.84% for people who report they have good health.
Trends and patterns
For all 12 states, the mean of the percentage reporting poor or fair health was 18.83% percent. The overall mean of the percentage reporting always or usually worried in answer to the food and housing questions were 12.40% and 17.63% respectively. Eight states report that more than 17% of the population have poor or fair health and 4 states (including the District of Columbia) report less than 17% have poor or fair health. For the eight states reporting more than 17% with poor or fair health, the range was from 17.93% to 24.56% with a mean of 21.44%. For the three states plus the District of Columbia reporting less than 17% having poor or fair health, the range was from 11.97% to 16.38% with a mean of 13.60%.
Arkansas had the highest percentages for each question while Utah had the lowest percentage of people with poor or fair health while Minnesota, with the second lowest percentage of poor or fair health, had the lowest percentages of people worried about having enough money for food or housing.
2021 Copyright OAT. All rights reserv
For those states where the percentage of people have poor or fair health greater than 17%, the averages were 21.44% for poor or fair health, 12.40% for food insecurity and 17.63% for housing insecurity. This compares to the four states with less than 17% reporting poor or fair health with an average of 13.60% poor or fair health, 8.73% for food insecurity and 14.28% for housing insecurity.
Although the percentage of people who are always or usually worried about having enough money for housing is higher in every state than the percentage of people who are always or usually worried about food, the variability among the states was greater for with respect to housing than for food. The range of the percentages reporting always or usually worried about housing was 10.85% compared to 8.28% for food.
The mean of the difference between the percentages of people worried about housing is 5.37% higher than for people worried about food. However, differences between the two percentages is greater for the District of Columbia (9.80%) and Rhode Island (6.10%) than for any other state, although Arkansas is close (5.90%). It should also be noted that Rhode Island and the District of Columbia are the two smallest states in this study.
Policy implications
In December, 2017, the National Quality Form, at the request of the Center for Medicare and Medicaid Services (CMS), published a set of recommendations for state Medicaid agencies that address food and housing insecurity in the context of healthcare. The report, titled "A Framework for Medicaid Programs to Address Social Determinants of Health: Food Insecurity and Housing Instability," (Framework) provides excellent background on the association between food and housing insecurity and health status and includes suggestions for how Medicaid agencies can influence healthcare providers to address food and housing insecurities as well as other social determinants of health. However, the report does not contain guidance about how to measure either the baseline or the effect of interventions on food, housing or health status [7].
This study suggests that the BRFSS survey may be useful in support of the Framework to measure the relationships between food and housing insecurity and health status and to quantify the effectiveness of interventions. As important, BRFSS questions can be harmonized with other screening and health assessment tools to become an integral part of the healthcare system. Ideally, these measures could also be used to guide policy and evaluate the effectiveness of food, housing and health interventions that improve individual and population health and lower cost.
Opportunities for further research
The observations of this study need to be validated by comparing these observations and probabilities to the results of studies that measure the effect of specific interventions. Additional research should also be conducted with the BRFSS data to look at additional variables and relationships for physical health, mental health and other social determinants of health. In addition, comparing these results to public and private payer spending patterns at the state level and within each state may also provide valuable insights as well as provide the foundation for comparing, selecting and evaluating specific interventions. The new Social Determinants of Health module implemented in 2017 should provide important data and, hopefully, will continue to be included for the next several years, allowing year-to-year analysis.
The advantage of the BRFSS data is the large population-based sample, which can allow for more precise population-level comparisons. That said, the BRFSS data used in this study consists of cross-sectional observations, which cannot provide evidence for causality. The data is also vulnerable to potential recall or response bias and recording or interviewer errors of telephone and cellular surveys and other self-reported data. There may be additional confounding variables that have not been controlled. The findings of this study cannot be extended to the entire country as the data are derived only from states that selected to administer the Social Context module.
This study shows that the relationships between food and housing insecurity and health status can be measured using the BRFSS, an established annual survey, particularly with the now retired Social Context module or the new Social Determinants of Health module. It also shows that people who always or usually worry about having enough money for food or housing are measurably and significantly more likely to report poor or fair health compared to people who only sometimes or rarely/never worry about having enough money for food or housing. It shows that these relationships are generally consistent across states, even when comparing states with better overall health with states that have poorer overall health. While this study is not intended to address causality in these relationships nor does it consider the effect of specific interventions, it does provide the foundation for measures to support further investigation in these areas through the BRFSS. Ultimately these measures may contribute to improved individual health, increased population health and lower total health related cost.
The authors wish to acknowledge the assistance of CDC and the state health agencies that conducted the 2015 BRFSS survey and shared their data. This manuscript was prepared or accomplished by the authors in their personal capacity. The authors received no financial support for this study or manuscript. The opinions expressed in this article are the authors’ own and do not reflect the view of Indiana University Purdue University at Indianapolis or any other organization.
- USDA ERS (2018) Key Statistics & Graphics. United States Department of Agriculture, Economic Research service.
- Stahre M, VanEenwyk J, Siegel P, Njai R (2015) Housing Insecurity and the Association with Health Outcomes and Unhealthy Behaviors, Washington State, 2011. Prev Chronic Dis 12: E109.
- Charkhchi P, Fazeli Dehkordy S, Carlos RC (2018) Housing and Food Insecurity, Care Access, and Health Status Among the Chronically Ill: An Analysis of the Behavioral Risk Factor Surveillance System. Journal of General Internal Medicine 33: 644–650.
- Gundersen C, Ziliak JP (2015) Food Insecurity And Health Outcomes. Health Aff (Millwood) 34: 1830-1839. [Crossref]
- CDC – BRFSS (2018) Behavioral Risk Factor Surveillance System. Centres for Disease Control and Prevention.
- CDC (2015) Behavioral Risk Factor Surveillance System Weighting BRFSS Data Introduction: Weighting Rationale. Centres for Disease Control and Prevention.
- The Centers for Medicare & Medicaid Services (2017) A framework for Medicaid programs to address social determinants of health: food insecurity and housing instability. Final Report. The National Quality Forum.